Добавил:
Опубликованный материал нарушает ваши авторские права? Сообщите нам.
Вуз: Предмет: Файл:

Professional Visual Studio 2005 (2006) [eng]

.pdf
Скачиваний:
132
Добавлен:
16.08.2013
Размер:
21.9 Mб
Скачать

Chapter 56

Figure 56-5

Office Integration

Being able to view the status of work items using SharePoint is sufficient for stakeholders that do not play an active role in the project. However, for project managers who need to be able to update work items and lodge and/or update bug and requirements information, this interface is not sufficient. Although these updates can be performed from within Visual Studio, quite often these stakeholders will either not have access to Visual Studio or not be familiar with the product. For this reason Team System provides a rich extension to Office that enables Excel and Project to be used to add and edit work items.

To view a set of work items in Excel or Project, select the query from the Team Explorer. The results of this query appear in the main window. Above this window is a toolbar, as shown in Figure 56-6. The middle icons can be used to export the current query results to either Excel or Project.

Figure 56-6

A couple of nice artifacts result from using these Office applications to manipulate work items. First, because most people are familiar with these products, working with them is second nature, meaning users can generate the information they are interested in quickly and effectively. Second, information can be worked on even when no connection to the server is available.

806

Visual Studio Team System

Unlike the Visual Studio interface, which relies heavily on a link to the server to execute queries and open and close work items, once the Office document has been built, it can be worked on without any interaction with the server. In order for the changes to be made available to other project team members, the document needs to be synchronized with the server. This can be done using the Team Foundation toolbar that appears within the Office application. Figure 56-7 shows the same query results shown in Figure 56-4 within Excel. Here the work items can be edited and then published back to the server.

Figure 56-7

Source Control Explorer

Although Source Control appears as a node under each project in the Team Explorer, it is only there as a shortcut for bringing up the Source Control Explorer. This explorer can also be found in the Other Windows list on the View menu.

As discussed in Chapter 8, Team Foundation Server exposes a completely reengineered source code repository that is available to developers using Team System. Although the interface has been changed to incorporate new functionality such as workspaces, branching, and shelving, it should still be familiar enough to anyone who has worked with source control in Visual Studio in the past.

For Software Architects

One of the weaknesses of Visual Studio in the past was that it didn’t provide support for software architects. Team System provides a rich user interface for architects to design the system architecture. These are not just static diagrams that have to be manually updated to keep them in sync with the project. As with the Class Designer discussed in Chapter 25, the distributed system diagrams are a visualization of the actual application architecture.

Application Diagram

During the design of an application, an important decision that must be made early on is the architecture of the application. An application diagram is the first of four distributed system diagrams that can be created using Team System. Figure 56-8 illustrates a windows application that accesses data from a database via an ASP.NET web service.

807

Chapter 56

Figure 56-8

Application components can be added to the design surface by selecting them from the toolbar. Once added to the diagram, the component can be arranged on the diagram and connected to existing components using connectors. Properties, such as the name of the component, can be adjusted using the Properties window. More specific settings for a component can be set using the Settings and Constraints pane in the lower half of the window.

Once the architecture has been mapped out on the application diagram, the various components can be automatically generated directly from the diagram. When the application diagram does not align with the solution structure, the missing projects can be implemented by selecting the Implement All Applications from the Implementation option from the Diagram menu. This prompts you to confirm the creation of the new project, as shown in Figure 56-9. A word of caution: Once the project has been created, some properties, such as the default namespace, will be difficult to modify.

Logical Datacenter Diagram

While the application diagram is useful for architecting an application, to deploy an application successfully it is important to make sure the application can be mapped to the target infrastructure. The first step in this process is to define the target infrastructure. In the past this has again been the role of thirdparty tools. With Team System you can create a logical datacenter diagram to map out the proposed infrastructure. Although the intent of this diagram is for application deployment, it can also be useful for the documentation of an organization’s infrastructure. Figure 56-10 shows the proposed infrastructure for a small organization proposing to deploy the three-tier application discussed earlier.

808

Visual Studio Team System

Figure 56-9

Figure 56-10

Figure 56-10 contains three main entities: the Windows client, the IIS web server, and the database server. It also shows that the web server is contained within a DMZ. All communications between the Windows client, which might be across the Internet, and the database server, which will be internal to the organization, must be transferred via the DMZ.

809

Chapter 56

Similar to the application diagram, the logical datacenter diagram includes the Toolbox, the Settings and Constraints window, and the Properties window, which can be used to fine-tune the datacenter diagram to match the infrastructure.

System Diagram

The set of applications defined in the application diagram typically have a number of settings that need to be configured based on how the system is to be deployed. Using a systems diagram, an instance of the application can be preconfigured and saved. An example of this is shown in Figure 56-11, which again shows our three-tier application, this time with settings preconfigured ready for deployment.

Figure 56-11

Deployment Diagram

The final distributed systems diagram combines the previous three diagrams to evaluate how the system will map to the proposed infrastructure. When this diagram is created, the contents of the datacenter diagram appear on the design surface. Each entity has placeholders for locations to which you can drag an application from the System View toolbar. Figure 56-12 shows such a diagram whereby the database tier has been bound to the database server.

At any point, a report can be generated about the proposed deployment on the target infrastructure. This can be used to review the changes needed to successfully deploy the application. Once the diagram has been successfully validated, the deployment team can use the deployment report to ensure that the infrastructure and applications are configured appropriately.

Figure 56-13 shows the top portion of a deployment report indicating several errors were generated because the diagram could not be validated.

810

Visual Studio Team System

Figure 56-12

Figure 56-13

For Software Developers

In addition to writing lines of code, developers also have to make sure that they adhere to coding standards, perform reviews and refactor code for performance, write test cases to ensure their code meets the requirements, and finally build the application so it can be deployed. In the past, each of these tasks has involved a third-party product, as the functionality was not built into Visual Studio.

811

Chapter 56

Code Analysis

Most development teams have a set of documented or agreed upon coding standards. Unfortunately, very few teams actually enforce these standards, as even a stringent reviewing process would fail to identify all the nonconformances. The only true way to enforce coding standards is to use a tool that automates the process of reviewing code and reports any cases in which a standard has not been met. In Chapter 7 you saw that you can enable code analysis from the Project properties window so it is run every time the project is built. Unfortunately, this can be a time-consuming task, so it is often better to run this as required from the Build menu.

Code analysis searches for any code that does not conform to the coding standards, reporting its findings in the Error List window, as shown in Figure 56-14.

Figure 56-14

Performance Analysis

While static code analysis is a good way to pick up on a lot of potential issues in code, it will not pick up runtime performance issues. Applications can perform poorly for a number of reasons, but they can usually be tracked back to issues that can be easily identified by reviewing memory consumption. These reviews can include looking at the number and frequency of object allocation, the duration and size of objects in memory, and the location and class stack from which objects were created. The best way to review this information is using a profiling tool to monitor an application as it is running.

Profiling an application with Visual Studio Team System begins with the Performance Wizard, which creates a new performance session. To illustrate this, analyze a small section of code that handles the Click event of a button:

Public Class Form1

Private Sub Button1_Click _

(ByVal sender As System.Object, _

ByVal e As System.EventArgs) Handles Button1.Click

Windows.Forms.Cursor.Current = Cursors.WaitCursor

For i As Integer = 0 To 100000

Dim str As New String(“a”c, i)

Next

End Sub

End Class

Start by clicking Tools Performance Tools Performance Wizard. Stepping through the wizard generates a new performance session that appears within the Performance Explorer window, as shown in Figure 56-15.

812

Visual Studio Team System

Figure 56-15

Prior to running the analysis, two options should be considered, as they affect the report that is generated. Properties for the Performance Session node can be opened from the right-click context menu in the Performance Explorer. For the most detailed profiling information, both options in the .NET Memory Profiling Collection (on the General tab) should be checked. This ensures that object allocation and lifetime information will be tracked.

To analyze the application, it needs to be run from within the Performance Explorer. This is done by clicking the play button from the toolbar within the Performance Explorer. Each time the performance analysis is run, a new report is generated and added to the performance session. An example report is shown in Figure 56-16.

Figure 56-16

Each performance report is divided into a number of tabs that present the analysis information. The initial page summarizes memory allocation by function and by type. On the other tabs this information is presented in a different format to show the most frequently used functions, where functions were being called from, the allocation of objects, and a breakdown of the object lifetimes.

The performance summary in Figure 56-16 indicates that there are significantly more String instances than any other types and that they consume several orders of magnitude more memory than any other type. This, coupled with the String constructor being the function that allocates most memory, is a sure indicator that something is wrong with the way the application is behaving. If you drill down into the Objects Lifetime tab, you can see from Figure 56-17 that again the String object dominates the list of

813

Chapter 56

objects. More significant, a large number of String objects were collected from Generation 1, Generation 2, and the Large Object Heap (the third, fourth, and fifth columns from the left, respectively). This is a good indicator that these objects are not being collected as frequently as they should be.

Figure 56-17

From the snippet of code for which you were running the performance analysis, you can see that in each iteration of the loop, a new String was being created. The performance analysis indicates that not only are some very large String objects being allocated, the Garbage Collector is not collecting them in a timely manner. Examining the code a little more closely, you can see why: The length of the String is dependent on the loop index, which grows considerably. Most likely, this was supposed to be some other variable. Using the performance analysis, you have located the performance issue.

Build Automation

Although Visual Studio has always provided a rich environment in which developers can write and build applications, it has lacked the capability to automate building and testing applications. Building applications could be done manually by calling Visual Studio from the command line, or in a batch file, but this was tedious to set up. Team System includes a feature called Team Build, which provides a rich user interface to the new build engine, MSBuild, that has been released in conjunction with Visual Studio. As discussed in Chapter 7, project files are now build configuration files because they determine what MSBuild should do when an application is built. However, Team Build also enables development teams to define build types, which may include a number of projects, tests, and activities, and to schedule these to be run on remote computers.

In Figure 56-1 you saw the project structure within the Team Explorer window. At the bottom of this structure is a node entitled Team Builds, which contains all the build types for a project. To take advantage of being able to run builds on a remote computer and track build progress and status, you need to define a build type by selecting New Team Build Type from the right-click context menu for the Team Builds node.

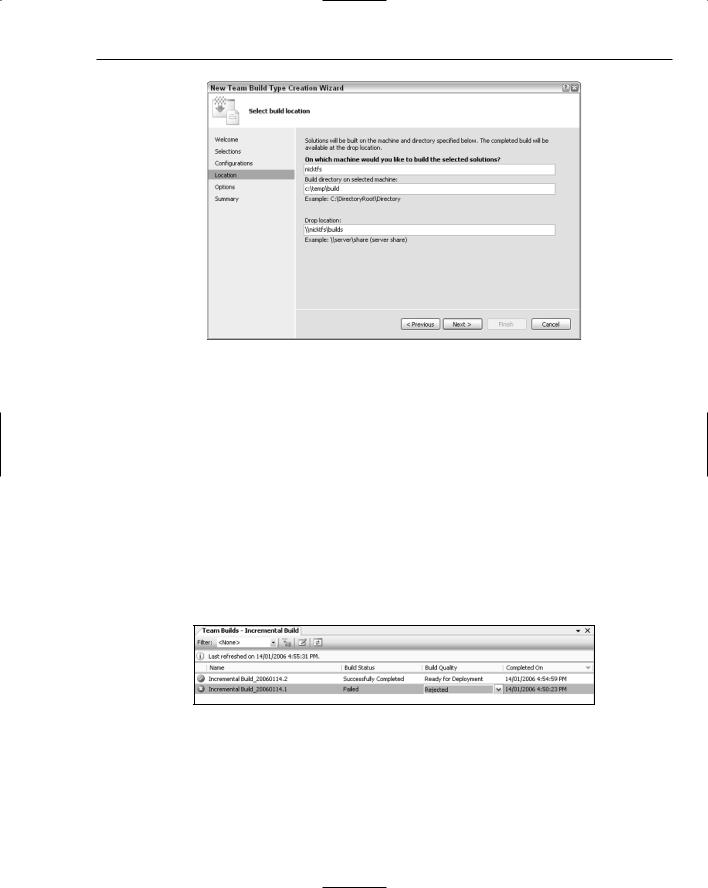
The process of creating a build type requires a number of parameters, such as a name and description for the build, which solutions are to be built (any that are in the source control branch for the Team Project), and which configuration to use when building the selected solutions. The last two pages of the wizard are used to define which machine should be used to build the solutions, where any outputs are to be dropped, and whether to run any test cases or code analysis as part of the build. Figure 56-18 shows

the Creation Wizard dialog, where the build machine and drop location are defined.

814

Visual Studio Team System

Figure 56-18

The machine used for the build process does not need to be the same machine as the Team Foundation server or a development machine. It does, however, need to have the Team Build Service running, which can be installed from the BB directory on the Team Foundation media. Before installing this server, create a separate account, such as TFSBuild, that the service can run as. This account needs to be added to the Build Service security group for each Team Project. It also has to have write access to the drop folder.

The build directory defined is where any temporary files are copied during the build process. To support analysis of a failed build process, this folder is not removed after the build has completed. However, subsequent builds will overwrite the contents of this folder. Conversely, within the drop location each build is assigned a unique directory, such as Incremental Build_20060114.2. This can easily be broken down into the build name, the date of the build, and the build number for that date.

Once the build server has been set up and a build type has been defined, the build type can be either opened, as shown in Figure 56-19, or run, by selecting Build Team Project from the right-click context menu.

Figure 56-19

Figure 56-19 shows two builds that have been run using the Incremental Build; the first failed and the second passed. This build type can be built by clicking the Build toolbar button (third from the right). This opens the Build dialog, which enables you to specify the build location, as shown in Figure 56-20.

815