Добавил:
Опубликованный материал нарушает ваши авторские права? Сообщите нам.
Вуз: Предмет: Файл:

Professional Visual Studio 2005 (2006) [eng]

.pdf
Скачиваний:
132
Добавлен:
16.08.2013
Размер:
21.9 Mб
Скачать

Part IX

Debugging and

Testing

Chapter 48: Using the Debugging Windows

Chapter 49: Debugging Breakpoints

Chapter 50: Debugging Proxies and Visualizers

Chapter 51: Maintaining Web Applications

Chapter 52: Other Debugging Techniques

Chapter 53: Unit Testing

Using the Debugging

Windows

This chapter examines the numerous windows available in Visual Studio 2005 to support you in building and debugging applications. Debugging applications is one of the hardest tasks developers have to tackle, but correct use of the Visual Studio 2005 debugging windows will help you analyze the state of the application and determine the cause of any bugs.

Code Window

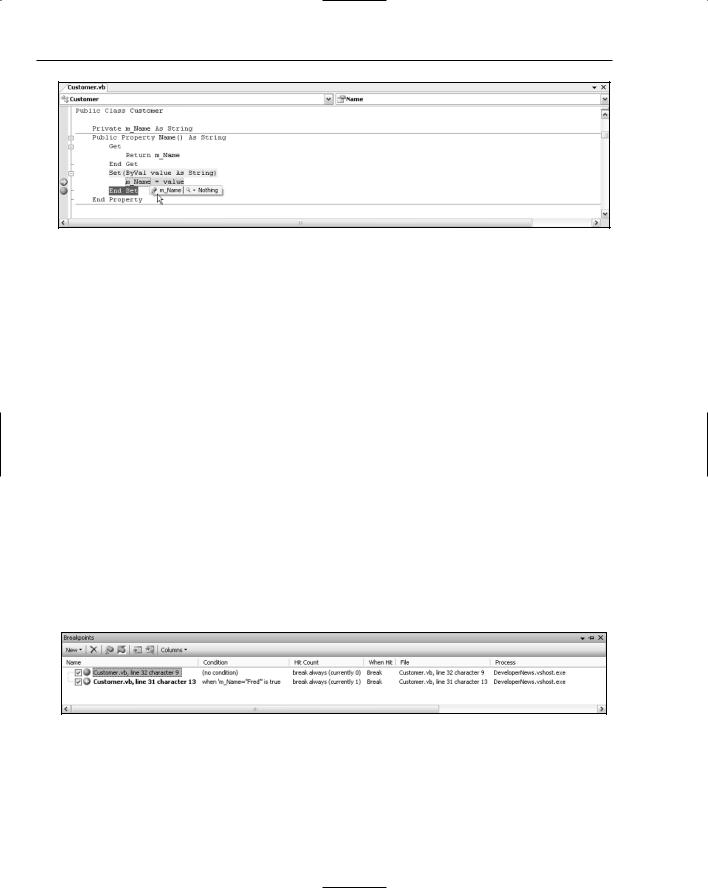
The most important window for debugging purposes is, of course, the code window. With the capability to set breakpoints and step through code, this window becomes the basis for nearly all debugging. Figure 48-1 shows a simple snippet of code with both a breakpoint and the current execution point visible.

Breakpoints

The first stage in debugging an application is usually to identify the area that is causing the error by setting a breakpoint and gradually stepping through the code. Setting breakpoints and working with the current execution point is covered in more detail in the next chapter. Although you can’t see the color in Figure 48-1, breakpoints are marked in the code window with a red dot in the margin of the page and red highlighting of the code itself.

When a breakpoint is encountered, the current execution point is marked with a yellow arrow in the margin and the actual code is also highlighted in yellow. As discussed in the next chapter, this marker can be dragged forward and backward to control the order of execution. However, this should be done sparingly because it modifies the behavior of the application.
Chapter 48

Figure 48-1

DataTips

After hitting a breakpoint, the application is paused, or is in Break mode. In this mode, you can retrieve information about current variables simply by hovering your mouse over the variable name. Figure 48-1 shows that the value of the m_Name variable is currently Nothing. This debugging tooltip is commonly referred to as a DataTip, and can be used not only to view the data stored by a variable, but also to modify this information. In Chapter 50 you will learn how the layout of this DataTip can be customized using Type Proxies and Type Visualizers.

Breakpoint Window

When debugging a complex issue, it is possible to set numerous breakpoints to isolate the problem. Unfortunately, this has two side effects. One, the execution of the application is hampered, as you have to continually press F5 to resume execution. More significantly, the execution of the application is slowed considerably by the presence of breakpoints; the more complex the breakpoint conditions, the slower the application will run. Because these breakpoints can be scattered through multiple source files, it becomes difficult to locate and remove breakpoints that are no longer required.

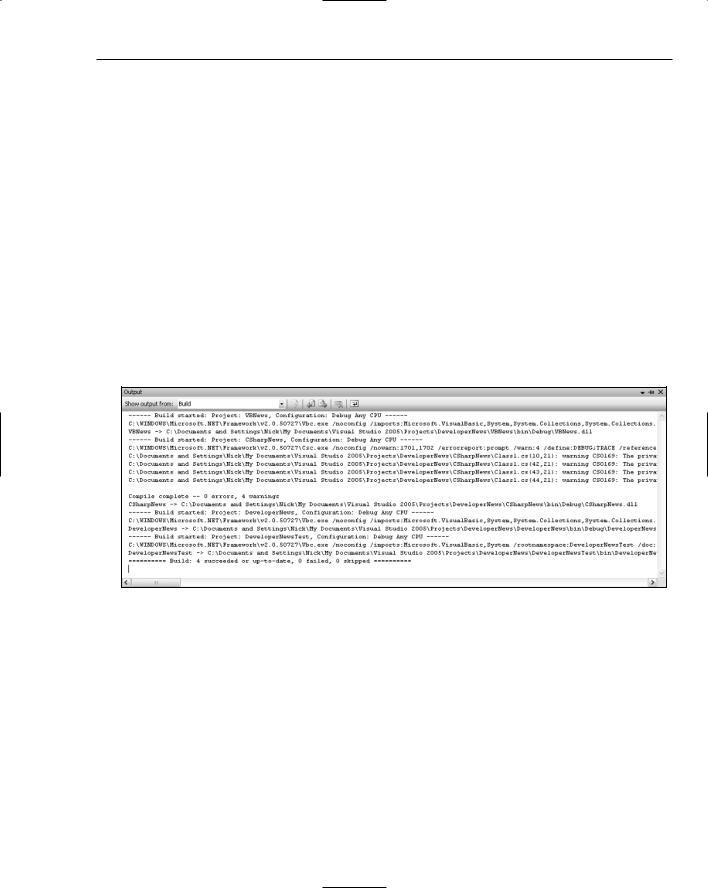
The breakpoint window, accessible via Debug Windows Breakpoints, is a useful summary of all the breakpoints currently set within the application. Using this window, breakpoints can easily be navigated to, disabled, and removed.

Figure 48-2

Figure 48-2 shows two currently active breakpoints in the Customer.vb file. The first is a regular breakpoint with no conditions. The second has a condition whereby the application will only break if the m_Name variable has the value Fred. This condition is also in bold, as the application is currently in Break mode at that breakpoint.

690

Using the Debugging Windows

The Breakpoints window, like most other debugging windows, is made up of two regions: the toolbar and the breakpoint list. From left to right, the breakpoint toolbar icons are as follows: create, delete, delete all, and disable all breakpoints, go to source and go to disassembler, and finally column selection.

Each item in the breakpoint list is represented by a checkbox that indicates whether the breakpoint is enabled, an icon and breakpoint descriptor, and any number of columns that show properties of the breakpoint. The columns can be adjusted using the Columns drop-down from the toolbar. You can set additional breakpoint properties by right-clicking on the appropriate breakpoint.

Output Window

One of the first debugging windows you will encounter when you run your application for the first time is the Output window. By default, this window appears when you build your application and show the build progress. Figure 48-3 shows the successful build of a sample solution. The final line of the Output window indicates a summary of the build, which in this case indicates four successfully built projects. Earlier in the output there was a summary of the errors encountered during the build. In this case there were no errors, but there were four warnings. Although the Output window can be useful if for some reason the build fails unexpectedly, most of the time the errors and warnings are reported in the Error List.

Figure 48-3

The Output window has a secondary role as the standard output while the application is running. The drop-down on the left of the toolbar can be used to toggle between output sources. Figure 48-3 shows the output of the build, but this can be changed to show the debug output. The debug output shows any messages that either the runtime or your code has emitted using Debug.Write or Debug.Writeline.

The other icons on the toolbar, in order from left to right, enable you to navigate to the source of a build message, go to the previous message, go to the next message, clear the window contents, and toggle word wrapping for the Output window.

691

Chapter 48

Immediate Window

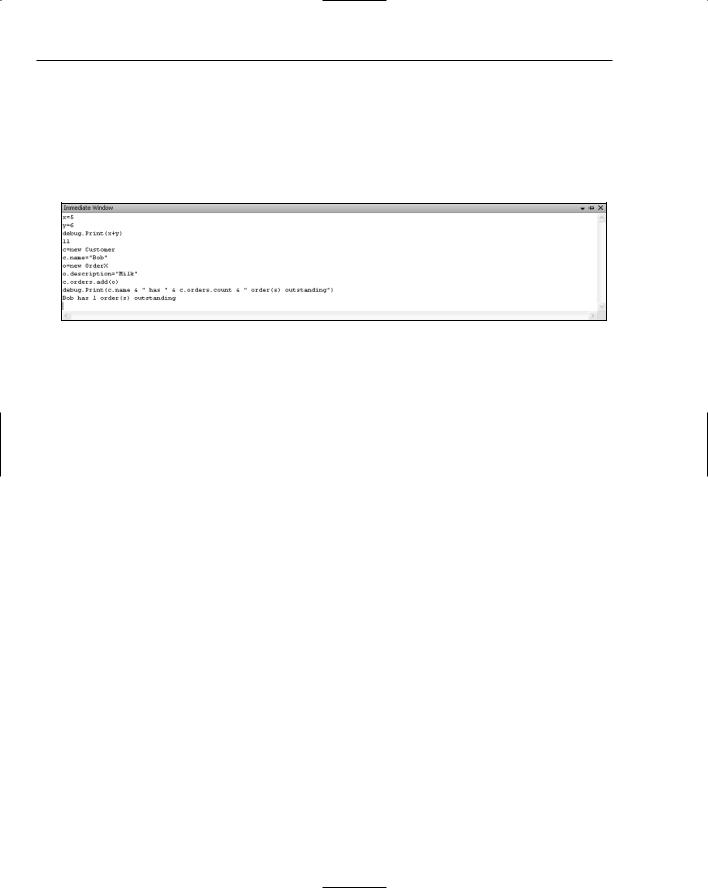
Quite often when you are writing code or debugging your application, you will want to evaluate a simple expression either to test a bit of functionality or to remind yourself of how something works. This is where the Immediate Window comes in handy. This window enables you to run expressions as you type them. Figure 48-4 shows a number of statements — from basic assignment and print operations through to more advanced object creation and manipulation.

Figure 48-4

Although you can’t do explicit variable declaration (for example, Dim x as Integer), it is done implicitly using the assignment operator. The example shown in Figure 48-4 shows a new Customer being created, assigned to a variable c, and then used in a series of operations.

The Immediate Window supports a limited form of IntelliSense, and you can use the arrow keys to track back through the history of previous commands executed. Variable values can be displayed using the

Debug.Print statement.

One of the significant improvements in Visual Studio 2005 is that the Immediate Window can now be used while you are writing code. Previously your application had to be in Break mode for the expressions to be evaluated. In fact, if you execute code that has an active breakpoint, the command will break at the breakpoint. This can be useful if you are working on a particular method that you want to test without running the entire application.

Script Explorer

The Script Explorer is designed to bridge the gap between the rich debugging experience of managed languages, such as C# and VB.NET, and other scripting languages such as VBScript and JavaScript. Most web sites would not be complete without at least some script providing some client-side functionality, rather than repeated postbacks to the server. The Script Explorer shows a list of current web pages that can be opened so that the scripts can be debugged.

Note, however, a gotcha that needs to be explained before going any further with the Script Explorer. By default, Internet Explorer disables script debugging because it is a potential security hazard. To work with the Script Explorer you must first uncheck the Disable Script Debugging (Internet Explorer) item on the Advanced tab of the Options dialog, accessible from the Tools menu within Internet Explorer.

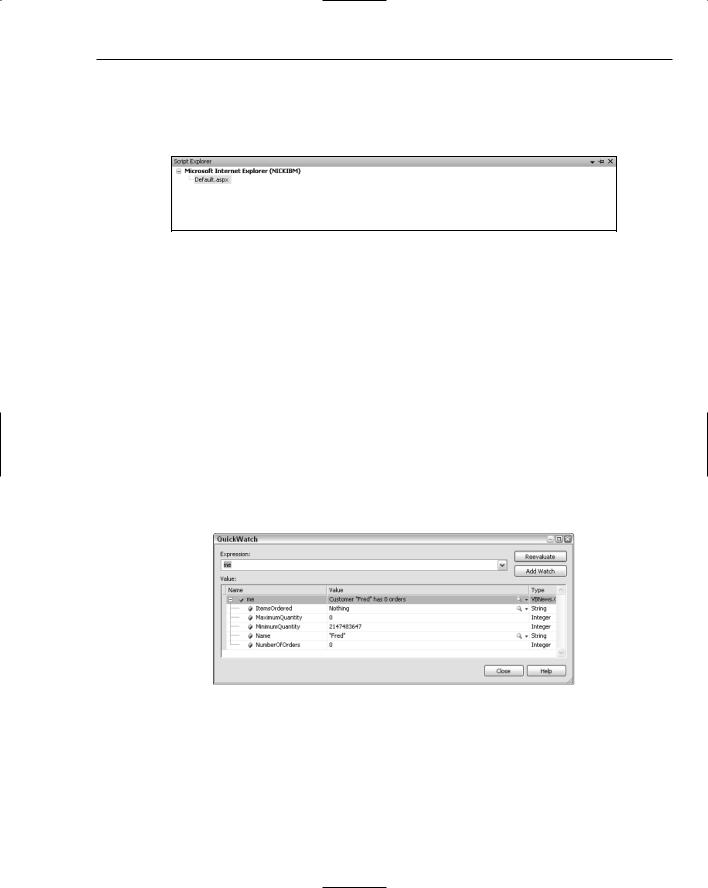
When you run your web application after enabling script debugging, notice that the current page being viewed appears in the Script Explorer (see Figure 48-5). Double-clicking on this item opens the page in

692

Using the Debugging Windows

the main code window. As with managed code, you can set breakpoints and move the current execution point around. Unlike managed code debugging, in which the debugging is carried out on the source code file, script debugging is done using a copy of the web page as it would appear if you selected View Source within Internet Explorer.

Figure 48-5

Watch Windows

Earlier in this chapter you saw how DataTips can be used in the code window to examine the content of a variable by hovering the mouse over a variable name. When the structure of the object is more complex it becomes difficult to navigate the values using just the DataTip. Visual Studio 2005 has a series of watch windows that can be used to display variables, providing an easy-to-use interface for drilling down into the structure.

QuickWatch

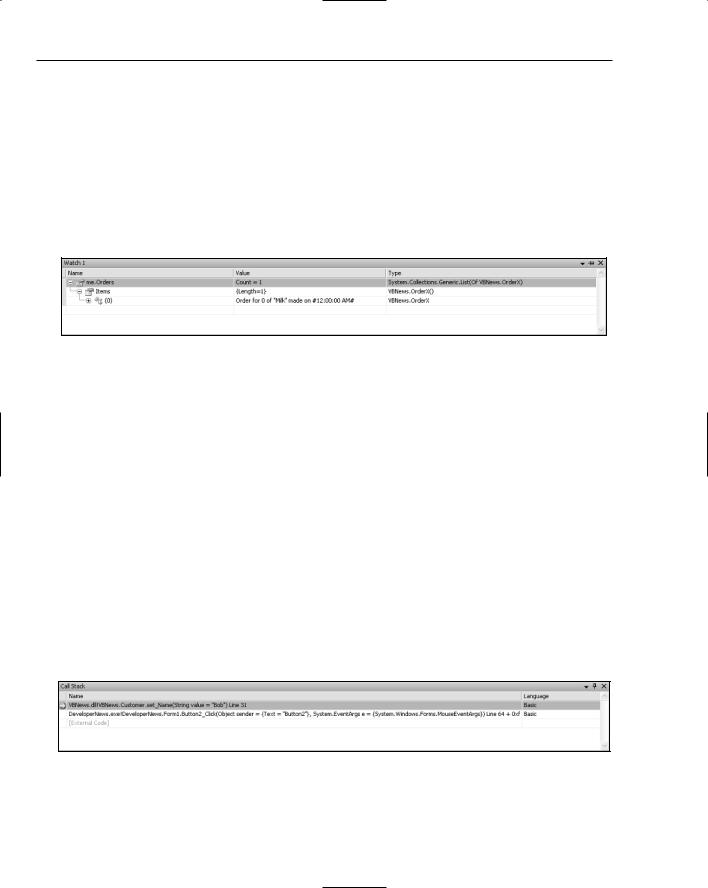
The QuickWatch window is a modal dialog that can be launched by right-clicking on the code window. Whatever you have selected in the code window is inserted into the Expression field of the dialog, as shown in Figure 48-6 where a Customer object is visible. Previous expressions you have evaluated appear in the drop-down associated with the Expression field.

Figure 48-6

The layout of the Value tree in the QuickWatch window is similar to the DataTip, without the annoyance of it disappearing. Each row shows the variable name, the current value, and the type of object. The value of the variable can be adjusted by typing in the Value column.

Use the Add Watch button to add the current expression to one of the watch windows. These are variables to be continuously watched.

693

Chapter 48

Watch Windows 1–4

Unlike the QuickWatch window, which is modal and shows a variable value at a particular execution point, the watch windows can be used to monitor a variable value as you step through your code. Although there are four watch windows, a single window is sufficient in most cases. Having four separate windows means that you can have different sets of variables in the different windows, which might be useful if you are working through a more complex issue that involves multiple classes.

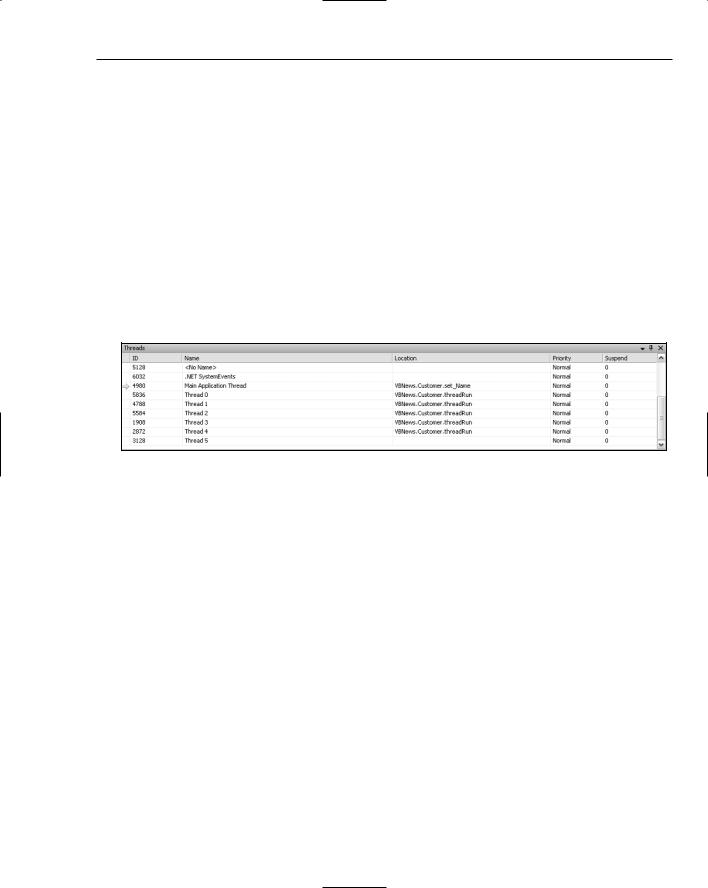
Figure 48-7 shows the Orders property of the current Customer object. Similar to both the QuickWatch window and the DataTips discussed previously, the user interface can be used to drill down into more complex data types.

Figure 48-7

Additional variables to be watched can be added either by typing into the Name column on an empty line or by right-clicking the variable in the code window and selecting Add Watch from the context menu.

Autos and Locals

The Autos and Locals windows are two special watch windows in which the variables are automatically added by the debugger. The Autos window contains variables that are used in the current, preceding, and future lines of code. Similarly, the Locals window shows all variables used in the current method. Other than being automatically generated, these windows behave the same as the watch windows.

Call Stack

As applications grow in complexity, it is quite common for the execution path to become difficult to follow. The use of deep inheritance trees and interfaces can often obscure the execution path. This is where the call stack is useful. Each path of execution must have a finite number of entries on the stack (unless a cyclic pattern emerges, in which case a stack overflow is inevitable). The stack can be viewed using the Call Stack window, shown in Figure 48-8.

Figure 48-8

Using the Call Stack window, it is easy to navigate up the execution path to determine from where the current executing method is being called. This can be done by clicking on any of the rows in the call stack, known as a stack frame. Other options available from the call stack, using the right-click context

694

Using the Debugging Windows

menu, enable viewing the disassembler for a particular stack frame, setting breakpoints, and varying what information is displayed. In Figure 48-8 the Show External Code option has been unchecked so that only code that you have written is visible.

Threads

Most applications make use of multiple threads at some point. In particular for Windows applications, in order for the user interface to always appear responsive, it is important to run time-consuming tasks on a separate thread from the main application. Of course, concurrent execution of threads makes debugging more difficult, especially when the threads are accessing the same classes and methods.

Figure 48-9 shows the Threads window, which lists all the active threads for a particular application. Notice that in addition to the threads created in the code, there are additional background threads created by the debugger. For simplicity, the threads used by this application, including the main user interface thread, have been given a name so they can easily be distinguished.

Figure 48-9

The Threads window shows a yellow arrow next to the thread that is currently being viewed in the code window. To navigate to another thread, simply double-click on that thread to bring the current location of that thread into view in the code window and update the call stack to reflect the new thread.

In Break mode, all threads of an application are paused. However, when you are stepping through your code with the debugger, the next statement to be executed may or may not be on the same thread you are interested in. If you are only interested in the execution path of a single thread, and the execution of other threads can be suspended, right-click the thread in the Threads window and select Freeze from the context menu. To resume the suspended thread, select Thaw from the same menu.

Modules

The Modules window (see Figure 48-10) shows a list of assemblies that are referenced by the running application. Those assemblies that make up the application will also have debugging symbols loaded, which means that they can be debugged without dropping into the disassembler. This window also provides useful assembly version information and indicates whether the assembly is optimized.

In Figure 48-10 the symbols have been loaded for the DeveloperNews application as well as the VBNews assembly. All the other assemblies have been skipped, as they contain no user code and are optimized. If an appropriate symbol file is available, it is possible to load it for an assembly via the Load Symbols option from the right-click context menu.

695