

Yang Fluidization, Solids Handling, and Processing
.pdfBubbleless Fluidization |
525 |
5.1Longitudinal Voidage Distribution
Characteristically in fast fluidization, there always exists a denser region at the bottom, much more extended than would be accounted for by a one-dimensional analysis based on accelerative motion for particulate fluidization. Figure 22 (Li and Kwauk, 1980) gives four sets of representative voidage distribution curves along the bed height, taken in an i.d.-90 x h- 8,000 mm experimental column shown schematically in Fig. 21 (Wang, Li Zheng and Kwauk, 1985).

526 Fluidization, Solids Handling, and Processing
Figure 22. Vertical voidage distribution in fast fluidization. (Li and Kwauk, 1980.)
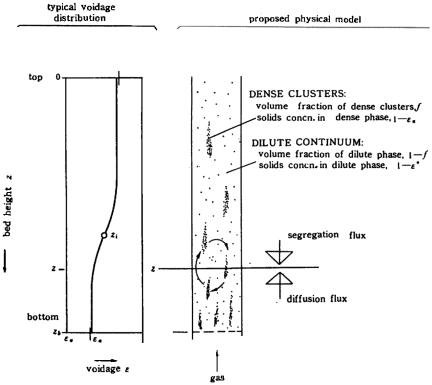
These characteristic voidage distribution curves, combined with the strand-cluster structure noted above for the solids bed, led to the physical model of Fig. 23 (Li and Kwauk, 1980). At any height, for instance z as shown in Fig. 23, the clusters are supposed to move upward through a diffusive mechanism from a region of relatively high population at the lower section, and then, when they arrive at a region above z where the average bed density is lower, they tend to fall back to the lower region of their origin by virtue of buoyancy. Dynamic equilibrium calls for equality of the diffusion and buoyancy fluxes, thus leading to a rather compact voidage distribution relation
ln[(ε - ε a)/(ε * - ε a)] = - (z - zi)/Zo
where Zo has the dimension of length and will be called the characteristic length. This equation yields an S-shaped ε -versus-z curve, approaching an asymptotic value of ε * at the top as z → -∞, and ε a at the bottom as z → ∞. The value of Zo governs the rapidity with which the dense region at the


Bubbleless Fluidization |
529 |
5.2Regimes for Vertical G/S Systems
The voidage distribution model permits the derivation of analytical expressions for the integrated average voidage taken through the whole height, defined as
ε = (1/ z )òOzε dz
Thus, for the entire bed
ε |
- ε |
a |
|
1 |
|
é |
1 + exp(z |
i |
/ Z |
O |
) ù |
||
|
|
= |
|
|
ln ê |
|
|
|
ú |
||||
|
|
|
|
|
|
-z )Z |
|
||||||
ε - ε |
a |
z / Z |
O |
ê1 + exp(z |
ú |
||||||||
|
|
|
|
ë |
i |
|
|
|
O û |
||||
for the dilute phase (phase B) above the point of inflection zi
ε |
B |
-ε |
a |
= |
1 |
|
é1 + exp(z |
i |
/ Z |
O |
)ù |
||
|
|
|
|
ln ê |
|
|
|
ú |
|||||
ε -ε |
|
z / Z |
|
2 |
|
|
|
|
|||||
a |
O |
ë |
|
|
|
û |
|||||||
|
|
|
1 |
|
|
|
|
|
|
|
|||
for the dense phase (phase A) below the point of inflection zi
ε A-ε a |
|
1 |
é |
2 |
|
ù |
|||||
= |
|
ln ê |
|
|
ú |
||||||
|
(z -z )/ Z |
|
|
-z )/ Z |
|
||||||
ε |
|
-ε |
a |
|
ê1 + exp(z |
ú |
|||||
|
|
i |
O ë |
i |
|
O û |
|||||
The A- and B-phases are shown plotted in Fig. 25 (Chen and Kwauk, 1985), whenever an inflection point exists, for FCC catalyst, Al2O3 and iron ore.
For a fine powder having good fluidizing characteristics and conforming to the requirements for Group A according to Geldart’s classification, fluidization traverses the following regimes in succession as gas velocity increases, as demonstrated in Fig. 25:
BUBBLING — TURBULENT — FAST — TRANSPORT
As the fluidizing quality of the powder deteriorates from Group A to Group B, however, the range for fast fluidization dwindles, until, for sandy materials, TURBULENT often jumps to TRANSPORT without the intermediate FAST stage. This is shown in Fig. 25 for a titanomagnetite concentrate, which is heavy and comparatively coarse.


Bubbleless Fluidization |
533 |
5.3Radial Voidage Distribution
All the preceding sections were concerned with one-dimensional voidage distribution in the vertical direction. However, maldistribution of solids in the radial direction, generally dilute in the center and dense next to the wall, often causes unfavorable residence time distributions for both the solids and the fluidizing gas, thus resulting in undesirable product distribution. Although it has long been known that in vertical flow of G/S systems solids are preferentially scattered toward the wall, accurate measurement has not been easy.
Optical fiber measurement of local solids concentrations of FCC catalyst fluidized in a 9-cm-i.d. column gave the results shown typically in Fig. 26. Analysis of these data showed that the radial voidage profile could be described solely by the cross-section-average voidage ε¯, calculated as shown in Sec. 5.1, and the reduced radial coordinate r/R:
r/R < 0.75 ε = ε¯ (r/R)/2 + 0.191
r/R < 0.75 ε = ε¯ 3.62(r/R)6.47 + 0.191
These two equations thus demarcate the radial voidage profile at a radial position of r/R = 0.75 into an annular region of steep voidage distribution and a core region of flat distribution. Figure 27 (Tung, Li, Zhang and Kwauk, 1987; Tung, Li and Kwauk, 1988) shows curves computed by using these two equations, which seem to check closely experimental data.
Thus, the three-dimensional voidage distribution in a fast fluidized bed can be determined, semi-empirically as our understanding stands at the present, from the physical properties of the solids and the gas and the operating variables.
From a practical point of view, for improved solids distribution, the indications are for innovative design of obstructing structures next to the wall to break the falling sheet of solids in order to equalize their flow pattern across the column through repeated redistribution.
5.4Modeling Fast Fluid-bed Reactors
The three-dimensional voidage distribution provides the basic correlation for building a reactor model for fast fluidization, given data on particle-fluid transfer coefficients and intrinsic particle reaction kinetics.
