Attrition in Fluidized Beds and Pneumatic Conveying Lines 465
0.10E-6
0.08E-6
0.07E-6
0.05E-6
0.03E-6
0.02E-6
0.00E-6
0.0 |
0.1 |
0.2 |
0.3 |
0.4 |
0.5 |
0.6 |
|
|
|
(U g-U g,mf), m/s |
|
|
Figure 11. Variation of the steady-state attrition rate of coal ash (0.2 to 0.315 mm) with (Ug - Ug,mf ). (Pis et al., 1991.)
|
0.15E-6 |
|
|
|
|
|
|
|
|
|
0.12E-6 |
|
dp=1090 µm |
|
|
|
|
|
|
|
d =770 µm |
|
|
|
|
|
|
|
|
|
|
|
|
|
rate, kg/s |
|
|
p |
|
|
|
|
|
|
0.10E-6 |
|
|
|
|
|
|
|
|
0.07E-6 |
|
|
|
|
|
|
|
|
attrition |
0.05E-6 |
|
|
|
|
|
|
|
|
|
|
|
|
|
|
|
|
|
|
0.02E-6 |
|
|
|
|
|
|
|
|
|
0.00E-6 |
|
|
|
|
|
|
|
|
|
0.3 |
0.4 |
0.5 |
0.6 |
0.7 |
0.8 |
0.9 |
1.0 |
1.1 |
|
|
|
|
(Ug -Ug,mf), m/s |
|
|
|
Figure 12. Variation of the steady-state attrition rate of limestone fractions with (Ug - Ug,mf ). (Ray et al., 1987a.)
466 Fluidization, Solids Handling, and Processing
9.00E-6
7.50E-6
6.00E-6
4.50E-6
3.00E-6
1.50E-6
0.00E-6
0.0 0.2 0.4 0.6 0.8 1.0
U , m/s
g
Figure 13. Variation of the steady-state attrition rate of a catalyst with superficial gas velocity (AVN 802, Ug,mf = 0.002 m/s. (Xi, 1993.)
Bed Height. The effect of the bed height or bed weight on the bubbleinduced attrition rate Ra,bub is not quite clear. Merrick and Highley (1974)
and Pis et al. (1991) have found Ra,bub to be independent of bed height in accordance with Eq. (15). Kono (1981) found the attrition rate to be proportional to the static bed height with the exponent 0.78, Ra,bub H stat0.78 .
Furthermore, Ulerich et al. (1980) and Xi (1993) found Ra,bub to be proportional to the bed height. As an example Fig. 14 shows Xi’s results.
Obviously the role of bed height is not yet fully understood. Ray et al. (1987a) have explained these discrepancies by a consideration of bubble growth with height above the distributor. They argue that as long as the bubble size increases with height, the efficiency of the transformation of kinetic energy to free surface energy might increase thus leading to a bubbleinduced attrition rate that increases with bed height. However, as the bed height reaches the limits of slugging in small diameter columns or maximum attainable bubble in a large diameter bed, an extra bed height will not vary the conditions of bubbling and thus will result in Ra,bub becoming independent of bed height. However, further experiments are certainly needed in this area.
Attrition in Fluidized Beds and Pneumatic Conveying Lines 467
3.50E-6
3.00E-6
2.50E-6
2.00E-6
1.50E-6
1.00E-6
0.50E-6
0.00E-6
0.0 |
0.1 |
0.2 |
0.3 |
0.4 |
|
|
bed mass, kg |
|
|
Figure 14. Variation of the steady-state attrition rate of a catalyst with bed height. (Xi, 1993.)
Internals. Commercial fluidized beds are often equipped with internals, e.g., baffle plates and heat exchanger tubes. Due to their interaction with the rising bubbles they will certainly cause particle attrition. Unfortunately, no systematic investigations are available in the open literature which could serve as practical guidelines.
Cyclones as Attrition Sources. Attrition in cyclones is a difficult field. The number of publications available in the open literature is very small. This may be due to the fact that experiences with the performance of cyclones are often considered proprietary. However, this lack of information can also be explained by strong experimental difficulties which mainly originate from the problem of making a distinction between the collection efficiency and attrition. The cyclone is a separator which is usually designed to keep as much material as possible inside the fluidized bed system. The material which cannot be kept inside the system, i.e., the loss or elutriation, is usually defined as attrition. But in fact, the elutriation rate originates from both sifted original fines entering the cyclone (i.e., from the original feed particle size distribution or produced by attrition in other parts of the fluidized bed system) and fines that are actually produced by attrition in the cyclone. Unfortunately, the attrition rates in other parts of the system and, therefore, their contribution to the elutriation rate is usually unknown.

468 Fluidization, Solids Handling, and Processing
Consequently, it is very difficult to evaluate the cyclone attrition rate from the measured elutriation rate. In order to study the cyclone attrition mechanism in detail it is necessary to study the cyclone in isolation. This can be achieved by feeding a cyclone batch-wise and directly without any additional equipment that could contribute to attrition.
Moreover, not all attrition products will be directly elutriated from the cyclone. Instead, a part will be collected by strands of the material and will be transported via the solids return line into the fluidized bed process. In subsequent passes through the cyclone, the accumulated attrition-produced fines will be elutriated due to the sifting effect of the cyclone.
For the special case of an isolated cyclone, which is fed with a mass
flux mc,in of material sufficiently large to be sent into the catch of the cyclone, the measured mass flux in the loss of the cyclone, mc,loss is solely due to attrition inside the cyclone. In such a case the cyclone attrition rate
Ra,c may be defined by
|
Eq. (17) |
Ra , c = |
mc ,loss |
|
mc ,in |
|
|
|
Modeling of Cyclone Attrition. A very simple model of cyclone attrition may be formulated in analogy to the models discussed with respect to jet attrition and bubble-induced attrition (Reppenhagen and Werther, 1997).
In the spiral or tangential cyclone inlet duct, the particles are accelerated to a velocity which is related to the inlet gas velocity Ue. Neglecting as a first approximation the slip between solids and gas, the kinetic energy of the solids which is transported per unit time into the cyclone is approximately given by
1 2 ×mc,in ×U e2
The fraction η of this kinetic energy is used to create free surface energy via abrasion,
Eq. (18) |
η ×1 2 × m c,in ×U e2 = mc ,loss × S m ×γ |
where Sm is the mass specific surface area generated by abrasion and γ(J/m2) is the specific free surface energy of the solid material. Since abrasion produces very fine particles with a size distribution that is fairly
Attrition in Fluidized Beds and Pneumatic Conveying Lines 469
independent of the operating conditions, Sm may be assumed to be constant for a given material. Rearrangement of Eq. (18) yields
|
Eq. (19) |
Ra,c = |
1 |
×η ×Ue2 |
|
2 ×γ × Sm |
|
|
|
|
According to Eq. (19) the cyclone attrition will be proportional to the square of the gas inlet velocity. The production rate of attrited fines, which is identical here to the mass flux in the cyclone loss, is then given by
|
Eq. (20) |
mc,loss = |
1 |
×η ×U e2 × mc ,in |
|
2 ×γ × Sm |
|
|
|
|
Experimental Results. Zenz (1974) and Zenz and Kelleher (1980) considered attrition of FCC catalysts in isolated cyclones. They used different cyclones (4” to 30” ID). A suction fan was attached to the cyclone outlet. A given batch of solids was sucked through the cyclone. Afterwards the overhead and the bottom were mixed and once again sucked through the cyclone. After twenty passes through the cyclone they observed significant changes in the particle size distribution. An example is given in Fig. 15. Particles in the 70 to 100 micron size range are seen to have decreased in concentration, whereas particles in the 30 to 70 micron size range increased in number and smaller particles showed no significant change. From many experiments of this kind, Zenz and Kelleher (1980) derived design correlations for the estimation of cyclone attrition for fluidized bed systems. Unfortunately the details of these estimations remained proprietary.
More recently, Reppenhagen and Werther (1997) have conducted a comprehensive study of the attrition mechanism in a cyclone. Their experimental set-up is shown in Fig. 16. The 0.09 m ID cyclone is operated in the suction mode. The solids (spent FCC, surface mean diameter 105 microns) are introduced via a vibrating feeder into the cyclone inlet tube which allows an independent variation of cyclone inlet velocity Ue and solids loading μ,
|
Eq. (21) |
μ = |
|
mc,in |
|
Ue |
× ρg × Ac,e |
|
|
|
|
|
where Ac,e is the cyclone inlet cross-sectional area. After a test run, the catch of the cyclone is used as a starting material for the next run, i.e., catch and

470 Fluidization, Solids Handling, and Processing
loss are not mixed again. Figure 17 gives an example of the results. The cyclone loss rate per single pass is plotted against the number of passes for given operating conditions (Ue, μ). In analogy to Fig. 2, a large initial cyclone loss rate is observed which rapidly decreases, and after 10 to 20 passes, reaches a steady-state value. The high value of the loss rate during the first couple of passes is due to the added effects of attrition and sifting, whereas the steady-state value is identical to the true cyclone attrition rate Ra,c. After thirty-four passes, the operating conditions were changed to a higher inlet velocity which, due to a constant solids feeding rate, was combined with a corresponding reduction in the solids loading. The measurements show a slow increase of the cyclone loss rate which, after another fifteen passes, leads to a steady state again. This slow transition is caused by the fact that part of the fines generated by attrition are sent into the catch of the cyclone.
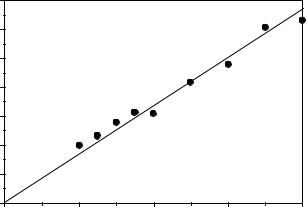
According to the model described above the cyclone attrition rates Ra,c obtained under steady-state conditions have been plotted against the square of the cyclone inlet velocity in Fig 18. Although the number of experiments is not large the general relationship between Ra,c and Ue predicted by Eq. (19) is confirmed.
40
30
20
10
0
-10
-20
0 |
10 |
20 |
30 |
40 |
50 |
60 |
70 |
80 |
90 |
100 110 120 |
d , µm
p
Figure 15. Changes in the size distribution of FCC catalyst due to attrition in a 5" cyclone, (inlet velocity 35ft/s). (Zenz and Kelleher, 1980.)
Attrition in Fluidized Beds and Pneumatic Conveying Lines 471
Figure 16. Experimental set-up for the isolated investigation of cyclone attrition (cyclone ID = 0.09 m). (By Reppenhagen and Werther, 1997.)
|
|
600E |
-6 |
|
|
|
|
|
|
pass |
|
500E |
-6 |
U =14.5 m/s |
|
|
U =20 m/s |
|
|
|
|
e |
|
|
|
e |
|
|
|
|
|
|
|
|
|
loss rate per single |
|
400E |
-6 |
µ=0.2 |
|
|
|
µ=0.13 |
|
|
|
|
|
|
|
|
[kg/(kg•pass)] |
300E |
-6 |
|
|
|
|
|
|
200E |
-6 |
|
|
|
|
|
|
|
|
|
|
|
|
|
|
Cyclone |
|
100E |
-6 |
|
|
|
|
|
|
|
0E |
-6 |
|
|
|
|
|
|
|
|
|
|
|
|
|
|
|
|
|
0 |
10 |
20 |
30 |
40 |
50 |
60 |
|
|
|
|
Number of passes through the cyclone |
|
Figure 17. Cyclone loss rate of spent FCC catalyst as a function of the number of passes through the cyclone. (Reppenhagen and Werther, 1997.)
472 Fluidization, Solids Handling, and Processing
350E |
-6 |
|
300E |
-6 |
|
250E |
-6 |
µ=0.06 |
|
200E |
-6 |
µ=0.13 |
|
|
150E |
-6 |
|
|
|
µ=0.2 |
100E |
-6 |
|
50E |
-6 |
|
0E |
-6 |
|
0 |
100 |
200 |
300 |
400 |
500 |
|
|
U |
2 |
, m2 /s2 |
|
|
|
|
|
e |
|
|
|
Figure 18. Influence of inlet velocity Ue and solids loading µ on the steady-state cyclone attrition rate. (Reppenhagen and Werther, 1997.)
As is seen from this latter figure, an increase of the solids loading results in a decrease in the cyclone attrition rate. This may be due to a “cushioning” effect of the increased solids concentration which is well known in comminution processes. This cushioning effect may be interpreted as a decrease in the efficiency η of the abrasion process. If we assume η to be a function of μ and in its simplest form to follow an exponential function,
Eq. (22) |
η μ n |
|
|
|
it follows from Eq. (19) |
|
|
|
Eq. (23) |
R |
= K |
c |
×U 2 |
× μ n |
|
a,c |
|
e |
|
All measurements have been plotted in Fig. 19 as ( Ra,c / U e2 ) against the solids loading on a double logarithmic grid. The measurements are seen to be well described by Eq. (23) with n = -0.5. It should be noted here that the range of μ and Ue which has been investigated is not large enough to permit very general conclusions to be drawn. More investigations are certainly needed in this area.
Attrition in Fluidized Beds and Pneumatic Conveying Lines 473
|
1E-6 |
|
|
|
|
2 |
(R |
/U |
2) µ-0.5 |
|
2, s2/m |
|
|
a,c |
e |
|
|
|
|
|
0.5E-6 |
|
|
|
|
e |
|
|
|
|
/U |
|
|
|
|
a,c |
|
|
|
|
R |
|
|
|
|
Ue |
=11 m/s |
|
|
|
Ue =14,5 m/s |
|
|
|
U =20 m/s |
|
|
|
e |
|
|
|
|
0.2E-6 |
0.1 |
|
|
|
0.05 |
|
0.5 |
|
|
|
µ, - |
|
Figure 19. Influence of the solids loading µ on cyclone attrition. (Reppenhagen and Werther, 1997.)
However, the present results already allow a conclusion to be drawn
with respect to the solids mass flux mc,loss which is lost from the cyclone as a result of attrition inside the cyclone. From Eq. (23) it follows with n = -0.5
and with the definition of Ra,c
Eq. (24) |
mc ,loss |
= K c × mc ,in × |
U e2 |
|
|
|
μ 0.5 |
|
|
|
|
|
|
|
|
|
Eq. (25) |
m |
c,loss |
= K |
c |
× ρ 0.5 |
× A0.5 |
× m0.5 |
×U 2.5 |
|
|
|
g |
|
c ,e |
|
c ,in |
e |
The cyclone inlet velocity is thus shown to be the most significant factor influencing the solids loss due to attrition in the cyclone.
5.2Attrition in the Overall Fluidized Bed System, Continuous Processes
As has been demonstrated above, there are several parts of the fluidized bed system with distinctly different attrition mechanisms. They all
474 Fluidization, Solids Handling, and Processing
contribute to the overall attrition rate in the fluidized bed system, Ra,tot, which is measured in the form of the cyclone loss rate by the bed mass,
|
Eq. (26) |
Ra ,tot = |
mc ,loss |
|
Wbed |
|
|
|
Considering the different parameter dependencies, e.g., with respect to the fluidizing velocity Ug
Eq. (27) |
in the distributor region: R |
U 3 |
|
a ,distr |
g |
Eq. (28) |
in the bubbling fluidized bed: Ra ,bub (U g − U g ,min ) |
Eq. (29) |
in the cyclone: Ra, c U g2 |
|
it is not surprising that experimental results from different investigations are varying widely if only overall attrition rates are compared.
Up to now attrition has been considered in batch processes only. However, most industrial fluidized bed processes are operated in a continuous mode. This means with respect to attrition in catalytic processes, that the cyclone loss is compensated for by the addition of fresh make-up catalyst. Consequently, there is an age distribution of the solids and the time dependence of attrition has to be taken into account. According to Sec. 2 there will be both high initial attrition of freshly fed material and steady state attrition of “old” particles. Zenz (1971, 1972, 1980) was among the first to suggest calculation procedures for the content of fines which is attained at equilibrium as a result of attrition and addition of new catalyst in a fluidized bed system. Levenspiel et al. (1968) and Kunii and Levenspiel (1969) suggested the consideration of particle balances in the system. Newby et al. (1983) proposed a simple mass balance for the entire system and distinguished between continuous and instantaneous attrition which was connected to the feed rate. Vaux and Schruben (1983, 1985) extrapolated their time-dependent bubble attrition model to a continuous process. Fuertes et al. (1991) coupled a description of time dependence derived from batch processes with the residence time distribution function of a continuous stirred tank reactor. More recently, Ray et al. (1987b) and Werner et al. (1995) presented population balance models to describe process attrition. In