

Wypych Handbook of Solvents
.pdf15.2.3 An innovative GC method |
1121 |
Ibuprofen crystals observed under SEM are in total disorder (Figure 15.2.3.8). This disordered arrangement of microcrystallites inside the polycrystalline particles gives them a high isotropy of particles arrangement that should improve their compression capacity.
Residual solvent determination
For organic solvents, gas phase chromatography was performed on a Shimadzu GC-14B chromatograph fitted with a Flame Ionization Detector and a CR-6A Shimadzu integrator.
The packed column was Porapack super Q (Alltech, France), mesh range 80/100, length 1.80 m, internal diameter 2.16 mm. Carrier gas: anhydrous nitrogen. Injector temperature: 200°C. Detector temperature: 220°C. The chromatographic conditions were:
•For chloroform in meprobamate crystals: isotherm at 150°C, injection: 5 l, RT: methanol 0.8 min, chloroform 6.7 min.
•For ethanol in ibuprofen crystals: isotherm at 170°C, injection: 5 l, RT:
ethanol 1.1 min, 1-butanol 5.3 min.
Determination of residual water was carried out using Karl Fischer’s titrimetric direct method after calibration with natrium tartrate and dissolution of ibuprofen or meprobamate crystals in methanol.
The residual solvent concentrations of the polycrystalline particles are reported in Tables 15.2.3.6 and 15.2.3.7.
Table 15.2.3.6. Residual solvent concentration of meprobamate spherical crystals submitted to different drying conditions (Data from reference3)
|
Chloroform |
Water |
|
|
|
Progressive drying* |
345±22 ppm |
0.71%±0.07% |
|
|
|
Drastic drying** |
321±8 ppm |
0.21%±0.01% |
|
|
|
*30 min at 60°C + 30 min at 75°C + 1 hour at 90°C; **2 hours at 90°C
Table 15.2.3.7. Residual solvent concentration of ibuprofen agglomerates submitted to different drying conditions (Data from reference3)
|
Ethanol |
Water |
|
|
|
2 hours at 40°C |
42±3 ppm |
0.76%±0.12% |
|
|
|
2 hours at 60°C |
21±4 ppm |
0.44%±0.06% |
|
|
|
As far as meprobamate spherical crystals are concerned, no significant differences are to be observed between drastic and progressive drying. No crusting phenomenon appears on meprobamate spherical crystals due to the loose tangling up of crystals, and so the solvent may escape easily between them.
The residual ethanol content of ibuprofen agglomerates is very low because of the open texture of agglomerates. Moreover, the crystallization phenomenon was relatively slow, enabling the solvent to escape from crystals in formation. The higher the temperature, the lower the residual ethanol content.
Both these crystals have a very porous texture. It seems that progressive drying is not essential as far as the polycrystalline particles are concerned.
If we consider the official limits1,6 reported on Table 15.2.3.5 for residual solvent contents, we can note that the concentration of chloroform in meprobamate spherical crystals is much higher than the limit allowed in any drying conditions. Due to its inherent toxicity, this solvent should be avoided in the recrystallization process of meprobamate. The solvent
1122 |
Christine Barthélémy, Michel Bauer |
content obtained for ethanol in ibuprofen agglomerates is very low, in all drying conditions; in all cases it is considerably lower than the tolerated limits.
15.2.3.2.3 Third example: polycrystalline particles of paracetamol
Preparation of polycrystalline particles
Paracetamol agglomerates were prepared by the spontaneous precipitation of paracetamol into a mixture containing hexane, tetrahydrofuran and dichloromethane9 under stirring. All the crystals obtained were filtered under vacuum.
Particle drying conditions
The melting point of paracetamol being 169°C and the transition temperature being 156°C, different drying conditions were tested (Table 15.2.3.2):
•Drastic flash drying: 156°C for either 10 or 30 minutes,
•Drastic drying: 100°C for 2 hours,
•Progressive drying: 60°C for 30 minutes, then 80°C for 30 minutes, and finally,
100°C for 1 hour.
After drastic drying at 100°C and progressive drying, a test with complementary drying at 156°C was carried out for 10 minutes.
All the recovered crystals were packaged in glass flasks before gas phase chromatography and other analysis.
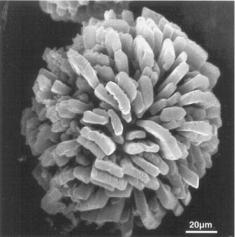
Morphological aspect of particles Several types of texture and morphology are to be observed in polycrystalline particles, according to solvent proportions. The most interesting and particular example are spherical polycrystalline particles which have a radial texture (spherolites) and appear as urchin-like particles (Table 15.2.3.3). SEM reveals the very typical surface crystallization of the agglomerates (Figure 15.2.3.9). They are made up of parallelepipedal flat crystals arranged perpendicularly to a central nucleus and they are relatively strong.
The implantation of peripherical crystallites is perpendicular to the surface. As it has been clearly demonstrated by Ettabia10 a nucleus is formed first and then, in a second step, microcrystallites grow on it.
Residual solvent determination
For organic solvents, gas phase chromatography was performed on a Shimadzu GC-14B chromatograph fitted with a Flame Ionization Detector and a CR-6A Shimadzu integrator.
The packed column was Porapack super Q (Alltech, France), mesh range 80/100, length 1.80 m, internal diameter 2.16 mm. Carrier gas: anhydrous nitrogen. Injector temperature: 200°C. Detector temperature: 220°C. The chromatographic conditions were: For dichloromethane, tetrahydrofuran and hexane in paracetamol crystals: isotherm at 150°C, injection: 5 l, RT: methanol 0.8 min, dichloromethane 3 min, tetrahydrofuran 7.8 min, hexane 11.8 min.
1123
The residual solvent concentrations of the polycrystalline particles are reported in Table 15.2.3.8.
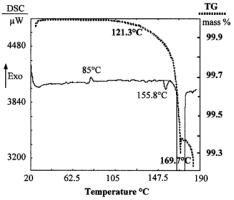
The wide-open texture of paracetamol spherolites hinders the crusting phenomenon; it is therefore normal that there should be no difference between the effectiveness of the two types of drying: progressive and drastic (at 100°C for two hours). However, a surprisingly good result is observed when the drying temperature is 156°C whereas a prolonged time at 100°C does not improve the solvent escape in spite of the low boiling points of solvents, all much lower than 100°C (dichloromethane: 39.5°C; tetrahydrofuran: 66°C; hexane: 69°C). Using a DSC method, it can be observed that a slight non constant exotherm at 85°C fol-
lowed by a small constant endotherm at nearly 156°C occurs before the melting endotherm at 169°C (Figure 15.2.3.10). In fact, the paracetamol obtained by the crystallization process described is mainly the usual monoclinic form. However, as has been demonstrated by Ettabia10 the formation of a certain amount of the amorphous form, causes the slight exotherm. The amorphous form recrystallized at 85°C into the orthorhombic metastable form, which transits into monoclinic form at 156°C, causing the small endotherm observed at nearly 156°C.
The thermogravimetric analysis shows that no solvation occurs during crystallization. Furthermore, the sudden solvent escape is not specific to one definite solvent, whereas all the contained solvent amounts dramatically decrease at 156°C. The loss of mass is high (about 0.7%) when the substance is about to melt (Figure 15.2.3.10).
Table 15.2.3.8. Residual solvent concentration of paracetamol agglomerates submitted to different drying conditions (Data from reference3)
|
Dichloromethane |
Tetrahydrofuran |
Hexane |
"Flash drying" 156°C |
|
|
|
for 10 min |
< 200 ppm |
1095±5 ppm |
167±1 ppm |
for 30 min |
< 200 ppm |
630±24 ppm |
88±4 ppm |
PD* |
315±3 ppm |
2066±1 ppm |
305±3 ppm |
PD*+ “flash” (10 min at 156°C) |
< 200 ppm |
883±10 ppm |
145±5 ppm |
DD ** |
309±3 ppm |
2014±30 ppm |
313±4 ppm |
DD**+"flash" (10 min at 156°C) |
< 200 ppm |
873±2 ppm |
140±1 ppm |
*PD: Progressive drying (30 min at 60°C + 30 min at 80°C + 1 h at 100°C), **DD: Drastic drying (2 h at 100°C)
Paracetamol, containing three different solvents, exhibits low dichloromethane content (200 to 320 ppm). The referencing limits remain higher than the experimental results when these particles are submitted to different drying conditions (Table 15.2.3.5). The same observation is valid for tetrahydrofuran for which the allowed upper limit is 5000 ppm. But the residue in hexane is sometimes above the regulatory threshold. The only way to be definitely below this limit is to heat paracetamol to 156°C; this confirms the advantage of flash drying this substance. As previously described, this temperature is critical for paracetamol recrystallization in the solvents used.
1124 |
Christine Barthélémy, Michel Bauer |
This study enables us to underline some considerations about the drying conditions of crystals. It is important to note that not only should the usual parameters be taken into account, such as the melting point of the substances and the boiling point of the solvents, but also the texture of the particles and the thermodynamic events that can occur when the substance is heated.
The kinetic of temperature increase must be chosen with respect to crystalline particle texture to obtain optimal drying conditions for lowest RS content. Progressive drying can give better solvent elimination when the texture is very finely sintered to avoid the crusting effect, which hinders any ulterior solvent escape.2
When a solvate is formed, the drying temperature must be either equal to or higher than the desolvation temperature.
Lastly, the knowledge of the existence of solid-solid transitions could be in this respect of great interest. Thermogravimetry and DSC analysis are, among others, very efficient tools to assess these phenomena.
References
1European Pharmacopoeia, 3rd edition, addendum 1999, pp. 216-224.
2C. Barthélémy, P. Di Martino, A-M. Guyot-Hermann, Die Pharmazie, 50, 609 (1995).
3 A. Ettabia, C. Barthélémy, M. Jbilou, A-M. Guyot-Hermann, Die Pharmazie, 53, 565 (1998).
4Y. Kawashima, M. Okumura, H. Takenaka, Science, 216, 1127 (1982).
5J-M. Fachaux, A-M. Guyot-Hermann, J-C. Guyot, P. Conflant, M. Drache, S. Veesler, R. Boistelle, Powder Techn., 82, 2, 123 (1995).
6 Note for Guidance on impurities: Residual solvents, Drugs made in Germany, 41, 98 (1998).
7F. Guillaume, A-M. Guyot-Hermann, Il farmaco, 48, 473 (1993).
8 M. Jbilou, A. Ettabia, A-M. Guyot-Hermann, J-C. Guyot , Drug Dev. & Ind. Pharm., 25, 3, 297 (1999). 9 A. Ettabia, E. Joiris, A-M. Guyot-Hermann, J-C. Guyot, Pharm. Ind., 59, 625 (1997).
10 A. Ettabia, European Thesis, Lille II University, France (8/10/1997).

16
Residual Solvents in Products
16.1 RESIDUAL SOLVENTS IN VARIOUS PRODUCTS
George Wypych
ChemTec Laboratories, Inc., Toronto, Canada
There are physical and chemical barriers that control solvent removal from solid-solvent systems. The most basic relation is given by the following equation:
W = |
P1 |
[16.1.1] |
|
Kw
where:
Wequilibrium fraction of residual solvent
P1 |
partial pressure of solvent in vapor phase |
Kw |
Henry’s law constant |
Both the partial pressure and Henry’s law constant depend on temperature, pressure, and solvent properties. This relationship does not consider interaction between solute and solvent. In the case of polymers, the Flory-Huggins theory gives a simplified relationship for low concentrations of solvent:
ln |
P1 |
|
|
= ln φ1 + 1+ χ |
[16.1.2] |
P 0 |
|
|
|||
|
|
|
|
|
|
1 |
|
|
|
|
|
where: |
|
|
|
|
|
|
P |
0 |
vapor pressure of pure solvent |
|
|
1 |
|
|
|
||
|
φ1 |
volume fraction of solvent |
|
||
χFlory-Huggins interaction parameter
Vapor pressures of some solvents can be found in the referenced monograph.1
The weight fraction of residual solvent at equilibrium can be calculated from the fol-
lowing equation, which accounts for polymer-solvent interaction: |
|
|||||
W = |
P1 |
|
ρ1 |
exp− (1+ χ) |
[16.1.3] |
|
P 0 |
|
ρ |
2 |
|||
|
|
|
|
|||
1 |
|
|
|
|
||
where: |
|
|
|
|
|
|
ρ1 |
|
|
|
density of solvent |
|
|
ρ2 |
|
|
|
density of polymer |
|
|
1126 |
|
|
|
|
|
|
|
|
|
George Wypych |
||
|
1 |
|
|
|
|
|
The last equation does not give the |
|||||
unit |
|
|
|
|
|
real values of residual solvents |
||||||
|
|
|
|
|
|
|||||||
|
|
|
|
|
|
because |
equilibrium |
is not |
||||
|
|
|
|
|
|
|
|
|
|
|
||
molecules/styrene |
0.8 |
|
|
|
|
|
attained in real drying processes |
|||||
|
|
|
|
|
and the prediction of different |
|||||||
|
|
|
|
|
|
|||||||
|
|
|
|
|
|
interactions |
by |
the interaction |
||||
0.6 |
|
|
|
|
|
parameter is too simplistic. The |
||||||
|
|
|
|
|
|
real values are substantially higher |
||||||
|
|
|
|
|
|
and the real barriers of solvent |
||||||
0.4 |
|
|
|
|
|
removal more complex. These are |
||||||
|
|
|
|
|
|
discussed below. |
|
|||||
|
|
|
|
|
|
In real systems, several phe- |
||||||
n-heptane |
|
|
|
|
|
|
||||||
0.2 |
|
|
|
|
|
nomena take place. These include |
||||||
|
|
|
|
|
|
chemical interaction between the |
||||||
|
|
|
|
|
|
functional groups of polymer and |
||||||
0 |
|
|
|
|
|
the solvent. These are mostly re- |
||||||
|
0 |
2 |
4 |
6 |
8 |
10 |
lated to hydrogen bond formation. |
|||||
|
|
|
Time, min |
|
|
The crystalline structure of poly- |
||||||
|
|
|
|
|
mer is responsible for the modifi- |
|||||||
|
|
|
|
|
|
|
||||||
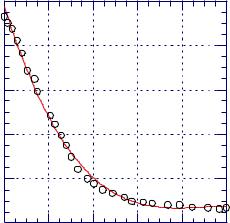
Figure 16.1.1. Number of n-heptane molecules per one mer of poly- |
cation of |
the diffusion |
process. |
|||||||||
Solvent properties determine dif- |
||||||||||||
styrene vs. drying time. [Data from L A Errede, P J Henrich, |
|
|||||||||||
J N Schrolpfer, J. Appl. Polym. Sci., 54, 649 (1994).] |
|
|
fusion. Polymer properties are re- |
|||||||||
|
|
|
|
|
|
|
sponsible |
|
for |
the |
macro- |
|
|
|
|
|
|
|
|
mechanism |
of |
solvent |
removal |
||
from a highly viscous polymer. In addition, some real systems make use of stripping solvents which are designed to help in removal of trace quantities of solvents by use of stripping solvent displacing process solvent. These various factors interplay and determine the result. Figure 16.1.1 shows the number of residual solvent molecules per one mer of polystyrene. It is evident that solvent removal has zero-kinetics until its concentration is decreased to about 0.2 molecules of solvent per mer. It is also true that some solvent remains after drying. Even after 24 h drying, 0.06% solvent remains.
These data indicate that there is a different mechanism of removing residual solvent. It is not clear if this is because of interactions, a change in the glass transition temperature, or a change in crystallinity. So far the partial effects of these influences cannot be separated. It is confirmed by experiment that in the last stages of drying, glass transition temperature of polymer changes rapidly. Also, the degree of crystallinity of the polymer increases during drying.3,4 From studies on polyaniline, it is known that its conductivity depends on the concentration of adsorbed molecules of water.5 Water interacts by hydrogen bonding with the polymer chain. The activation energy of hydrogen bonding is very low at 3-5 kcal/mol. Drying at 120oC reduced the amount of water molecules from 0.75 to 0.3 molecules per aniline unit. This change in water concentration drastically alters electrical conductivity which decreases by three orders of magnitude. Drying for two hours at 120oC did not result in complete removal of water. Given that the activation energy of hydrogen bonding is very low, the process of interaction is probably not the main barrier to removal of residual moisture. Also the relationship between conductivity and number of molecules of water is linear in the range from 0.15 to 0.75 molecules of water per aniline unit which means that there is no drastic change in the mechanism by which water participates in increasing the conductivity of polyaniline. Its conductivity simply depends on the distance between neighboring adsorbed molecules of water which apparently participate in the charge migration.
16.1 Residual solvents in various products |
1127 |
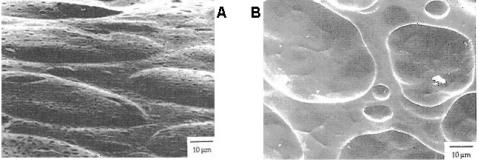
Figure 16.1.2. Blister formation in polyethylene containing originally 4000 ppm hexane. a - lateral surface 2.2 s after extrusion, b - cross-section after 28 s. [Adapted, by permission from R J Albalak, Z Tadmor, Y Talmon, AIChE J., 36, 1313 (1990).]
SEM studies contribute to an understanding of a major obstacle to residual solvent removal. Figure 16.1.2 shows two photographs of polyethylene strands extruded from a melt which initially contained 4000 ppm hexane. After a short period of time following the extrusion, blisters form which remain in the material and become enlarged until they break and release solvent. This blistering mechanism, determines the rate of residual solvent removal from the material. The rate of removal depends on bubble nucleation, temperature, and polymer rheological properties.6
Observing such mechanisms makes it easy to understand the principle involved in stripping solvents which became popular in recent inventions.7-9 Stripping solvents were used to improve the taste and odor properties and the oxidative thermal stability of thermoplastic ethylene polymers.7 Volatile components, such as products of degradation, solvent and monomer contribute to taste problems and odor formation. Striping solvents used include highly volatile hydrocarbons (ethylene, propylene, isobutane), inert gases, and supercritical fluids. An addition of at least 0.1% stripping solvent reduces volatiles from the typical levels of between 300-950 ppm to 45 ppm with even as low as 10 ppm possible. A stripping solvent helps in the generation of bubbles and their subsequent breaking by which both the stripping and the residual solvent are removed. In cosmetics and pharmaceutical formulations traces of solvents such as benzene or dichloromethane, used in the synthesis of acrylic acid polymer, disqualify the material. It is not unusual for this polymer to contain up to 1000 ppm of dichloromethane or up to 100 ppm of benzene. The use of mixed ester solvents helps to reduce residual solvent to below 5 ppm.8 Polycarbonate pellets from normal production may contain up to 500 ppm solvent. This makes processing polycarbonate to optical products very difficult because of bubble formation. Elimination of volatiles renders the product suitable for optical grade articles.9 These inventions not only demonstrate how to eliminate solvents but also confirm that the mechanism discussed in Figure 16.1.2 operates in industrial processes. The examples also show that large quantities of residual solvents are retained by products in their normal synthesis.
Many standard methods are used to devolatilize materials. Flash devolatilizer or falling strand devolatilizer are synonyms of equipment in which the falling melt is kept below the saturation pressure of volatiles. Styrene-acrylonitrile copolymers devolatilized in flash devolatilizer had a final concentration of ethylbenzene of 0.04-0.06.1 Devolatilization of LLDPE in a single-screw extruder leaves 100 ppm of hydrocarbon solvent. 500 ppm chlorobenzene remains in similarly extruded polycarbonate.1 It is estimated that if the polymer contains initially 1-2% solvent, 50-70% of that solvent will be removed through the vacuum port of an extruder.1 These data seem to corroborate the information included in the above
George Wypych
discussed patents. The data show that con-
siderable amounts of residual solvents can
be found in polymers and plastic materials.
In the food industry, residual solvents
associated with packaging odors enter food
products from two sources: packing materi-
als and printing inks.10 It is estimated that
concentrations of residual solvents have re-
cently decreased (from 2000 mg/ream in
past to 1000 mg/ream).10 However, a new problem has become apparent in introduction of low fat or no fat food.11 It was
discovered11 that more customer com-
plaints about odor were received for these low fat baked goods products. Analysis shows that fat was a good solvent for volatiles (solvents) and consequently solvent odor was not detected because flavor perception is developed relative to the concentration of gaseous flavor compounds. Figure 16.1.3 shows the concentrations of three solvents as detected by gas chroma-
tography. Substantially higher concentrations are detected in solvent-spiked fat-free cookies than in fat-containing cookies.11 In this experiment solvents were added to the cookies. In another experiment, packaged cookies were exposed to a solvent vapor atmosphere and different trends were recorded for cookies packaged in two different films. If the film had good barrier properties, no difference was noticeable between both types of cookies and the adsorbed quantities of solvents were minimal. If the cookies were packaged in a coextruded film having lower barrier properties, no-fat cookies absorbed 42% more solvent than full fat cookies.
In the construction industry, residual solvent evaporation becomes an increasingly more critical issue, especially in the case of products used for indoor applications. Sealants, adhesives, and paints are now a major focus of this concern since they contribute to indoor pollution. Similar trends are observed in the automotive industry where both solvents and plasticizers are suspected of contributing to a “plastics” odor in car interiors.
In contrast, changes in the solvent evaporation rate may also contribute to product improvement in paints. Small quantities of properly selected solvents can improve physical properties and the appearance of paints. Other applications of residual solvents include time-controlled release of fertilizers and production of materials with controlled morphology.
REFERENCES
1 R J Albalak, Ed., Polymer Devolatilization, Marcel Dekker, Inc., New York, 1996. 2 L A Errede, P J Henrich, J N Schrolpfer, J. Appl. Polym. Sci., 54, 649 (1994).
3 M O Ngui, S K Mallapragada, J. Polym. Sci., Polym. Phys., 36, 2771 (1998). 4 H-T Kim, S-K Kim, J-K Park, Polym. J., 31, 154 (1999).
5E S Matveeva, Synthetic Metals, 79, 127 (1996).
6R J Albalak, Z Tadmor, Y Talmon, AIChE J., 36, 1313 (1990).
7 M M Hughes, M E Rowland, C A Strait, US Patent 5,756,659, The Dow Chemical Company, 1998.
8A Bresciani, US Patent 5,342,911, 1994.
9 T Hosomi, T Umemura, T Takata, Y Mori, US Patent 5,717,055, Mitsubishi Gas Chemical, Ltd., 1998.
10R M Podhajny, Paper Film Foil Converter, 72, 12, 24 (1998).
11T Clark, Paper Film Foil Converter, 70, 11, 48 (1996).
16.2 Residual solvents in pharmaceutical substances |
1129 |
16.2 RESIDUAL SOLVENTS IN PHARMACEUTICAL SUBSTANCES
Michel Bauer
International Analytical Department, Sanofi-Synthélabo, Toulouse, France
Christine Barthélémy
Laboratoire de Pharmacie Galénique et Biopharmacie, Faculté des Sciences Pharmaceutiques et Biologiques, Université de Lille 2, Lille, France
16.2.1 INTRODUCTION
The need to test for residual solvents (RS) in pharmaceutical substances was recognized in the late 70’s when some pharmacopoeias like those of USA (USP XX) or Great-Britain (BP 80 + add 82) introduced specific tests for RS in some monographs. But we had to wait until the early 80’s to see a rational approach for establishing specifications from toxicological data. This strategy was developed by a working group of the Italian Pharmacopoeia1 starting from the threshold limit values for Chemical Substances and Physical Agents in the Work Environment published by the American Congress of Governmental Experts for Industrial hygiene.2 In the late 80’s, RS were definitively classified as impurities per se. Methods and specifications appeared in different issues of Pharmacopeial Forum and were submitted for discussion and finally integrated in the USP. At the same time only few such monographs could be found in the European Pharmacopoeia (Eur. Ph.) or British Pharmacopoeia (BP). Interestingly, the notion of a content limit for residual solvents in relation to the daily intake of the drug was introduced (see Eur. Ph. 2nd edition), a concept which was taken up later in the ICH Guideline. Numerous publications have been devoted to this subject.3-9
Although the number of papers on RS is immense, they are very often limited to specialized areas such as regulatory aspects or methodology aspects. In this chapter, different topics will be considered, starting with the fundamental question: why look for RS in pharmaceutical products? It is worth noting that Witschi and Doelker10 published in 1997 a very detailed and up-to-date review stressing the importance of this subject in the pharmaceutical field.
16.2.2 WHY SHOULD WE LOOK FOR RS?
As we already have seen in Chapter 14.21.1, RS could have various effects on the drug substances, excipients and drug products.
16.2.2.1 Modifying the acceptability of the drug product
The presence of RS could seriously impair customer compliance because of the odor or the taste they can cause in the final pharmaceutical preparation. Rabiant2 quotes the case of a drug substance having undergone, for technical reasons, a washing with isopropanol not planned in the manufacturing protocol. The oral solution prepared from this batch contained 100 ppm of this solvent and consequently had an odor that the majority of the patients accepted only with reluctance; the batch concerned was finally removed from the market.
1130 |
Michel Bauer, Christine Barthélémy |
16.2.2.2Modifying the physico-chemical properties of drug substances (DS) and drug products (DP)
The role of the quality of the solvents on the stability e.g. of the raw materials, DS and DP (see Section 14.21.1) has already been discussed. It must be remembered that RS (including water) can show different kinds of interactions with solid substances:11
•Solvents adsorbed on the crystal surfaces, which generally are easily removed because of the existence of weak physical interactions.
•Occluded solvents and clathrates which are more difficult to extract without impairing the quality of the drug by, for example, excessive drying.
•Solvents bound to drug molecules in the crystal lattice. These solvents present as solvates (hydrates) are lost at a characteristic temperature and may be stable only over a limited range of relative humidity. The solvates and desolvated solvates, whilst being two different chemical entities, can retain the same crystalline structure (similarity of x-ray diffraction pattern) but show different
physico-chemical properties.12-14
One of the most important effects of organic solvents absorbed on crystal surfaces is the ability to reduce the wettability of the crystals, especially if the solvent concerned is hydrophobic.15
Another interesting aspect, particularly in the case of residual water, is its role as an agent of recrystallization of poorly crystalline substances. It is well known that amorphous or partially amorphous products can undergo a recrystallization16,17 process over time in presence of water. If amorphous phases are an interesting way to promote the dissolution rate of poorly soluble drugs, their main drawback is their physical instability triggering the possible crystallization of the drug and leading to a decrease in dissolution rate and possibly of bioavailability, over a period of time.
Furthermore the residual adsorbed water may have an impact on the flowability of a powder, which is linked to the solubility of the substance and the hydrophilicity of the crystal faces.15 Other physico-chemical parameters are influenced by RS, like particle size and dissolution properties. For more information we refer to the publications of Doelker10 and Guyot-Hermann15 and references quoted therein. Nevertheless, one example deserves to be mentioned here.10,16 Residual isopropyl alcohol enhanced the water permeability of Eudragit® L films used as tablet coating for protecting water-sensitive drugs as demonstrated by List and Laun.16 This implies particular conditions for the storage of coated tablets during the film-drying process. The atmosphere should be as dry as possible.
The need to keep the RS level as low as possible can lead to some problems. It has been reported15,17 that a drug substance displaying a strong odor of residual solvent was sub-
mitted to reprocessing, consisting of the displacement of the residual solvent by a stream of water vapor. During this process which slightly modified the surface crystallinity of the particles, a small amount of an impurity was produced. The consequence was an increase of the surface solubility of this drug substance. During the preparation of the DP using an aqueous wet granulation, a liquification of the granulate was observed making the manufacture impossible. After having removed the impurity by purifying the DS a successful manufacture of the DP was achieved.
There are other aspects linked to the manufacturing process and drying conditions which impact on the final RS content. They are discussed in Chapter 15.2.3 of this book (and references cited therein).
Nevertheless before closing this paragraph, another example of the relationship between the manufacturing process and RS is worth mentioning here. It relates to the formation of volatile compounds produced by radiolysis and which could induce odor. Barbarin et