

Wypych Handbook of Solvents
.pdf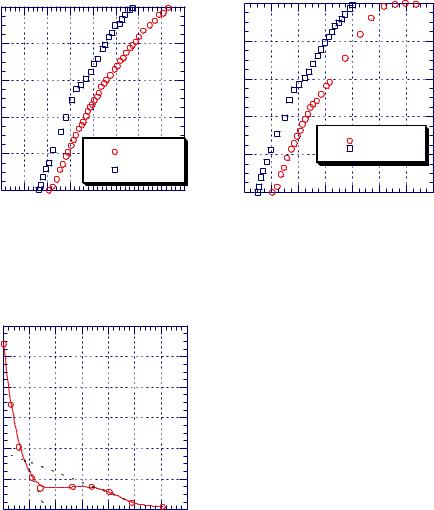
7.1 Introduction to diffusion, swelling, and drying |
343 |
|
1 |
|
|
|
1 |
|
|
|
|
|
|
|
|
|
|
|
|
|
|
|
|
|
0.8 |
|
|
|
0.8 |
|
|
|
|
|
ratio |
0.6 |
|
|
ratio |
0.6 |
|
|
|
|
|
Absorbance |
|
|
Absorbance |
|
|
|
|
|
||
0.4 |
|
|
0.4 |
|
|
|
|
|
||
|
|
|
|
|
|
|
|
286 m |
||
|
0.2 |
|
43,000 |
|
0.2 |
|
|
|
|
185 m |
|
|
|
|
|
|
|
|
|||
|
|
|
8,000 |
|
|
|
|
|
|
|
|
0 |
50 |
100 150 200 250 300 350 400 |
|
0 |
|
|
|
|
|
|
0 |
|
5 |
|
5 |
|
6 |
6 |
||
|
|
|
|
|
2 10 |
6 10 |
1 10 |
1.4 10 |
||
|
|
|
t1/2, s1/2 |
|
|
t |
1/2 |
1/2 |
m |
-1 |
|
|
|
|
|
|
/2L, s |
|
|||
Figure 7.1.7. Absorbance ratio vs. exposure time to water for PMMA films of different thickness. [Adapted, by permission, from I Linossier, F Gaillard, M Romand, J F Feller, J. Appl. Polym. Sci., 66, No.13, 2465-73 (1997).]
|
0.12 |
|
Similar observations were made using |
|
|
|
|
||
|
0.1 |
|
internal reflection Fourier transform infra- |
|
-1 |
|
red to measure water diffusion in polymer |
||
|
|
|||
min |
0.08 |
|
films.9 Figure 7.1.6 shows that there is a |
|
1 |
|
time lag between the beginning of immer- |
||
- |
|
|
||
g |
|
|
||
g |
|
|
sion and water detection in polymer film. |
|
rate, |
0.06 |
|
||
|
This time lag increases as the molecular |
|||
|
|
|||
|
tp |
weight increases (Figure 7.1.6) and film |
||
Diffusion |
0.04 |
|||
|
thickness increases (Figure 7.1.7). After an |
|||
|
|
|||
0.02 |
|
initial increase in water concentration, the |
||
|
amount levels off. Typically, the effect of |
|||
|
|
|
||
|
0 |
|
molecular weight on the diffusion of the |
|
|
0 10 20 30 40 50 60 |
70 penetrant does not occur. High molecular |
||
|
|
Time, min |
weight polymer has a shift in the absorption |
|
|
|
|
peak from 1730 to 1723 cm-1 which is asso- |
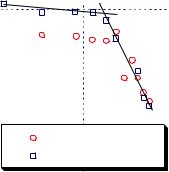
Figure 7.1.8. Relative diffusion rate vs. curing time. ciated with the hydrogen bonding of the
[Adapted, by permission, from Jinhua Chen, Kang Chen, |
carbonyl group. Such a shift does not occur |
Hong Zhang, Wanzhi Wei, Lihua Nie, Shouzhuo Yao, J. |
in low molecular weight PMMA. Water can |
Appl. Polym. Sci., 66, No.3, 563-71 (1997).] |
move at a higher rate in low molecular |
|
|
|
weight PMMA. In some other polymers, |
this trend might be reversed if the lower molecular weight polymer has end groups which can hydrogen bond with water.
Bulk acoustic wave admittance analysis was used to study solvent evaporation during curing.8 Three characteristic stages were identified: in the first stage viscosity increases accompanied by a rapid decrease in diffusion rate; in the second stage the film is formed, the
344 George Wypych
-1 |
10 |
|
|
|
|
|
|
|
|
|
|
|
|
|
|
|
|
|
|
|
|
|
|
|
|
|
|
|
|
|
|
|
|
|
|
|
|
|
|
|
|
|
surface appears dry (this stage ends when |
|
|
|
|
|
|
|
|
|
|
|
|
|
|
|
|
|
|
|
|
|
|
|
|
|
|
|
|
|
|
|
|
|
|
|
|
|
|
|
|
|
|||
|
|
|
|
|
|
|
|
|
|
|
|
|
|
|
|
|
|
|
|
|
|
|
|
|
|
|
|
|
|
|
|
|
|
|
|
|
|
|
|
|
|
||
s |
|
|
|
|
|
|
|
|
|
|
|
|
|
|
|
|
|
|
|
|
|
|
|
|
|
|
|
|
|
|
|
|
|
|
|
|
|
|
|
|
|
|
the surface is dry) and the diffusion rate be- |
2 |
|
|
|
|
|
|
|
|
|
|
|
|
|
|
|
|
|
|
|
|
|
|
|
|
|
|
|
|
|
|
|
|
|
|
|
|
|
|
|
|
|
|
|
cm |
|
|
|
|
|
|
|
|
|
|
|
|
|
|
|
|
|
|
|
|
|
|
|
|
|
|
|
|
|
|
|
|
|
|
|
|
|
|
|
|
|
|
comes very low; in the third stage solvent |
|
|
|
|
|
|
|
|
|
|
|
|
|
|
|
|
|
|
|
|
|
|
|
|
|
|
|
|
|
|
|
|
|
|
|
|
|
|
|
|
|
|
||
-8 |
|
|
|
|
|
|
|
|
|
|
|
|
|
|
|
|
|
|
|
|
|
|
|
|
|
|
|
|
|
|
|
|
|
|
|
|
|
|
|
|
|
|
diffuses from the cured film. This is a slow |
10 |
|
|
|
|
|
|
|
|
|
|
|
|
|
|
|
|
|
|
|
|
|
|
|
|
|
|
|
|
|
|
|
|
|
|
|
|
|
|
|
|
|
|
|
|
|
|
|
|
|
|
|
|
|
|
|
|
|
|
|
|
|
|
|
|
|
|
|
|
|
|
|
|
|
|
|
|
|
|
|
|
|
|
|
|
|
process during which diffusion rate drops to |
|
coefficient, |
|
|
|
|
|
|
|
|
|
|
|
|
|
|
|
|
|
|
|
|
|
|
|
|
|
|
|
|
|
|
|
|
|
|
|
|
|
|
|
|
|
|
|
|
|
|
|
|
|
|
|
|
|
|
|
|
|
|
|
|
|
|
|
|
|
|
|
|
|
|
|
|
|
|
|
|
|
|
|
|
|
|
|
|
|
||
|
|
|
|
|
|
|
|
|
|
|
|
|
|
|
|
|
|
|
|
|
|
|
|
|
|
|
|
|
|
|
|
|
|
|
|
|
|
|
|
|
|
zero. These changes are shown in Figure |
|
|
|
|
|
|
|
|
|
|
|
|
|
|
|
|
|
|
|
|
|
|
|
|
|
|
|
|
|
|
|
|
|
|
|
|
|
|
|
|
|
|
|
||
|
|
|
|
|
|
|
|
|
|
|
|
|
|
|
|
|
|
|
|
|
|
|
|
|
|
|
|
|
|
|
|
|
|
|
|
|
|
|
|
|
|
7.1.8. The diffusion rate during drying de- |
|
|
|
|
|
|
|
|
|
|
|
|
|
|
|
|
|
|
|
|
|
|
|
|
|
|
|
|
|
|
|
|
|
|
|
|
|
|
|
|
|
|
|
||
|
|
|
|
|
|
|
|
|
|
|
|
|
|
|
|
|
|
|
|
|
|
|
|
|
|
|
|
|
|
|
|
|
|
|
|
|
|
|
|
|
|
creases as the concentration of polymer |
|
diffusion |
|
|
|
|
|
|
|
|
|
|
|
|
|
|
|
|
|
|
|
|
|
|
|
|
|
|
|
|
|
|
|
|
|
|
|
|
|
|
|
|
|
|
(phenol resin) in varnish increases. Also, |
|
|
|
|
|
|
|
|
|
|
|
|
Light scattering |
|
|
|
|
the time to reach the slope change point in |
||||||||||||||||||||||||||
|
|
|
|
|
|
|
|
|
|
|
|
|
|
|
|
|
|
|
|
|
|
|
|
|
|
|
|
|
|
|
|
|
|
|
|
|
|
|
|
|
|
||
|
|
|
|
|
|
|
|
|
|
|
|
Fluorescence recovery |
|
|
|
|
diffusion/time relationship increases as the |
||||||||||||||||||||||||||
- |
|
|
|
|
|
|
|
|
|
|
|
|
|
|
|
|
|
|
|
|
|
|
|
|
|
|
|
|
|
|
|
|
|
|
|
|
|
|
|
|
|
|
concentration of polymer increases.8 |
Self |
1 |
|
|
|
|
|
|
|
|
|
|
|
|
|
|
|
|
|
|
|
|
|
|
|
|
|
|
|
|
|
|
|
|
|
|
|
|
|
|
|
|
|
|
|
|
|
|
|
|
|
|
|
|
|
|
|
|
|
|
|
|
|
|
|
|
|
|
|
|
|
|
|
|
|
|
|
|
|
|
|
|
|
|
|
Two methods have been used to mea- |
||
0.1 |
1 |
|
|
|
|
|
|
|
|
|
|
|
|
|
|
|
|
10 |
|||||||||||||||||||||||||
|
|
|
|
|
|
|
|
|
|
|
|
|
|
|
|
|
|||||||||||||||||||||||||||
|
|
|
|
-3 |
|
|
|
|
|
|
|
|
sure the diffusion coefficient of toluene in |
||||||||||||||||||||||||||||||
|
|
|
|
|
Polymer concentration, g cm |
|
|
|
|
||||||||||||||||||||||||||||||||||
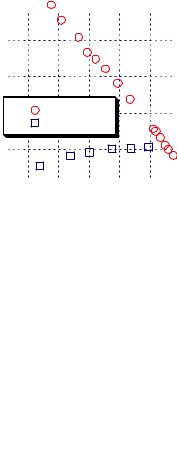
Figure 7.1.9. Self-diffusion coefficient vs. polystyrene |
mixtures of polystyrenes having two differ- |
||||||||||||||||||||||||||||||||||||||||||
|
|||||||||||||||||||||||||||||||||||||||||||
concentration. [Adapted, by permission, from |
|
|
|
|
ent molecular weights: one was dynamic |
||||||||||||||||||||||||||||||||||||||
L Meistermann, M Duval, B Tinland, Polym. Bull., 39, |
light scattering and the other, fluorescence |
||||||||||||||||||||||||||||||||||||||||||
No.1, 101-8 (1997).] |
|
|
|
|
recovery after bleaching.10 The data show |
||||||||||||||||||||||||||||||||||||||
that the relationship between the diffusion coefficient and polymer concentration is not linear. The crossover point is shown in Figure 7.1.9. Below a certain concentration of polymer, the diffusion rate drops rapidly according to different kinetics. This is in agreement with the above theory (see Figure 7.1.1 and explanations for equation [7.1.2]). The slope exponent in this study was -1.5 which is very close to the slope exponent predicted by the theory of reptation (-1.75).
The above data show that theoretical predictions are accurate when modelling diffusion phenomena in both simple and complicated mixtures containing solvents.
7.1.2 SWELLING
Polymers differ from other solids because they may absorb large amounts of solvents without dissolving. They also undergo large deformations when relatively small forces are involved.12 Swelling occurs in a heterogeneous two phase system a solvent surrounding a swollen body also called gel. Both phases are separated by the phase boundary permeable to solvent.13
The swelling process (or solvent diffusion into to the solid) occurs as long as the chemical potential of solvent is large. Swelling stops when the potentials are the same and this point is called the swelling equilibrium. Swelling equilibrium was first recognized by Frenkel14 and the general theory of swelling was developed by Flory and Rehner.15,16
The general theory of swelling assumes that the free energy of mixing and the elastic free energy in a swollen network are additive. The chemical potential difference between gel and solvent is given by the equation:
(µ1 − µ10 ) = (µ1 − µ10 )mix + (µ1 − µ10 )el |
[7.1.5] |
where:
|
1 |
chemical potential of gel |
|
10 |
chemical potential of solvent |

George Wypych
|
310 |
|
|
|
|
|
|
|
|
|
|
|
|
|
|
|
|
|
|
|
|
|
|
|
|
|
|
|
|
|
|
|
|
|
|
|
|
|
|
|
|
|
|
|
|
|
|
|
|
|
|
|
|
|
|
|
|
|
|
|
A comparison of equations [7.1.7] |
|
|
|
|
|
|
|
|
|
|
|
|
|
|
|
|
|
|
|
|
|
|
|
|
|
|
|
|
|
|
|
|
|
|
|
|
|
|
|
|
|
|
|
|
|
|
|
|
|
|
|
|
|
|
|
|
|
|
|
|
|
|
and [7.1.8] shows that the slope and sign of |
|
|
300 |
|
|
|
|
|
|
|
|
|
|
|
|
|
|
|
|
|
|
|
|
|
|
|
|
|
|
|
|
|
|
|
|
|
|
|
|
|
|
|
|
|
|
|
|
|
|
|
|
|
|
|
|
|
|
|
|
|
|
|
swelling curve are determined by the quan- |
|
|
|
|
|
|
|
|
|
|
|
|
|
|
|
|
|
|
|
|
|
|
|
|
|
|
|
|
|
|
|
|
|
|
|
|
|
|
|
|
|
|
|
|
|
|
|
|
|
|
|
|
|
|
|
|
|
|
|
|
|
|||
|
|
|
|
|
|
|
|
|
|
|
|
|
|
|
|
|
|
|
|
|
|
|
|
|
|
|
|
|
|
|
|
|
|
|
|
|
|
|
|
|
|
|
|
|
|
|
|
|
|
|
|
|
|
|
|
|
|
|
|
|||
|
|
|
|
|
|
|
|
|
|
|
|
|
|
|
|
|
|
|
|
|
|
|
|
|
|
|
|
|
|
|
|
|
|
|
|
|
|
|
|
|
|
|
|
|
|
|
|
|
|
|
|
|
|
|
|
|
|
|
|
tity Hg / l or cr . Since the melting enthalpy of |
||
|
|
|
|
|
|
|
|
|
|
|
|
|
|
|
|
|
|
|
|
|
|
|
|
|
|
|
|
|
|
|
|
|
|
|
|
|
|
|
|
|
|
|
|
|
|
|
|
|
|
|
|
|
|
|
|
|
|
|
|
|||
K |
|
|
|
|
|
|
|
|
|
|
|
|
|
|
|
|
|
|
|
|
|
|
|
|
|
|
|
|
|
|
|
|
|
|
|
|
|
|
|
|
|
|
|
|
|
|
|
|
|
|
|
|
|
|
|
|
|
|
|
|
1 |
|
|
|
|
|
|
|
|
|
|
|
|
|
|
|
|
|
|
|
|
|
|
|
|
|
|
|
|
|
|
|
|
|
|
|
|
|
|
|
|
|
|
|
|
|
|
|
|
|
|
|
|
|
|
|
|
|
|
|
|
|
water is much larger than the transfer |
||
Temperature, |
|
|
|
|
|
|
|
|
|
|
|
|
|
|
|
|
|
|
|
|
|
|
|
|
|
|
|
|
|
|
|
|
|
|
|
|
|
|
|
|
|
|
|
|
|
|
|
|
|
|
|
|
|
|
|
|
|
|
|
|
||
290 |
|
|
|
|
|
|
|
|
|
|
|
|
|
|
|
|
|
|
|
|
|
|
|
|
|
|
|
|
|
|
|
|
|
|
|
|
|
|
|
|
|
|
|
|
|
|
|
|
|
|
|
|
|
|
|
|
|
|
|
enthalpy of water, the swelling curves of |
||
|
|
|
|
|
|
|
|
|
|
|
|
|
|
|
|
|
|
|
|
|
|
|
|
|
|
|
|
|
|
|
|
|
|
|
|
|
|
|
|
|
|
|
|
|
|
|
|
|
|
|
|
|
|
|
|
|
|
|
||||
|
|
|
|
|
|
|
|
|
|
|
|
|
|
|
|
|
|
|
|
|
|
|
|
|
|
|
|
|
|
|
|
|
|
|
|
|
|
|
|
|
|
|
|
|
|
|
|
|
|
|
|
|
|
|
|
|
|
|
|
gel in liquid water are very steep. The sign |
||
|
|
|
|
|
|
|
|
|
|
|
|
|
|
|
|
|
|
|
|
|
|
|
|
|
|
|
|
|
|
|
|
|
|
|
|
|
|
|
|
|
|
|
|
|
|
|
|
|
|
|
|
|
|
|
|
|
|
|
|
|||
280 |
|
|
|
|
|
|
|
|
|
|
|
|
|
|
|
|
|
|
|
PEO/water |
|
|
|
|
|
|
|
|
|
|
|
|
|
|
|
|
|
|
|
|
|
|
of the slope is determined by the heat trans- |
|||||||||||||||||||
|
|
|
|
|
|
|
|
|
|
|
|
|
|
|
|
|
|
|
|
|
|
|
|
|
|
|
|
|
|
|
|
|
|
|
|
|
|
|
|
|
||||||||||||||||||||||
|
|
|
|
|
|
|
|
|
|
|
|
|
|
|
|
|
|
|
|
|
|
|
|
fer of the solvent which may be negative, |
||||||||||||||||||||||||||||||||||||||
|
|
|
|
|
|
|
|
|
|
|
|
|
|
|
|
|
|
|
|
PEO/ice |
|
|
|
|||||||||||||||||||||||||||||||||||||||
|
|
|
|
|
|
|
|
|
|
|
|
|
|
|
|
|
|
|
|
|
|
|||||||||||||||||||||||||||||||||||||||||
270 |
|
|
|
|
|
|
|
|
|
|
|
|
|
|
|
|
|
|
|
|
|
|
|
|
|
|
|
|
|
|
|
|
|
|
|
|
|
|
|
|
|
|
|
|
|
|
|
|
|
|
|
|
|
|
|
|
|
|
|
positive or zero depending on the quality of |
||
|
|
|
|
|
|
|
|
|
|
|
|
|
|
|
|
|
|
|
|
|
|
|
|
|
|
|
|
|
|
|
|
|
|
|
|
|
|
|
|
|
|
|
|
|
|
|
|
|
|
|
|
|
|
|
|
|
|
|
|
|||
|
|
|
|
|
|
|
|
|
|
|
|
|
|
|
|
|
|
|
|
|
|
|
|
|
|
|
|
|
|
|
|
|
|
|
|
|
|
|
|
|
|
|
|
|
|
|
|
|
|
|
|
|
|
|
|
|
|
|
|
solvent. The melting enthalpy is always |
||
|
|
|
|
|
|
|
|
|
|
|
|
|
|
|
|
|
|
|
|
|
|
|
|
|
|
|
|
|
|
|
|
|
|
|
|
|
|
|
|
|
|
|
|
|
|
|
|
|
|
|
|
|
|
|
|
|
|
|
|
|
||
|
|
|
|
|
|
|
|
|
|
|
|
|
|
|
|
|
|
|
|
|
|
|
|
|
|
|
|
|
|
|
|
|
|
|
|
|
|
|
|
|
|
|
|
|
|
|
|
|
|
|
|
|
|
|
|
|
|
|
|
|
positive and therefore the swelling curve in |
|
|
|
|
|
|
|
|
|
|
|
|
|
|
|
|
|
|
|
|
|
|
|
|
|
|
|
|
|
|
|
|
|
|
|
|
|
|
|
|
|
|
|
|
|
|
|
|
|
|
|
|
|
|
|
|
|
|
|
|
|
|
||
|
260 |
|
|
|
|
|
|
|
|
|
|
|
|
|
|
|
|
|
|
|
|
|
|
|
|
|
|
|
|
|
|
|
|
|
|
|
|
|
|
|
|
|
|
|
|
|
|
|
|
|
|
|
|
|
|
|
|
|
|
|
the presence of crystalline solvent is flat |
|
|
0.25 0.3 |
0.35 0.4 0.45 0.5 0.55 |
with a positive slope. A positive slope in |
|||||||||||||||||||||||||||||||||||||||||||||||||||||||||||
|
|
|
|
|
|
|
|
|
|
|
Mass fraction of water |
temperatures below zero (for ice) means |
||||||||||||||||||||||||||||||||||||||||||||||||||
|
|
|
|
|
|
|
|
|
|
|
|
|
|
|
|
|
|
|
|
|
|
|
|
|
|
|
|
|
|
|
|
|
|
|
|
|
|
|
|
|
|
|
|
|
|
|
|
|
|
|
|
|
|
|
|
|
|
|
|
|
||
Figure 7.1.10. Swelling of crosslinked polyurethane in |
that gel has to deswell (release water to its |
|||||||||||||||||||||||||||||||||||||||||||||||||||||||||||||
surrounding, or dry out) as temperature |
||||||||||||||||||||||||||||||||||||||||||||||||||||||||||||||
water and ice. [Adapted, by permission, from B Hladik, |
||||||||||||||||||||||||||||||||||||||||||||||||||||||||||||||
S Frahn, W Borchard, Polym. Polym. Compos., 3, No.1, |
decreases.13 Figure 7.1.10 illustrates this. |
|||||||||||||||||||||||||||||||||||||||||||||||||||||||||||||
21-8 (1995).] |
|
|
|
|
|
|
|
|
|
|
|
|
|
|
|
|
|
|
|
|
|
|
|
|
|
|
|
|
|
|
|
|
|
|
|
|
|
|
|
|
|
|
|
|
|
|
|
|
|
|
|
|
|
|
|
|
|
For practical purposes, simple equa- |
||||
|
|
|
|
|
|
|
|
|
|
|
|
|
|
|
|
|
|
|
|
|
|
|
|
|
|
|
|
|
|
|
|
|
|
|
|
|
|
|
|
|
|
|
|
|
|
|
|
|
|
|
|
|
|
|
|
|
|
|
|
|
tions are used to study swelling kinetics. |
|
The degree of swelling, α, is calculated from the following equation:17 |
||||||||||||||||||||||||||||||||||||||||||||||||||||||||||||||
|
α = |
V1 −V0 |
|
|
|
|
|
|
|
|
|
|
|
|
|
|
|
|
|
|
|
|
|
|
|
|
|
|
|
|
|
|
|
|
|
|
|
|
|
|
|
|
|
|
|
|
|
|
|
[7.1.9] |
||||||||||||
|
|
|
|
V0 |
|
|
|
|
|
|
|
|
|
|
|
|
|
|
|
|
|
|
|
|
|
|
|
|
|
|
|
|
|
|
|
|
|
|
|
|
|
|
|
|
|
|
|
|
|
|
|
|||||||||||
|
|
|
|
|
|
|
|
|
|
|
|
|
|
|
|
|
|
|
|
|
|
|
|
|
|
|
|
|
|
|
|
|
|
|
|
|
|
|
|
|
|
|
|
|
|
|
|
|
|
|
|
|
||||||||||
where: |
|
|
|
|
|
|
|
|
|
|
|
|
|
|
|
|
|
|
|
|
|
|
|
|
|
|
|
|
|
|
|
|
|
|
|
|
|
|
|
|
|
|
|
|
|
|
|
|
||||||||||||||
|
|
V1 |
|
|
|
volume of swollen solid at time t=t |
|
|||||||||||||||||||||||||||||||||||||||||||||||||||||||
|
|
V0 |
|
|
|
volume of unswollen solid at time t=0 |
||||||||||||||||||||||||||||||||||||||||||||||||||||||||
The swelling constant, K, is defined by: |
|
|||||
K = |
|
k1 |
= |
α |
|
[7.1.10] |
|
k 2 |
1− α |
||||
|
|
|
|
|||
where: |
|
|
|
|
|
|
|
k1 |
|
rate constant of swelling process |
|
||
|
k2 |
|
rate constant of deswelling process |
|
||
This shows that the swelling process is reversible and in a dynamic equilibrium. The distance of diffusion is time-dependent:
distance (time)n |
[7.1.11] |
The coefficient n is between 0.5 for Fickian diffusion and 1.0 for relaxation-controlled diffusion (diffusion of solvent is much faster than polymer segmental relaxation).18 This relationship is frequently taken literally19 to calculate diffusion distance from a measurement of the change of the linear dimensions of swollen material.
The following equation is used to model changes based on swelling pressure measurements:


7.1 Introduction to diffusion, swelling, and drying |
349 |
250 |
|
|
|
|
|
|
|
1654 |
|
|
|
|
|
|
|
200 |
|
|
|
|
|
|
-1 |
1652 |
|
|
|
|
|
|
|
150 |
|
|
|
|
|
|
Carbonyl frequency, cm |
1650 |
|
|
|
|
|
|
|
100 |
|
|
|
|
|
|
1648 |
|
|
|
|
|
|
|
|
50 |
|
|
|
|
|
|
1646 |
|
|
|
|
|
|
|
|
uptake,Mass% |
|
|
|
|
|
|
|
|
|
|
|
|
|
|
|
0 |
20 |
40 |
60 |
80 |
100 |
120 |
|
1644 |
50 |
100 |
150 |
200 |
250 |
300 |
350 |
0 |
|
0 |
|||||||||||||
|
|
Time, min |
|
|
|
|
|
Temperature, oC |
|
|
|||||
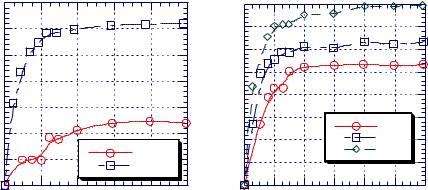
Figure 7.1.15. The mass uptake of TCE by PEEK vs. |
|
|
Figure 7.1.16. The frequency of carbonyl stretching |
||||||||||||||||||||||||
time. [Adapted, by permission, from B H Stuart, |
|
|
mode of PEEK vs. temperature. [Adapted, by |
||||||||||||||||||||||||
D R Williams, Polymer, 35, No.6, 1326-8 (1994).] |
|
|
permission, from B H Stuart, D R Williams, Polymer, 36, |
||||||||||||||||||||||||
|
|
|
|
|
|
|
|
|
|
|
|
|
|
|
|
|
|
|
|
|
|
|
|
|
|
|
No.22, 4209-13 (1995).] |
|
100 |
|
|
|
|
|
|
|
|
|
|
|
|
|
|
|
|
|
|
|
|
|
|
|
|
|
Figure 7.1.1 can be discussed from a |
|
|
|
|
|
|
|
|
|
|
|
|
|
|
|
|
|
|
|
|
|
|
|
|
|
|
|
|
% |
|
|
solution |
|
|
rubbery |
|
|
glassy |
|
|
different perspective of results given in Fig- |
|||||||||||||||
|
|
|
|
|
|
|
|
|
|
|
|
|
|
|
|
|
|
|
|
|
|
|
|
|
|
||
80 |
|
|
|
|
|
|
|
|
|
|
|
|
|
|
|
|
|
|
|
|
|
|
|
|
|
ure 7.1.17. There are also three regions here: |
|
|
|
|
|
|
|
|
|
|
|
|
|
|
|
|
|
|
|
|
|
|
|
|
|
|
|||
concentration, |
|
|
|
|
|
|
|
|
|
|
|
|
|
|
|
|
|
|
|
|
|
|
|
|
|
|
region 1 which has a low concentration of |
|
|
|
|
|
|
|
|
|
|
|
|
|
|
|
|
|
|
|
|
|
|
|
|
|
|
||
60 |
|
|
|
|
|
|
|
|
|
|
|
|
|
|
|
|
|
|
|
|
|
|
|
|
|
solid in which solvent evaporation is con- |
|
|
|
|
|
|
|
|
|
|
|
|
|
|
|
|
|
|
|
|
|
|
|
|
|
|
|||
|
|
|
|
|
|
|
|
|
|
|
|
|
|
|
|
|
|
|
|
|
|
|
|
|
trolled by the energy supplied to the system, |
||
|
|
|
|
|
|
|
|
|
|
|
|
|
|
|
|
|
|
|
|
|
|
|
|
|
|
||
|
|
|
|
|
|
|
|
|
|
|
|
|
|
|
|
|
|
|
|
|
|
|
|
|
|
||
40 |
|
|
|
|
|
|
|
|
|
|
|
|
|
|
|
|
|
|
|
|
|
|
|
|
|
region 2 in which both the energy supplied |
|
|
|
|
|
|
|
|
|
|
|
|
|
|
|
|
|
|
|
|
|
|
|
|
|
|
|||
|
|
|
|
|
|
|
|
|
|
|
|
|
|
|
|
|
|
|
|
|
|
|
|
|
to the system and the ability of polymer to |
||
|
|
|
|
|
|
|
|
|
|
|
|
|
|
|
|
|
|
|
|
|
|
|
|
|
|||
Solvent |
|
|
|
|
|
|
|
|
|
|
|
|
|
|
|
|
|
|
|
|
|
|
|
|
|
|
take up the free volume vacated by solvent |
|
|
|
|
|
|
|
|
|
|
|
|
|
|
|
|
|
|
|
|
|
|
|
|
|
|
||
20 |
|
|
|
|
|
|
|
|
|
|
|
|
|
|
|
|
|
|
|
|
|
|
|
|
|
are important, and region 3 where the pro- |
|
|
|
|
|
|
|
|
|
|
|
|
|
|
|
|
|
|
|
|
|
|
|
|
|
|
|||
|
|
|
|
|
|
|
|
|
|
|
|
|
|
|
|
|
|
|
|
|
|
|
|
|
cess is free volume controlled. Regions 2 |
||
|
|
|
|
|
|
|
|
|
|
|
|
|
|
|
|
|
|
|
|
|
|
|
|
|
|
||
|
|
|
|
|
|
|
|
|
|
|
|
|
|
|
|
|
|
|
|
|
|
|
|
|
|
||
|
|
|
|
|
|
|
|
|
|
|
|
|
|
|
|
|
|
|
|
|
|
|
|
|
|
|
|
|
0 |
|
|
|
|
|
|
|
|
|
|
|
|
|
|
|
|
|
|
|
|
|
|
|
|
|
and 3 are divided by the glass transition |
|
|
|
|
|
|
|
|
|
|
|
|
|
|
|
|
|
|
|
|
|
|
|
|
|
|
||
|
|
|
|
|
|
|
|
|
|
|
|
|
|
|
|
|
|
|
|
|
|
|
|
|
|
temperature. Drying processes in region 3 |
|
|
|
|
0.2 |
0.4 |
|
|
0.6 |
0.8 |
|
|
|
1 |
|||||||||||||||
|
0 |
|
|
|
|
|
|
||||||||||||||||||||
Time, arbitrary units |
and to some extent in region 2 determine the |
|
physical properties of dried material and the |
||
|
||
Figure 7.1.17. Solvent concentration vs. drying time. |
amount of residual solvent remaining in the |
|
|
||
|
product. A sharp transition between region |
|
|
2 and 3 (at glass transition temperature) |
might indicate that drying process is totally homogeneous but it is not and this oversimplifies the real conditions at the end of drying process. The most realistic course of events occurring close to the dryness point is presented by these four stages:27,28
•elimination of the volatile molecules not immobilized by the adsorption onto the polymer
•elimination of adsorbed molecules from the polymer in its rubbery state

350 |
George Wypych |
•evaporation-induced self association of the polymer with progressive entrapment of adsorbed volatile molecules in the glassy microdomains (during transition from a rubbery to a glassy state)
•elimination of residual molecules entrapped in the polymer.
The last two stages are discussed in Chapter 16 which deals with residual solvent. This discussion concentrates on the effect of components on the drying process and the effect of the drying process on the properties of the product.
|
A schematic of the drying process is |
|
represented in Figure 7.1.18. The material |
|
to be dried is placed on an impermeable |
|
substrate. The material consists of solvent |
|
and semicrystalline polymer which con- |
|
tains a certain initial fraction of amorphous |
|
and crystalline domains. The presence of |
Figure 7.1.18. Schematic representation of drying a |
crystalline domains complicates the pro- |
polymer slab. [Adapted, by permission, from M O Ngui, |
cess of drying because of the reduction in |
S K Mallapragada, J. Polym. Sci.: Polym. Phys. Ed., 36, |
diffusion rate of the solvent. Evaporation |
No.15, 2771-80 (1998).] |
of solvent causes an inward movement of |
|
material at the surface and the drying pro- |
cess may change the relative proportions of amorphous and crystalline domains.29 Equations for the change in thickness of the material and kinetic equations which relate composition of amorphous and crystalline domains to solvent concentration are needed to quantify the rate of drying.
The thickness change of the material during drying is given by the equation:
|
dL |
|
∂v1 |
|
|
v1 |
|
= D |
|
|
[7.1.13] |
|
∂x |
||||
|
dt |
|
x = L |
|
|
where: |
|
|
|
|
|
|
v1 |
|
volume fraction of solvent |
|
|
Lthickness of slab as in Figure 7.1.18
ttime
Ddiffusion coefficient
xcoordinate of thickness
The rate of change of crystalline volume fraction is given by the equation:
|
∂v 2c |
= k1v |
|
[7.1.14] |
|
|
1 |
||
|
∂t |
|
|
|
where: |
|
|
||
|
v2c |
|
volume fraction of crystalline phase |
|
|
k1 |
|
rate change of crystalline phase proportional to folding rate |
|
The rate of change of amorphous volume fraction is given by the equation:
∂v 2a |
= |
∂ |
∂v1 |
|
− k1v1 |
|
|
|
|
D |
|
|
[7.1.15] |
||
∂t |
|
∂x |
|||||
|
∂x |
|
|
|
|||
