

Physics of biomolecules and cells
.pdfLecture 5: Protein Folding on a Chip |
411 |
Abstract
The continuous-flow mixing chips presented in this lecture open up new dimensions for spectroscopy of protein reactions. The time resolution of 400 microseconds is about 1000 times faster than recent IR stopped-flow setups [20]. Additionally, the miniaturisation reduces the sample consumption by an even higher magnitude. For a reactant with a higher di usion constant than TFE, the time resolution can be further improved by using a smaller IR focus spot and a higher flow velocity. With the current design and the 10 mm spot of a synchrotron IR source [29], a time resolution on the order of 50 microseconds is feasible.
1 Introduction
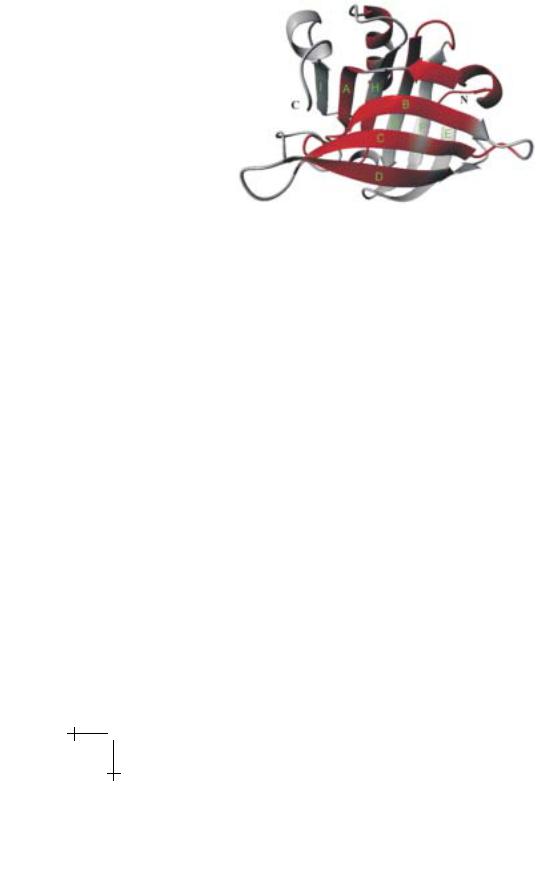
The rough energy landscape of a protein includes not only the steep free energy funnel that guides the unfolded protein into its compact native state [1, 2], but also traps of misfolded intermediates. In some cases this rough surface can lead to distinct conformations of the same protein that consist of either α-helix or β-sheet. An erroneous transition from α-helix to β-sheet structures has fatal consequences in prion and other amylogenic diseases. Since these distinct conformations are both highly compact, an important question is the size of the energy barriers and the interconversion times for α-helix to β-sheet structural changes. An excellent model system to study helix/sheet transitions is b-lactoglobulin (BLG), a major component of mammalian milk. BLG-A consists of nine antiparallel b-strands (51%) and one α-helix (7%) in its native state (Fig. 1) [3]. The high β-sheet content sharply contrasts with secondary structure predictions for the amino acid sequence that indicate a distribution of 48% helix and 13% sheet [4]. In fact, BLG has the remarkable property of refolding to 80% helical content under the influence of TFE [5, 6]. The transition occurs cooperatively between 15% and 20% TFE.
So far, protein folding has been mostly probed by UV/Vis, fluorescence and circular dichroism (CD) spectroscopy as well as NMR spectroscopy. Each one of these techniques probes di erent structural changes. UVVis and fluorescence spectroscopy monitor the interactions of a prostetic group or a fluorophore like tryptophan with its microenvironment. CD spectroscopy is mainly sensitive to helical secondary structure. NMR spectroscopy can provide residue resolved information [7, 8] but spectra of denatured states are di cult to interpret and the time resolution in real time measurements is low. Fourier-transform infrared spectroscopy on the other hand is able to clearly distinguish between all types of secondary structure [9], it is sensitive to tertiary structure [10] and capable of detecting single residue reactions on a nanosecond time scale [11, 12]. The most
412 |
Physics of Bio-Molecules and Cells |
Fig. 1. Backbone representation of β-lactoglobulin A. Regions with high helical preference are marked.
frequent approaches to initiate folding reactions in kinetic experiments have been rapid mixing techniques in either stopped-flow or continuous-flow operation mode [13]. FTIR-spectroscopy, despite its sensitivity, has only been rarely used for kinetic mixing experiments. The main obstacle has been the necessity to mix solutions in a few micron thick samples to keep the background absorption of water and guanidine low. These thin layers make it impossible to generate turbulent flow, the phenomenon utilised by macroscopic mixers to facilitate mixing [13]. Here, we overcome this problem by silicon microfabrication of a di usional IR mixer which allows microsecond mixing in thin films.
2 Technology
Silicon micromachining has great potential to establish FTIR spectroscopy as a new method for microsecond mixing experiments since silicon is transparent in the mid-infrared. When the dimensions of liquid channels are reduced to a few microns, the flow will be laminar at virtually all velocities [14]. Therefore, there are no turbulent vortices to enhance mixing. In micron dimension channels, di usion is the only way reactants can be brought together and the flow pattern has to be designed such that di u- sion length scales are kept small. It has been shown that micro scale mixing devices can decrease the characteristic mixing time from milliseconds down to 10 microseconds [14–16]. Based on the idea of Brody et al. we have designed a continuous-flow mixing chip for FTIR microscopy shown in
Lecture 5: Protein Folding on a Chip |
413 |
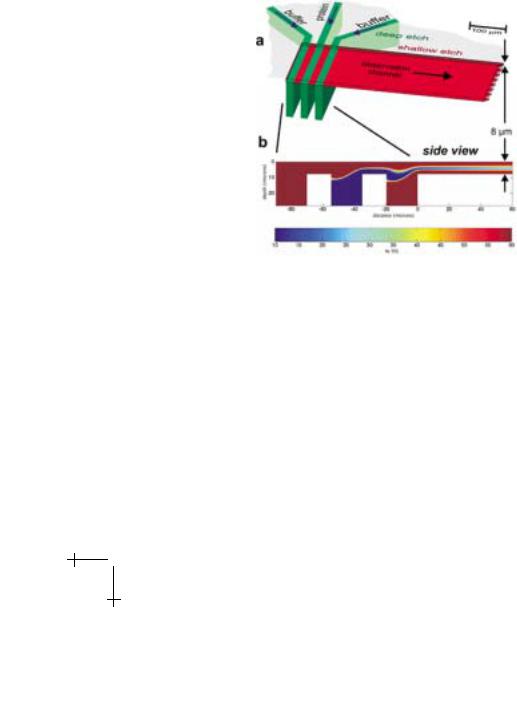
Figure 2. The protein solution in the centre and two streams of mixing bu er enter through 80 mm deep inlet channels (Fig. 2a, green) which intersect with the 8 mm deep observation channel (Fig. 2a, red). Because the three inlet channels are a factor of ten deeper than the observation channel, at the merger there is almost equal pressure over the whole width of the observation channel. Due to the viscosity determined laminar flow, no turbulence is induced when the second and third channel merge in, but a layer of the centre (protein) solution between two bu er layers over the whole width of the observation channel results. A fluid dynamics simulation was performed to verify the desired flow pattern.
Fig. 2. Design of the mixing chip. a) Top view on the chip. The 80 micron deep inlet channels are shown in green and the 8 micron deep outlet channel is shown in red. b) Two dimensional fluid dynamics simulation with false color representation of the TFE concentration. A jet of the center (protein) solution between two layers of bu er solution is formed. The TFE concentration is computed by adding the advective term to the di usion equation.
Figure 2b shows a side view of the intersection of the channels. By approximating the observation channel as “infinitely wide”, we can make a two-dimensional model of the fluid flow. At low Reynolds number, the stream function for the flow must obey the biharmonic equation. The resulting flow pattern (Fig. 2b) verifies the desired formation of a protein layer between two layers of bu er solution. Just because the protein layer is so thin, di usion of the reactant molecules from the bu er into the protein jet and thus mixing is fast. The time resolution is achieved by scanning along
414 |
Physics of Bio-Molecules and Cells |
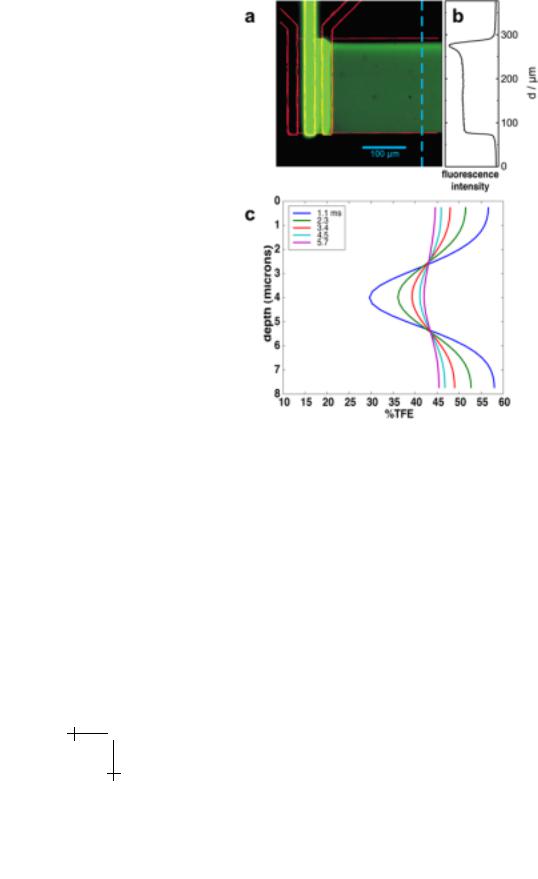
Fig. 3. Epi-fluorescence image of the flow pattern with superimposed contour. Fluorescein solution is flowed in the center channel and non-stained bu er in the side inlet channels. The fluorescence cross section b) shows a homogeneous jet over 180 microns width. The peak in intensity in the upper part results from the small flow velocity component in the direction of the in let channels. c) TFE concentration profiles through the observation channel as extracted from the Figure 2b.
the observation channel with the focussed beam of an FTIR microscope [17]. Since the protein only moves in about the centre third of the observation channel only marginal blurring of the time axis due to the parabolic flow profile occurs. The flow pattern is visualised by a fluorescein solution flowing in the centre inlet channel and bu er in the two side channels (Fig. 3a). The fluorescence cross section of the observation channel (Fig. 3b) shows

Lecture 5: Protein Folding on a Chip |
415 |
the formation of a homogeneous jet over a width of about 180 microns. In the top 20% the formation of the jet is distorted which can be explained by the velocity component in the direction of the inlet channels.
3 Experiments
To induce the refolding of BLG, a protein solution containing 10% TFE (below the refolding transition) entered the center channel and mixed with 60% TFE in the side channels. The mixing time was estimated using a numerical solution of the flow and di usion equations. The advective term is added to the di usion equation and solved for the concentration of TFE everywhere in the jet. The TFE concentration is depicted in false-colour in Figure 2b. Once the three inlet streams have combined, the TFE profile gradually relaxes to a constant level as the jet travels down the observation channel. The evolution of the TFE concentration, as a function of channel depth, is pictured in Figure 3c. At the first data point (taken at 100 microns or 1.1 ms), the TFE concentration in the middle of the channel exceeds 30% which is well above the cooperative transition threshold of 15–20%. The characteristic mixing time, extracted from the simulation is 0.4 microseconds. When the IR focus is further confined, this is the maximum time resolution.
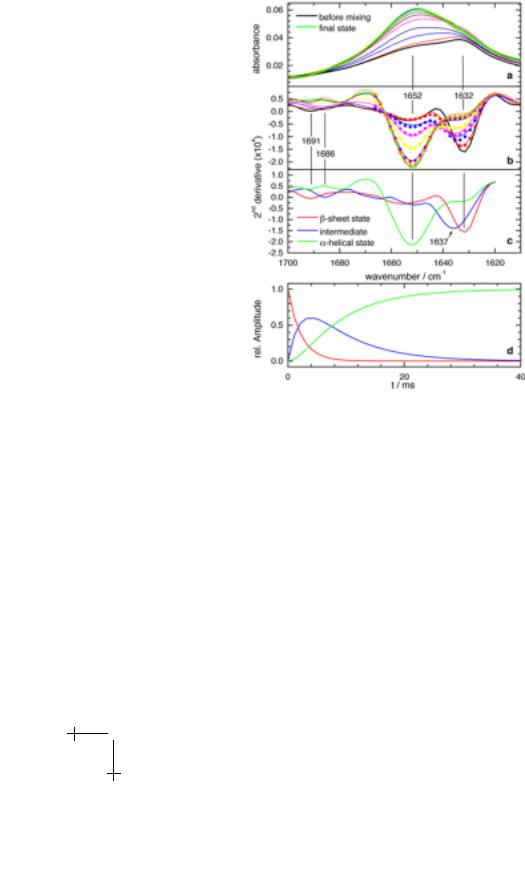
Figure 4a shows the time-resolved FTIR spectra of BLG after mixing with TFE between 1600 cm−1 and 1700 cm−1 where the amide I band (the protein backbone carbonyl groups) absorb. The amide I spectrum is sensitive to the secondary structure of the protein. In the time course of the reaction the maximum of the amide I band shifts from 1632 cm−1 to 1652 cm−1. In order to resolve the overlapping bands of secondary structure elements the second derivative spectra are calculated (Fig. 4b). Absorbance maxima correspond to negative peaks in the second derivative spectra. The initial state spectrum (black) shows bands at 1632 cm−1 (strong) and 1691 cm−1 (weak). These are characteristic of β-sheet structures [9], as expected. In the course of the transition, the signal at 1632 cm−1 decreases in favour of the more intense peak at 1652 cm−1 which is assigned to α-helices [9]. Additionally, the weak band at 1692 cm−1 first shifts to 1686 cm−1 and finally disappears. The spectrum of the final state indicates an almost complete loss of β-sheet structure, consistent with CD and NMR results [4, 18, 19]. There is no isosbestic point between the two bands at 1632 cm−1 and 1652 cm−1 in Figure 4b, revealing the population of at least one intermediate state along the conformational pathway.
The dataset was kinetically analysed by two methods, singular value decomposition (SVD) and least squares curve fitting. SVD of the spectra between 1620 cm−1 and 1700 cm−1 resulted in three linear independent
416 |
Physics of Bio-Molecules and Cells |
Fig. 4. Time-resolved FTIR spectra and kinetic analysis. a) Time-resolved absorbance spectra taken along the observation channel. Time-resolved spectra at 1.1 ms, 3.4 ms, 5.7 ms, 10.2 ms, 21.6 ms, and 103 ms. Spectrum before mixing (black line) and final state spectrum (green line). b) Second derivative spectra of a) (solid lines) and results of a three-state exponential fit (dots, plotted only up to 1670 cm−1). Line colouring same as in a). c) The three basis spectra, resulting form the fit. d) Time course of the three states as deduced by the fit.
basis spectra. Similarly, least squares fits yielded at least three spectral states necessary to model the data adequately. The kinetic analysis provided no clear preference for either an exponential, stretched exponential or exponential model which includes back reactions for the time dependence of the states. The result of the three-state fit with two simple exponential functions is shown in Figures 4b to 4d. Figure 4c depicts the three basis spectra: the β-sheet state spectrum (maximum at 1632 cm−1), the helical state spectrum (maximum at 1652 cm−1) , and the intermediate state spectrum. The
Lecture 5: Protein Folding on a Chip |
417 |
amide-I peak of the intermediate is centred at 1637 cm−1 (Fig. 4c) and the high wavenumber β-sheet peak has shifted to 1686 cm−1. These wavenumbers are within the typical range of antiparallel β-sheet structures [9]. The intermediate clearly is not unfolded which would correspond to a amide I band centred at 1645 cm−1 [20]. However, an upshift from 1632 cm−1 to 1637 cm−1 points in the direction of a more loosely packed β-sheet structure. A similar amide-I frequency is observed for the molten globule of pressure denatured RNAse A, another predominantly β-sheet protein [21].
This suggests a molten β-sheet structure of the intermediate. The frequency upshift can be explained by intruding of TFE into the hydrophobic core of the protein and weakening backbone hydrogen bonding. The structure of the kinetic intermediate di ers from the structure of the equilibrium intermediate detected by CD spectroscopy [18] which was proposed to have 53% helical and only 2% sheet content. However, in the equilibrium intermediate detected by heteronuclear NMR about half of the β-sheet structure persists [19]. The kinetic intermediate state structure deduced from our FTIR measurements resembles more the NMR intermediate.
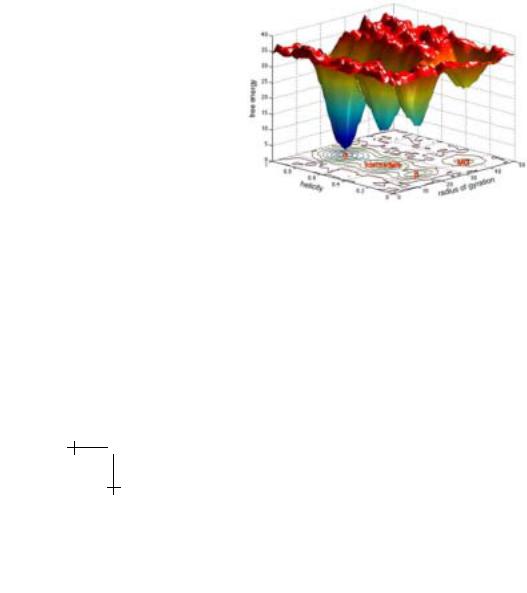
Fig. 5. A schematic of the free energy surface of β-lactoglobulin A as deduced by this work and extrapolated from other work on the local conformational distribution of barrier heights and radii of gyration of protein structures of similar molecular weight.
The intermediate state is formed with a time constant of (2.2 ± 0.1) ms and disappears with a time constant of (7.7 ± 0.1) ms. The β to α transition of BLG is is more than three orders of magnitude faster than the unfolding in 4 M guanidine hydrochloride or the refolding to the native state [22, 23]. This is surprising because the change in free energy from the native (β- sheet) state to the (helical) TFE-state almost equals the free energy change

418 |
Physics of Bio-Molecules and Cells |
from the guanidine denatured state [24]. Hence, similar rates would be expected [25]. However, since the β to α transition proceeds via a compact state, in contrast to the unfolding, the transition might be performed mach faster from a phase space argument [26]. The question thus arises, how does TFE reshape the energy landscape to facilitate an interconversion between compact structures without unfolding the protein? The well known equilibrium e ect of TFE is the weakening of hydrophobic interaction in the core of the protein and the enhancement helical structures [27]. Additionally, TFE forms hydrophobic clusters in water, providing a hydrophobic micro environment [28]. This facilitates a movement of hydrophobic groups from the hydrophobic inside to the outside of the protein. By providing a hydrophobic microenvironment and by favouring helical structures, the protein seems to be able to rearrange within a rather compact state with low activation barriers.
4 Conclusions
Our results with this new technology indicate that specific changes in the (micro) environment can make the transition between compact structures much more likely because the protein does not have to unfold. From this finding it may be postulated that a hydrophobic microenvironment is generally a crucial factor in helix/sheet transitions. It is known that chaperones like GroEL expose hydrophobic side chains in their cavity to allow for rearrangement of misfolded structures [30]. One may speculate further that a yet unknown microenvironment might be the missing link to explain the formation of prion β-sheet structure.
References
[1]J.N. Onuchic, Z. Luthey-Schulten and P.G. Wolynes, Ann. Rev. Phys. Chem. 48 (1997) 545-600.
[2]A.G. Ladurner, L.S. Itzhaki, V. Daggett and A.R. Fersht, Proc. Natl. Acad. Sci. USA 95 (1998) 8473-8478.
[3]S. Brownlow et al., Structure 5 (1997) 481-495.
[4]K. Shiraki, K. Nishikawa and Y. Goto, J. Mol. Biol. 245 (1995) 180-94.
[5]D. Hamada, Y. Kuroda, T. Tanaka and Y. Goto, J. Mol. Biol. 254 (1995) 737-46.
[6]D. Hamada, S. Segawa and Y. Goto, Nature Struct. Biol. 3 (1996) 868-73.
[7]A.K. Bhuyan and J.B. Udgaonkar, Curr. Sci. 77 (1999) 942-950.
[8]H.J. Dyson and P.E. Wright, Ann. Rev. Phys. Chem. 47 (1996) 369-395.
[9]J.L. Arrondo, A. Muga, J. Castresana and F.M. Goni, Progr. Biophys. Mol. Biol. 59 (1993) 23-56.
[10]D. Reinstadler, H. Fabian, J. Backmann and D. Naumann, Biochemistry 35 (1996) 15822-15830.

Lecture 5: Protein Folding on a Chip |
419 |
[11]K. Gerwert, G. Souvignier and B. Hess, Proc. Natl. Acad. Sci. USA 87 (1990) 9774-9778.
[12]K. Gerwert, Curr. Opin. Struct. Biol. 3 (1993) 769-773.
[13]H. Roder and M.C.R. Shastry, Curr. Opin. Struct. Biol. 9 (1999) 620-626.
[14]J.P. Brody, P. Yager, R.E. Goldstein and R.H. Austin, Biophys. J. 71 (1996) 34303441.
[15]J.B. Knight, A. Vishwanath, J.P. Brody and R.H. Austin, Phys. Rev. Lett. 80 (1998) 3863-3866.
[16]L. Pollack et al., Proc. Natl. Acad. Sci. USA 96 (1999) 10115-10117.
[17]R. Rammelsberg, S. Boulas, H. Chorongiewski and K. Gerwert, Vibr. Spectr. 19 (1999) 143-149.
[18]J. Mendieta, H. Folque and R. Tauler, Biophys. J. 76 (1999) 451-457.
[19]K. Kuwata, M. Hoshino, S. Era, C.A. Batt and Y. Goto, NMR. J. Mol. Biol. 283 (1998) 731-9.
[20]A. Troullier, D. Reinstadler, Y. Dupont, D. Naumann and V. Forge, Nat. Struct. Biol. 7 (2000) 78-86.
[21]N. Takeda, M. Kato and Y. Taniguchi, Biochemistry 34 (1995) 5980-7.
[22]M. Arai et al., J. Mol. Biol. 275 (1998) 149-162.
[23]K. Kuwajima, H. Yamaya and S. Sugai, J. Mol. Biol. 264 (1996) 806-822.
[24]M. Buck, Quart. Rev. Biophys. 31 (1998) 297-355.
[25]K.W. Plaxco, K.T. Simons, I. Ruczinski and D. Baker, Biochemistry 39 (2000) 11177-11183.
[26]H. Lu, M. Buck, S.E. Radford and C.M. Dobson, J. Mol. Biol. 265 (1997) 112-7.
[27]D. Hamada et al., Nature Struct. Biol. 7 (2000) 58-61.
[28]D.P. Hong, M. Hoshino, R. Kuboi and Y. Goto, J. Am. Chem. Soc. 121 (1999) 8427-8433.
[29]L.M. Miller, C.S. Carlson, G.L. Carr and M.R. Chance, Cell. Mol. Biol. 44 (1998) 117-127.
[30]A. Horovitz, Curr. Opin. Struct. Biol. 8 (1998) 93-100.
[31]K.R. Harris, P.J. Newitt and Z.J. Derlacki, J. Chem. Soc. Faraday Trans. 94 (1998) 1963-1970.
COURSE 9
SOME PHYSICAL PROBLEMS IN BIOINFORMATICS
E.D. SIGGIA
Center for Studies in Physics and Biology,
Rockefeller University,
1230 York Avenue, New York,
NY 10021, U.S.A.