

Multidimensional Chromatography
.pdf390 |
Multidimensional Chromatography |
Figure 14.11 Typical chromatogram obtained by using the aromatics analyser system. Peak identification is as follows: 1, non-aromatics; 2, benzene; IS, internal standard (MEK); 3, ethylbenzene; 4, p-and m-xylenes.
A variety of multidimensional GC systems have been developed for the complete characterization of gasoline and naphtha-type samples. The limit of these multidimensional systems has been the introduction of the with PIONA-analyser in 1971 (12), with PIONA standing for Paraffins – Iso-paraffins – Olefins – Naph-thenes
– Aromatics. This system has exploited the unique separation of naphthenes and paraffins as a function of carbon number on a column packed with zeolites of a very specific pore size (13 molecular sieves) (13). In later years, the technique has been expanded to samples having boiling points up to 270 °C (14) and implemented in a commercial instrument (15), which is still in use in the majority of the refinery laboratories for the compositional analyses of gasolines and naphthas. Other investigators have developed comparable systems with capillary columns (16 – 22), some of which incorporated a mass spectrometer, but these were never commercialized. More recently, with the introduction of oxygenates in gasolines, all of these analyser systems have experienced the shortcoming that they are not able to separate the oxygenates from the hydrocarbon matrix. A new multi-column system has therefore been developed, i.e. the Reformulyser, which overcomes this shortcoming. Figure 14.12 depicts a schematic diagram of the Reformulyser system, with a typical resulting chromatogram obtained from this set-up being shown in Figure 14.13.

Multidimensional Chromatographic Applications in the Oil Industry |
391 |
Figure 14.12 Schematic diagram of the Reformulyser system: Inj, split injector; C1, polar capillary column; C2, packed column to retain the alcohols; C3, packed Porapak column for the separation of the oxygenates; C4, non-polar capillary column; C5, packed 13X column; A/E trap, Tenax trap to retain the aromatics; Olf. trap, trap to retain the olefins; Pt, olefins hydrogenator; A trap, trap to retain the n-alkanes; FID, flame-ionization detector.
14.3.3 A DUAL SFC SYSTEM FOR THE ANALYSIS OF TOTAL OLEFINS IN GASOLINES
A different approach for the analysis of the total olefin content of a gasoline, using supercritical carbon dioxide as the carrier, is given in a proposed ASTM method. This utilizes the switching of two packed supercritical fluid chromatography (SFC) columns. The first column is a high-surface-area silica column, capable of separating alkanes and olefins from aromatics, while the second column is a silver-loaded silica column or a cation-exchange column in the silver form. A schematic diagram of such a system is presented in Figure 14.14. In this technique, the sample is injected onto the silica column, which is in series with the silver-loaded column. After elution of the saturates, the aromatics remain on the silica column and the olefins have moved to the silver-loaded column, where they are trapped. The silica column is then backflushed to elute the aromatics to the detector. After switching the silica column out of the flowpath, the silver-loaded column is back-flushed to elute the olefins to the detector. A typical chromatogram obtained from such a system is presented in Figure 14.15.

392 |
Multidimensional Chromatography |
Figure 14.13 Typical chromatogram obtained by using the Reformulyser system. Peak identification is as follows: 1, P3; 2, P4; 3, N5; 4, P5; 5, N6; 6, P6; 7, N7; 8, P7; 9, N8; 10, P8; 11, P9; 12, P10; 13, MTBE; 14, OP4; 15, ON5; 16, OP5; 17, ON6; 18, OP6; 19, ON7; 20, OP7; 21, OP8; 22, P8; 23, A8; 24, A6; 25, A7; 30, A9/10; 31, A10/11; 32, A8 (where P is alkane, N is cycloalkane, MTBE is methyl tert-butyl ether, OP is alkene, ON is cycloalkene and A is aromatic).
14.4MIDDLE DISTILLATES
Middle distillates are defined as those fractions having a boiling range between 150 °C and 370 °C. Various products fall within this range, e.g. kerosine, jet fuel, diesel fuel, light gasoil and heavy gasoil. Diesel fuels in particular are subjected to several environmental regulations. Because the aromatics present in diesel fuel promote the emission of particulates, and legislative measures restrict this emission, refiners thus require a rapid and sensitive method for monitoring these aromatics. In light of the year-2000 and (projected) year-2005 legislations, the European fuel market is very interested in so-called city-diesel. The latter is a petroleum-based, lower-emission diesel fuel developed in Sweden. This fuel is available in many

Multidimensional Chromatographic Applications in the Oil Industry |
393 |
Figure 14.14 Schematic diagram of the SFC olefins analyser system: C1, high-surface-area silica column; C2, silver-loaded silica column; V1 and V2, six-port valves; FID, flame-ionisa- tion detector; UV, ultraviolet monitor detector.
Figure 14.15 Typical SFC chromatogram of total olefins in gasoline: 1, saturates; 2, aromatics; 3, olefins; t(L), time of loading sample on to columns and eluting saturates; t(AR), time of eluting aromatics; t(C), time of eluting remaining saturates from olefin trap; t(BF), time of eluting olefins by back-flush.
394 |
Multidimensional Chromatography |
European countries, including the UK, and covers about 5% of the total European diesel market. It contains less than 5 vol%. of mono-ring aromatics and less than 0.1 vol%. of diand higher-ring aromatics. Furthermore it is low in sulfur. Both LC and SFC methods have been developed for the rapid analysis of aromatics in diesel fuel.
14.4.1 AN LC – SFC SYSTEM FOR THE ANALYSIS OF TOTAL AROMATICS IN DIESEL FUEL
Different approaches utilizing multidimensional LC or SFC systems have been reported for the analysis of middle distillates in diesel fuel. A method, based on the LC separation of paraffins and naphthenes by means of a micro-particulate, organic gel column has been described (23, 24). The complete system contained up to four different LC columns, a number of column-switching valves and a dielectric constant detector. However, the LC column for the separation of paraffins and naphthenes, which is an essential part of the system, is no longer commercially available.
In Figure 14.16, the chromatograms of a normal-phase LC analysis, using a straight-phase silica column with back-flush are shown. The same method, using carbon dioxide as the mobile phase and a cyanopropyl-modified silica column for the SFC stage, is employed for the second separation. When the column is not backflushed, a clear distinction can be made between the mono-ring and higher-ring aromatics.
14.4.2 ON-LINE COUPLING OF LC AND GC FOR HYDROCARBON CHARACTERIZATION
A more sophisticated method, giving a much more detailed characterization, involves the on-line coupling of LC and GC (LC – GC). Analysis schemes for middle distillates (kerosine, diesel and jet fuels) combining LC and GC have been reported by various authors (25 – 31). However, only Davies et al. (25) and Munari et al. (27) have reported on the required automatic transfer of all of the individual separated fractions from the LC unit the GC system. Davies used the loop-type interface and Munari the on-column interface. Only Beens and Tijssen report a full quantitative characterzation by means of LC-GC (31).
The system utilized is depicted schematically in Figure 14.17. In this set-up the sample is injected onto the cyanopropyl-derivatized LC column. This column separates hydrocarbons according to the number of -electrons in the molecules, which is more or less according to the number of fused aromatic rings. The outlet of the column is monitored by the UV detector for the start of eluting aromatics, and is connected to the GC system by means of valve 1 (V1) through a narrow capillary into the on-column injector. The effluent of the column – the mobile phase, n-heptane, together with the first eluting fraction, the saturates – flows directly into the GC
Multidimensional Chromatographic Applications in the Oil Industry |
395 |
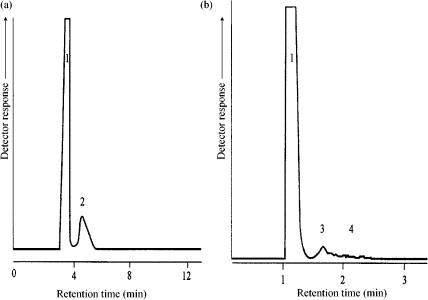
Figure 14.16 Typical chromatograms of LC (a) and SFC (b) analysis of aromatics in diesel fuel. Peak identification is as follows: 1, total saturates; 2, total aromatics; 3, mono-aromatics; 4, higher-ring aromatics.
retention gap. Here, the heptane will start the ‘solvent-effect’, thus focusing the saturates into a narrow band. The heptane on the front of the plug will evaporate and leave the system through the SVE valve. As soon as the saturates have completely left the LC column, i.e. at the start of the mono-aromatics fraction, the LC pump is stopped. The remaining fractions in the column will not broaden, since the diffusion coefficients in the liquid phase are very low. Programming the GC oven will then separate the focused fraction in the GC system. After cooling down the GC oven, the whole process subsequently starts again for the mono-aromatics, di-aromatics, triaromatics, etc. Clear separated chromatograms of all the fractions can be obtained, as can be seen in Figure 14.18, for the mono-aromatics, and in Figure 14.19, for the di-aromatics. No overlap from one fraction into the other is detectable. This means that not only a quantitative group-type separation can be provided, but also that within the various groups a clear carbon distribution can be obtained.
14.4.3 ON-LINE COUPLED LC – GC-FID-SCD FOR SULFUR COMPOUND CHARACTERIZATION
Since the majority of middle distillates are used as a fuel, combustion of these products will contribute to SO2/SO3 air pollution and acid rain. However, in catalytic processes of petroleum fractions sulfur levels are also important. For instance, quantities

396 |
Multidimensional Chromatography |
Figure 14.17 Schematic diagram of the on-line coupled LC – GC system: V1, valve for switching the LC column outlet to the GC injector; V2, valve for switching the LC column to back-flush mode; V3, LC injection valve; RI, refractive index monitor detector; UV, ultraviolet monitor detector; FID, flame-ionization detector.
of as little as 1 ppm sulfur in feedstocks may have a detrimental effect on modern bimetallic catalysts. For these reasons, petroleum fractions are often desulfurized.
Although desulfurization is a process, which has been in use in the oil industry for many years, renewed research has recently been started, aimed at improving the efficiency of the process. Environmental pressure and legislation to further reduce sulfur levels in the various fuels has forced process development to place an increased emphasis on hydrodesulfurization (HDS). For a clear comprehension of the process kinetics involved in HDS, a detailed analyses of all the organosulfur compounds clarifying the desulfurization chemistry is a prerequisite. The reactivities of the sulfur-containing structures present in middle distillates decrease sharply in the sequence thiols sulfides thiophenes benzothiophenes dibenzothiophenes (32). However, in addition, within the various families the reactivities of the substituted species are different.
It is for this reason that not only the various sulfur-containing groups present, but also the monoand dimethyl-substituted species of benzothiophenes and dibenzothiophenes have to be separated and quantified individually. As the number of sulfur compounds present in (heavy) middle distillate fractions may easily exceed 10 000 species, a single high resolution GC capillary column is unable to perform such a separation.

Multidimensional Chromatographic Applications in the Oil Industry |
397 |
Figure 14.18 Typical GC chromatogram of the separated mono-aromatics fraction of a middle distillate sample; the numbers indicate the retention time of the various n-alkanes.
The system described in the previous section has been extended with a sulfur chemiluminescence detector (SCD) for the detection of sulfur compounds (32). The separated fractions were thiols sulfides thiophenes (as one group), benzothiophenes, dibenzothiophenes and benzonaphtho-thiophenes. These four groups have been subsequently injected on-line into and separated by the GC unit. Again, no overlap between these groups has been detected, as can be seen from Figure 14.20, in which the total sulfur compounds are shown and from Figure 14.21 in which the separated dibenzothiophenes fraction is presented. The lower limit of detection of this method proved to be 1 ppm (mg kg 1) sulfur per compound.
14.4.4 COMPREHENSIVE TWO-DIMENSIONAL GAS CHROMATOGRAPHY (GC GC)
When John Phillips, in 1991, presented the practical possibility of acquiring a real comprehensive two-dimensional gas chromatographic separation (33), the analytical chemists in the oil industry were quick to pounce upon this technique. Venkatramani and Phillips (34) subsequently indicated that GC GC is a very powerful technique, which offers a very high peak capacity, and is therefore eminently suitable for analysing complex oil samples. These authors were able to count over 10 000 peaks in a GC GC chromatogram of a kerosine. Blomberg, Beens and co-workers

398 |
Multidimensional Chromatography |
Figure 14.19 Typical GC chromatogram of the separated di-aromatics fraction of a middle distillate sample: Peak identification is as follows: 1, naphthalene; 2, 2-methylnaphthalene; 3, 1-methylnaphthalene; 4, biphenyl; 5, C2-naphthalenes; 6, C3-naphthalenes; 7, C4-naph- thalenes; 8, C5 -naphthalenes; 9, benzothiophene; 10, methylbenzothiophenes; 11, C2-ben- zothiophenes. Note the clean baseline between naphthalene and the methylnaphthalenes, which means that no overlap with the previous (mono-aromatics) fraction has occurred.
(35, 36), who presented a number of separations of different oil fractions by using GC GC, later confirmed this. The latter authors also demonstrated (36) that the quantitative results produced by GC GC equipped with a flame-ionization detector are at least of the same quality, if not better, than those obtained with ‘conventional’ one-dimensional capillary GC.
In GC GC, a sample is separated into a large number of small fractions and each of these is subsequently quantitatively transferred to a secondary column to be further separated. The second separation is very much faster than the first separation, so that the fractions can be narrow and the separation obtained on the first column can be maintained. The collection of the fractions from the first column is achieved by focusing, rather than by valve switching, and the entire sample reaches the detector. The consequence is a chromatogram, with a two-dimensional plane, rather than a one-dimensional axis, as the time domain. One dimension of this plane represents the retention time on the first column, while the second dimension represents the retention time on the second column. Every separated peak can be presented as a

Multidimensional Chromatographic Applications in the Oil Industry |
399 |
Figure 14.20 GC chromatogram of the total sulfur compounds in a heavy gas oil sample.
spot in a contour plot. The very many components present in oil fractions give rise to bands spread across the plane. As a result of the separation mechanism of GC GC, the resulting chromatograms show a great deal of structure, which can be used to assign the (components in) different bands with high analytical certainty.
An example of such a separation, showing the different groups in separate bands along the plane, is presented in Figure 14.22. The saturates are present in a band which crosses over from the right of the contour plot to the left. This band, upon closer inspection at the first retention time (above 30 min), appears to consists of two bands; i.e. the alkanes and the cycloalkanes. Each individual spot represents a component of the original mixture. When integrated, the data provide a true quantitative result. Although only a few spots can be designated to individual compounds, the rest of the spots can be identified as being members of a group. By including the retention of the first dimension (non-polar column), this also provides an indication of the boiling points and/or carbon numbers.