

History of Modern Genetics in Germany
.pdfThree-Phase Oxygen Absorption and Its Effect on Fermentation |
53 |
ttime, s
TD |
differential surface element at the gas-liquid interface, m2 |
Vreactor volume, m3
xspace co-ordinate perpendicular to the gas-liquid interface, m
Xbiomass concentration, kg m–3
yspace co-ordinate, m
YX/S |
yield coefficient for S Æ X, kg kg–1 |
YX/O |
yield coefficient for O Æ X, kg kg–1 |
zspace co-ordinate, m
bo |
physical mass transfer coefficient in the presence of droplets, m s–1 |
bo,ave |
averaged value of bo over the spherical interface using Eq. 23, m s–1 |
bmass transfer coefficient with chemical reaction in presence of par-
|
ticles, m s–1 |
bave |
averaged value of b over spherical interface obtained by Eq. 23, m s–1 |
b(R*) mass transfer coefficient at a TD surface element, m s–1
dpenetration depth of oxygen or thickness of the boundary layer, m
d0 |
distance of the first particle from the gas-liquid interface, m |
dp |
distance between two spheres, m |
edispersed phase holdup
kthe change of diffusion distance due to curvature, m
ldimensionless parameter given according to Eq. 13
lp |
dimensionless parameter according to Eqs. 15–18., - |
mspecific growth rate, h–1
ggas
Lliquid
ddispersed phase
in inlet
1 Introduction
In industrial fermentation processes, increases in productivity are frequently limited by the transport of a substrate or byproduct. Oxygen is a sparingly soluble substrate whose transport can be a critical factor in aerobic cultures.As long as the oxygen transfer rate to the broth exceeds the rate of oxygen utilization by the cells, cell growth continues at an exponential rate when other nutrients are not limiting.At a certain critical cell concentration,oxygen can no longer be supplied to the broth fast enough to meet the oxygen demand. Under these conditions, oxygen becomes the limiting nutrient for cell growth. This fact often results in reduced growth and culture productivity [1–3].
Various techniques used in conventional bioreactors to improve the rate of oxygen transfer from the gas phase include increasing the agitation or aeration rates, modifying the vessel design [2, 4, 5] or raising the partial pressure of oxygen in the gas phase [6, 7]. For a specific fermenter operating pressure, these latter remedies can provide up to a five-fold increase in the concentration driving force. However, the high levels of mixing often create disadvantageous environments for cells sensitive to mechanical stress.
54 |
E. Nagy |
Non-conventional methods reported for improving oxygen supply include oxygen generation in situ with hydrogen peroxide/catalase system [8, 9] or adding hydrogen peroxide to the medium and using an organism with a high natural catalase activity [10].A biological approach to in situ oxygen generation would be to co-immobilize oxygen-consuming organisms with oxygen-produc- ing organisms such as the alga Chlorella pyrenoidosa [11]. Dihydroxiacetone productivity was enhanced 4–5-fold compared with a pure culture. However, the oxygen production is limited and co-immobilization may cause inhibition or competition for the substrate.
Another way of increasing the oxygen supply would be to modify the medium so that it could carry more oxygen. This new aeration strategy consists of the addition to the growth medium of a compound or a second, water-immiscible phase in which oxygen has a high solubility [1, 12–20]. Examples of this phase include hydrocarbons [12, 17–18, 23, 26], hemoglobin [15], perfluorocarbons [1, 13,14,19,25],soybean oil [20],olive oil [24] and silicone oils [16,21].The organic phase is usually simply emulsified in the fermentation broth by mechanical agitation (or ultrasonic treatment) and stabilized with surfactants. Depending on the mass transfer kinetic parameters – diffusivity,solubility,surface renewal frequency, droplet size, dispersed phase hold-up, etc. – the oxygen uptake rate can substantially be increased: the enhancements were 3.5-fold using n-dodecane [17], 3–4-fold using perfluorocarbon [1] and 4–5-fold using silicone oil [21]. This supplementary oxygen supply can increase the oxygen concentration far above its critical value in the fermentation broth and, as a consequence, it can improve the bioreactor productivity. However, the second dispersed phase can cause additional effects, for example, toxicity, which must not be left out of consideration.
The purpose of the present paper is to review the results of the oxygen absorption enhancement in the presence of a second, dispersed organic phase and to analyze the effect of enhancement on the bulk oxygen concentration, and its effect on fermentation processes.
2
Oxygen Absorption Rate – The Effect of a Dispersed Organic Phase
The presence of fine solid particles or a finely dispersed second liquid phase in the continuous absorbent phase can have a very strong effect on the mass transfer rate between the gas and the continuous phases. The mass transport into the solid particles or liquid drops can essentially alter the concentration gradient and, consequently, the absorption rate [27–36]. The qualitative explanation of this phenomenon is that the particle absorbs oxygen in the oxygen-rich hydrodynamic mass transfer film, after which, desorption of oxygen takes place in the oxygen-poor bulk of the liquid.
In order to estimate the real effect of a dispersed organic phase on the productivity of fermentation, the oxygen absorption rate has to be defined. Knowing its mathematical expression, the rate equation can then be incorporated into the differential mass balance equations of fermentation and, after solving these equations, the concentration of components in a fermentation
Three-Phase Oxygen Absorption and Its Effect on Fermentation |
55 |
broth can be predicted. For describing the phenomenon of gas absorption in the presence of dispersed phase particles in the mass transfer zone, several approximation models have been developed. The first models developed were the homogeneous models using the penetration theory [37–39] or the film-penetra- tion theory [40].The most important assumption of these models is that the particle size of the discontinuous phase must be much smaller than the so-called liquid film thickness at the gas-liquid interface. For gas absorption in aqueous media in an intensely agitated contactor, a typical value for the „film“ thickness is ª10–25 mm. This is the case when a micellar microphase is the dispersed phase [38]. This assumption can also be fulfilled when solid particles are the discontinuous phase [27, 30–34]. However, the droplet size of a simple emulsified phase, that is the case in fermentation when a simply dispersed organic phase is used,is mostly larger than 10–15 mm,thus the assumption for the homogeneous model is no longer fulfilled. Namely, in this case, the particle size can be somewhat less than, equal to, or even larger than the film thickness. For that particle size range (dp ª >5–7 mm), the mass transport at the gas-liquid interface can only be described by heterogeneous models.
2.1
Heterogeneous Mass Transfer Models
The essential difference between the homogeneous model and the heterogeneous one is that the latter model takes into account the fact that the diffusion of the absorbed component alternately occurs through continuousand dispersed phases in the liquid boundary layer at the gas-liquid interface. The mass transport through this heterogeneous phase is a nonlinear process, one can get explicit mathematical expression for the absorption rate only after its simplification.
Pioneering work in developing heterogeneous, 3-dimensional models was done by Holstvoogd et al. [30] and Karve and Juvekar [41]. Both developed steady-state models for the description of gas absorption in slurry systems with fast, irreversible chemical reaction at the solid surface. These models are, however, not very suitable for absorption in liquid-liquid systems because they do not allow for diffusion through the dispersed phase. Recently Brilman [42] and Brilman et al.[43] developed a one-dimensional instationary,multiparticle mass transfer model for gas absorption in multiphase systems. The one-dimensional model takes into account the diffusion perpendicular to the gas-liquid interface. With this model the influence of several system parameters was studied. It was found that only those particles located close to the gas-liquid interface determine the mass transfer rate. For these particles the distance of the first particle to the gas-liquid interface and the particle capacity turned out to be the most important parameters. Lin et al. [44] proposed a new axisymmetrical two-di- mensional heterogeneous mass transfer model. The model accounts for droplet–droplet and droplet–film interaction. The finite-difference technique was used to solve the model equations. The effects of dispersed holdup, droplet size, partition coefficient and chemical reactions on mass transfer enhancement have been discussed.Very recently, Brilman et al. [54] published simulation data
56 |
E. Nagy |
using both twoand three-dimensional mass transfer models. They investigated the concentration distribution inside and around the particles.It was also shown how the particles alter the enhancement of the neighboring particles using different configurations.
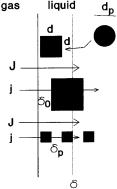
The non-linear models above have numerical solutions only. In order to get an analytical solution to this problem, the mass transport process must be simplified. Unsteady, one-dimensional, heterogeneous, one-particle models (only one particle is located in the diffusion path,perpendicular to the interface,in the boundary layer at the gas-liquid interface) were developed by Junker et al. [45] and Nagy [46]. Junker et al. [45] studied the oxygen transfer rate in aqueous/perfluorocarbon fermentation solutions and suggested a semi-infinite composite model for the case when the droplet size is larger than the laminar boundary layer thickness. For geometric convenience, the spherical, uniform size droplets are modeled as cubic ones of identical volume, thus d = dp(p/6)1/3 (Fig. 1). The boundary layer at the gas-liquid interface was assumed to consist of both the continuous and discontinuous phases. In regions were the droplets are located in the boundary layer, oxygen passes first from the gas phase to the continuous phase and thereafter through the discontinuous phase. The one-dimensional composite model using the penetration theory can be regarded as a first approach to getting an analytical solution for the enhancement, where the particle size is larger than the thickness of the boundary layer. Nagy [46] developed a more general, one-particle, heterogeneous model that can be used for the whole particles size range, where the homogeneous model is no longer valid (i.e. when the particle size is somewhat less than or equal to d, or even when dp > d). The mass transfer may be accompanied by a zeroor first-order chemical reaction in both the continuous and the dispersed liquid phases.
2.1.1
One Cubic Particle in the Diffusion Path
Figure 1 illustrates the physical mass transfer model for this situation (see the upper cubic particle where d<d. There are two parts of the gas-liquid interface:
Fig. 1. Physical model of the gas-liquid boundary layer with cubic particles
Three-Phase Oxygen Absorption and Its Effect on Fermentation |
57 |
heterogeneousand the homogeneous parts. In the former case the absorbed component diffuses through a particle into the bulk phase. This heterogeneous part of the boundary layer consists of three segments, namely, two continuous phase segments (segments between 0 and d0 as well between d0+d and the inner edge of the boundary layer, that is d in Fig. 1) and a dispersed phase one, i.e. distance between d0 and d. The differential mass balance equations have to be given for every three segment in order to get the absorption rate.
The following assumptions were made for modeling the mass transport:
–the diffusion path is perpendicular to the gas-liquid interface;
–the particles are similar in size, and their distribution in the bulk phase is regular with respect to spacing and arrangement; the distance between them is the same in each space variable and this can be calculated from their size and dispersed volume fraction e, using Eq. 1.
1 |
– 1 |
|
dp = d e51/3 |
(1) |
–the distance of the particle from the interface in the x-direction, d0 -this space coordinate is perpendicular to the gas-liquid interface-, can, in principle, be varied between 0 and dp;
–the surface renewal theory is used to describe the mass transport;
–the absorption rate for the homogeneous part of the interface, J – where there is no particle in the diffusion path (see Fig. 1) – can be given by the well known mass transfer theories [60];
–the mass transport can be accompanied by a zeroor first-order chemical reactions in the continuous phase.
The set of differential mass balance equations for the heterogeneous part of the boundary layer can be given by Eq. 2 and 3 [46]:
For the continuous phase, i.e. for 0 £ x £ d0 and for d0 + d £ x < •
D ∂2O |
– Q = ∂O |
(2) |
7∂x2 |
6∂t |
|
For the dispersed phase, i.e. for d0 £ x £ d0 + d:
Dd ∂2Od |
= ∂Od |
(3) |
9∂x2 |
7∂t |
|
The initial and boundary conditions at the gas liquid interface (x = 0), at the liq- uid-liquid interfaces (x = d0 and x = d0 + d) and x Æ • are the following:
if t = 0 |
|
x > 0 |
then O = OL |
if t > 0 |
|
x = 0 |
then O = O* |
if t > 0 x = d0 and |
x = d0 + d |
then Od = HO |
|
if t = 0 |
x = d0 and x = d0 + d |
then D = ∂O = Dd |
|
|
x Æ • |
|
6∂x |
if t > 0 |
|
then O = OL |
|
(4)
∂Od
7∂x
58 |
E. Nagy |
The set of differential Eq. 2 and 3 can be solved analytically by means of Laplace transform in the cases of a zeroand first-order chemical reactions. The timeaverage value of the mass transfer rate, j, can be obtained by Eq. 5 [47]:
∞ |
j(t) s exp (– st) dt = – Ds dO3 |
|
j = Ú |
(5) |
|
0 |
6dx |
x = 0 |
Knowing the absorption rate for the heterogeneousand the homogeneous part of the interface, the specific absorption rate related to the total interface can be expressed as follows:
Jhet = je2/3 + J (1 – e2/3) |
(6) |
The enhancement of the absorption, related the absorption rate to that obtained without dispersed phase, can then be obtained as follows:
E = Jhet = |
j e2/3 + (1 – e2/3) |
(7) |
6J |
3J |
|
The J value denotes the absorption rate without the dispersed phase where the mass transfer rate can be accompanied by zeroor first-order chemical reactions in the continuous phase. These are well-known equations: J = ko (O* + M2 – OL) and J = ko (1 + M2)1/2 (O* – OL/(1 + M2)) for zeroand first-order reactions, respectively [60].
2.1.1.1
Zero-Order Chemical Reaction (Q = k0)
Substituting the reaction rate, Q, into Eq. 2, the general solution of the Laplace transformed concentration can be given for each differential equation as follows:
lx |
lx |
|
|
O3 = Fi exp 5d0 |
+ Fi + 1 exp 5d0 |
(8) |
The parameter values Fi and Fi + 1 (i denotes ith differential equation from the above three differential equations; altogether we have 6 parameter) can be obtained by replacing the initial and boundary conditions (Eq. 4) in these equations. The absorption rate for the composite medium can be given by Eq. 9 [46]:
j = b° (O* – OL + O*M2 1 – T )
where
|
H |
+ tanh sd + |
H |
H |
|
tanh s0 7D |
7D 1 + 7D tanh sd |
||
b° = k° |
÷4r |
|
÷4r |
÷4r |
000000002H H |
||||
|
tanh sd + 7D |
1 + tanh s0 |
+ 7D |
tanh s0 tanh sd |
|
÷4r |
|
÷4r |
|
(9)
(10)
Three-Phase Oxygen Absorption and Its Effect on Fermentation |
|
|
|
|
59 |
||||
and |
|
H |
|
|
1 |
|
|
|
|
|
|
|
|
|
|
|
|||
|
|
7D tanh sd + 1 – |
02cosh s |
d |
|
||||
T = |
|
÷4r |
|
|
|
|
|
(11) |
|
0000000007H H H |
|
||||||||
cosh s0 |
tanh s0 7D + tanh sd |
+ |
7D |
1 + 7D tanh sd |
|
||||
|
|
÷4r |
|
|
÷4r |
|
|
÷4r |
|
The dimensionless parameters in these equations are: |
|
|
|
||||||
sd |
2 |
2 |
7k0D |
|
D |
|
|
||
|
sd 0 |
7O* |
|
|
|
||||
sd = 6D |
; s0 = 6D ; M = |
k° |
; Dr = |
D |
d |
|
|
||
d |
6 |
65 |
|
|
|
|
|||
6 |
5 |
|
|
||||||
2.1.1.2
First-Order Chemical Reaction (Q = k1O)
Substituting the reaction rate,Q,into Eq. 2 and after Laplace transformation,the equations obtained can be solved again by standard methods. The mass transfer rate for the heterogeneous part of the interface can be given as follows:
OL |
|
|
j = b O* – 021 + M2 |
|
|
where |
|
|
b = k° ÷921 + M2 |
tanhl p + tanh sd + p 1 + p tanh sd |
|
tanhsd + p 1 + tanh l + p tanh l tanh sd |
||
|
0000008 |
|
with the following dimensionless parameters: |
|
|
2 |
H |
÷7k1D |
l = s0 ÷921 + M |
; p = 003D (1 + M2) ; M = |
92k° |
|
÷00r |
|
(12)
(13)
The mass transfer rates for the case when d > d can easily be obtained from Eqs.9 or 12 (see [48]). Using the surface renewal theory this case is not relevant because the boundary layer thickness is here considered to be infinite.
2.1.2
Number of Cubic Particles in the Diffusion Path
Brilman et al. [42] and Lin et al. [44] using a numerical method, Nagy [48] by using an analytical method, investigated the effect of the second, third, etc. particles (perpendicular to the gas-liquid interface) on the absorption rate. They obtained that, in most cases, the first particle determines the absorption rate. However, in special cases, the effect of these particles can also be important. Nagy solved the mass transfer problem analytically for the number of particles in the diffusion path [48]. For the sake of completeness we will give the absorption rate for that case, as well (for details see [48] ). The mass transfer is accompanied here by a first-order chemical reaction. This situation is illustrated in Fig. 1 where three particles are located behind each other. The absorption rate
60 |
E. Nagy |
can be given by Eq. 12, where the mass transfer coefficient, b, can be expressed as follows:
|
b = k° |
÷921 + M2 |
nN2 – nN1 |
|
(14) |
|
|
04cosh l |
N |
|
|||
|
|
02n 0 |
|
|
||
with |
for 1≤ i ≤ N–1 |
|
|
1 |
||
|
nfi = nfi– 1 1 + p tanh lp tanh sd + mfi–1 tanh ld + |
|||||
|
3p tanh sd f = 0,1,2 |
|||||
|
|
|
|
|
|
(15) |
|
mfi = nfi– 1 tanh lp + p tanh sd + mfi–1 1 + |
1 |
|
|||
|
3p tanh ld tanh sd f = 0,1,2 |
|||||
and |
for i = N |
|
|
|
(16) |
|
|
|
|
|
|||
|
nNf = nNf – 1 1+p tanh lp tanh sd + mfN–1 1 + |
1 |
|
|||
|
3p tanh ld tanh sd f = 0,1,2 |
|||||
|
|
|
|
|
|
(17) |
|
mNf = nNf – 1 tanh lp + p tanh sd + mfN–1 1 + |
1 |
|
|||
|
3p tanh ld tanh sd f = 0,1,2 |
|||||
with |
|
|
|
|
|
(18) |
|
|
|
|
|
|
|
|
|
2 |
|
|
|
|
|
|
6sd p052 |
|
|
||
|
lp = 6D |
(1 + M ) |
|
|
||
The parameters (sd, l, p, M, ) are identical with those given after Eqs. 11 and 13. The initial values of n and m, which we need to calculate the values of nif and mfi are as follows:
n00 = tanh l; m00 = 1; n01 = m01 = exp (– l); n02 = m02 = exp l
2.1.3
Spherical Particles in the Diffusion Path
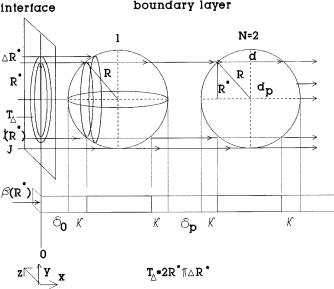
The mass transfer rate equations defined by Eqs. 9 and 12 and the mass transfer coefficient given by Eq. 14 refers to cubic particles. Obviously,this simplification can lead to major errors in the predicted values of the mass transfer rates. Brilman et al. [42], Lin et al. [44] and Brilman et al. [54] have taken into account that the droplets are rigid spheres in their one-, twoand three-dimensional models.Van Ede et al. [49] worked out a model taking into account the spherical effect by varying the dispersed phase hold-up with the distance from the gas-liq- uid interface. This model cannot be applied, generally. Using the mass transfer equations given above for cubic particle the mass transfer rate for sphere can easily be obtained by means of geometric considerations. This is illustrated in Fig. 2 [48]. The mass transfer rates for cubic particle can be considered to be valid for a differential surface element, where the diffusion distances, d0, d, dp, are constants. At Fig. 2 this surface element, TD is an annulus with radius R*, TD = 2pRDR*. The diffusion distances belonging to TD can be obtained from
Three-Phase Oxygen Absorption and Its Effect on Fermentation |
61 |
Fig. 2. Geometrical approach to obtain the jave value for the heterogeneous part of the gasliquid interface
geometric considerations. For instance,the diffusion distance inside the particle as a function of R* can be given as follows:
5 |
|
08R* 2 |
|
d = dp 1 – R |
(20) |
The value of k in Fig. 2 represents the change of the diffusion path in the phase segments, due to the curvature of the particle surface:
k = dp – d |
(21) |
02 |
|
Knowing the k value, the diffusion distances belonging to the TD will be d0 + k, d, dp + 2k for the three phase segments. Thus, the mass transfer coefficient can be given by the following function:
b (R*) = b (d0 + k, d, dp + 2k) |
(22) |
Now, the average mass transfer coefficient corresponding to the total gas-liquid interface of the heterogeneous part (it is equal to R2p) can be obtained after integrating b (R*) TD over the total interface (R¢* = R*/R) and dividing it by the total interface:
1 |
R |
(23) |
bave = |
Ú 2R*pb (R*) dR* |
|
R62p 0 |
|
|
62 |
E. Nagy |
Knowing the average mass transfer coefficient, the absorption rate referring to the total gas-liquid interface can be given for zeroand first-order reactions, respectively as follows (see also Eq. 7, 9, 12, 14):
J*het = bo, ave 1.2e2/3 1 – |
O*M2T |
+ k° (1 – 1.2e2/3) |
(24) |
||
O* – OL + O*M2 |
|||||
|
008 |
|
|
|
|
(O* – OL + O*M2) |
|
|
|
|
|
J*het = bave 1.2e2/3 + k° ÷921 + M2 (1 – 1.2e2/3) O* – |
OL |
|
(25) |
||
192+ M2 |
|||||
The factor of 1.2 in Eqs. 24 and 25 differs for that given in Eq. 6. This follows from the geometrical difference between cubic and sphere.
2.1.4
Effect of the Kinetic Parameters
Both the mass transfer kinetic parameters (diffusion in the phases, D, Dd , surface renewal frequency, s) and chemical reaction rate constants (k0 , k1) strongly influence enhancement of the absorption rate. The particle size, dp, the dispersed liquid holdup, e and the partition coefficient,H can also strongly alter the absorption rate [42–44, 46, 48]. Similarly, the distance of the first particle from the gas-liquid interface, d0 is an essential factor. Because the diffusion conditions are much better in the dispersed phase (larger solubility and, in most cases, larger diffusivity, as well) the absorption rate should increase with the decrease of the d0 value.
Lin et al. [44] simulated the enhancement using the two-dimensional model, as a function of all important parameters. It is clear from this work that the role of lateral diffusion depends mainly on the particle capacity, that is, on the value of partition coefficient, H. This conclusion was drawn by Brilman et al. [42, 54], as well. The one-dimensional model does not contain the lateral effect and, as a consequence, the absorption rate would be underestimated by this model and the difference of the results obtained by the oneand two-dimensional models would be increased with increasing partition coefficient. The question is in which parameter range this error can be neglected.
First, we compare the enhancement obtained by the model presented to that of obtained by Lin et al. [44] for the case of M = 0 (Fig. 3). The partition coefficient of the organic components ranges between about 10 and 25 (for instance for silicone oil [21], hexadecane [37] octene [49] the H values are equal to about 20, 12, 18, respectively). For the comparison, the partition coefficient was chosen to be 10 because we had obtained numerical data at this value, only. The difference between the results is rather low, it is lower than 10%. Increasing the H value the error will be larger. For H = 100 the difference between the two models can reach 40% in the parameter range given for Fig. 3. This difference for H = 20 might not be higher than 15–20% relating the error to mass transfer rates obtained by our model. From this it can be concluded that the one-dimen- sional, analytical model (Eqs. 24, 25) can be applied with good accuracy for fer-
- #
- #15.08.20134.04 Mб17Hastie T., Tibshirani R., Friedman J. - The Elements of Statistical Learning Data Mining, Inference and Prediction (2002)(en).djvu
- #
- #
- #
- #
- #
- #
- #
- #15.08.201315.44 Mб27Hudlicky M, Pavlath A.E. (eds.) - Chemistry of Organic Fluorine Compounds 2[c] A critical Review (1995)(en).djvu
- #