

02a_EU_policies-regional_policy
.pdfMANAGEMENT
Some outputs…..
•Increasing per capita GDP in Greece, Spain, Ireland and Portugal – ( Greece increased from 74% of the EU average to 88% between 1995 and 2005)
• |
Helping to reduce income disparities between richest and poorest by |
|
roughly a sixth (between 2000 and 2005) through sustained high growth |
•By 2015, it is estimated that regional policy will have generated an additional 440,000 jobs in Poland, as well as contributing an extra 6% to GDP and 21% to investment
•Over 44,000 km of road were built or reconstructed in the period 2000-2006. The equivalent figure for rail was nearly 12,000 km
•Supporting more than 250,000 small businesses in the UK
•Over 25,000 R&D co-operation projects were supported in the period 2000-
2006

MANAGEMENT
What is the added value?
•Leverage effect of additional resources
•Multi-annual planning, partnership, monitoring and evaluation
•Support for other EU objectives such as internal market, sustainable development
•Ring-fencing public resources
•Interregional cooperation and sharing of best practice
But
•Complexity of management and control structures
•Reality on ground can be very variable
•Unclear in some MS if effects are consistent or attributable to policy
•Effectiveness of monitoring and evaluation undermined by poor data
Source: Cohesion Report, Bachtler and Gorzelak

MANAGEMENT
Five things to remember
1.It has successfully reduced the gaps between regions in Europe and made a major contribution to prosperity and democratic stability.
2.It has improved management and governance in the regions by decentralising management and devolving responsibility: the
Commission does not select projects!
3.It is, with research, the EU’s biggest budget heading;
4.It works by investing in infrastructure, training, innovation and research. No hand outs.
5.Its success is recognised by all candidate countries and by many others (China, S. Africa, Russia, Brazil…)

MANAGEMENT
Cohesion Policy 2007 - 2013
01.07.2013 |
Hier steht der Name des Autors |
24 |
MANAGEMENT
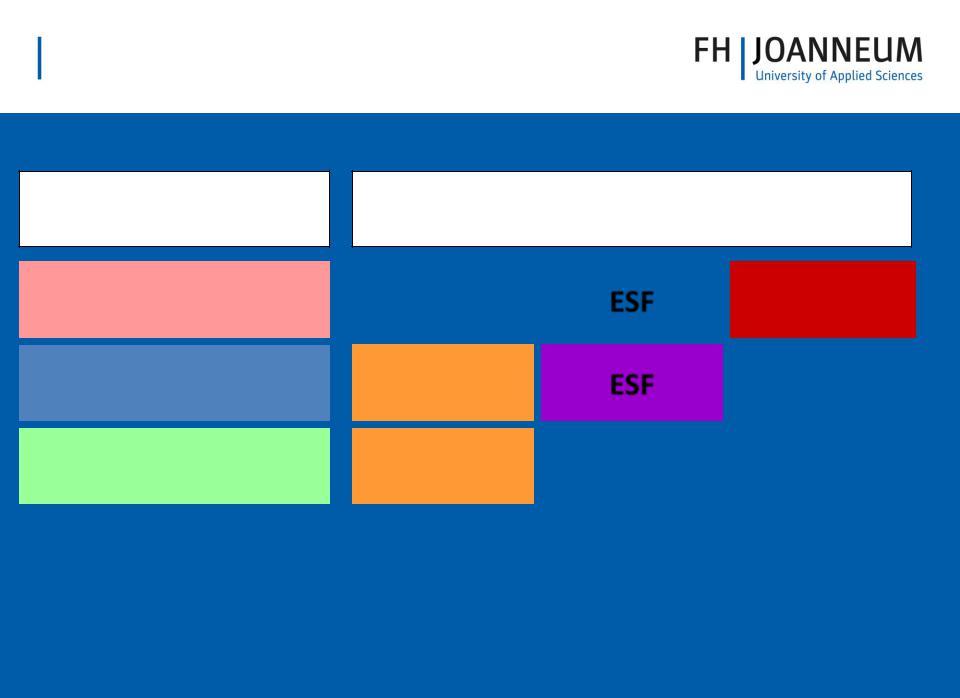
Objectives, Structural Funds and instruments 2007-2013
Objectives
Convergence
Regional Competitiveness
and Employment
European territorial Cooperation
Structural Funds and instruments
ERDF |
|
ESF |
Cohesion |
|
Fund |
||
|
|
|
|
|
|
|
|
ERDF ESF
ERDF
infrastructure, |
|
vocational |
|
environmental and |
innovation, |
|
training, |
|
transport infra- |
investments |
|
employment |
|
structure, |
etc. |
|
aids etc. |
|
renewable energy |
|
|
|
|
|
|
|
|
|
|
all Member States and regions |
|
MemberStates with a |
||
|
GNI/head below 90% |
|||
|
|
|
|
|
|
|
|
|
|

MANAGEMENT
Cohesion Policy
2007-2013
3 Objectives
Budget: EUR 307.6 bn
(0.37% of EU-GNI)
Programmes and |
Eligibility |
Priorities |
|
Allocations |
||
Instruments |
|
|||||
|
|
|
|
|
|
|
Convergence objective |
81.7% |
|
|
|
||
|
|
|
(EUR 251.33 bn) |
|
||
|
Regions with a GDP/head |
•innovation; |
|
57.6% |
||
|
•environment/ |
|
||||
Regional and national |
75% of average EU25 |
|
EUR 177.29 bn |
|||
risk prevention; |
|
|||||
programmes |
|
|
|
|
||
|
|
•accessibility; |
|
|
||
ERDF |
Statistical effect: |
|
|
|||
•infrastructure; |
|
4.1% |
||||
ESF |
Regions with a GDP/head |
|
||||
|
|
|
||||
75% of EU15 |
•human resources; |
|
EUR 12.52 bn |
|||
|
and >75% in EU25 |
•administrative capacity |
|
|
||
Cohesion Fund |
Member States |
•transport (TENs); |
|
|
||
•sustainable transport; |
|
20.0% |
||||
GNI/head 90% |
|
|||||
including phasing-out |
•environment; |
|
EUR 61.42 bn |
|||
EU25 average |
|
|||||
|
•renewable energy |
|
|
|||
|
|
|
|
|
||
Regional competitiveness and employment objective 15.8% |
|
|||||
|
(EUR 48.79 bn.) |
|
|
|
||
|
|
|
|
|
|
|
|
Member States |
•Innovation |
|
|
|
|
Regional programmes |
suggest a list of |
|
|
15.5% |
||
•environment/risk |
|
|||||
regions |
|
EUR 38.4 bn |
||||
(ERDF) |
|
|||||
(NUTS I or II) |
prevention |
|
|
|
||
and national |
•accessibility |
|
|
|||
|
|
|
|
|||
programmes |
|
|
•European Employment |
|
|
|
"Phasing-in" |
|
|
||||
(ESF) |
Strategy |
|
|
|
||
Regions covered by objec- |
|
|
3.4% |
|||
|
tive 1 beween 2000-06 |
|
|
|
||
|
|
|
|
EUR 10.38 bn |
||
|
and not covered by the |
|
|
|
||
|
|
|
|
|
||
|
convergence objective |
|
|
|
|
|
European territorial co-operation objective |
2.44% |
|
|
|||
|
(EUR 7.5 bn.) |
|
|
|
||
Cross-border and |
Border regions and |
|
•innovation; |
|
|
of which: |
transnational |
greater regions of |
|
•environment/ |
|
77.6% cross-border |
|
|
risk prevention; |
|
18.5% transnational |
|||
programmes and |
transnational |
|
|
|||
|
•accessibility |
|
|
3.9% interregional |
||
networking (ERDF) |
co-operation |
|
|
|
+ ENPI |
|
|
•culture, education |
|
||||
|
|
|
||||
|
|
|
|
|
|
|
MANAGEMENT
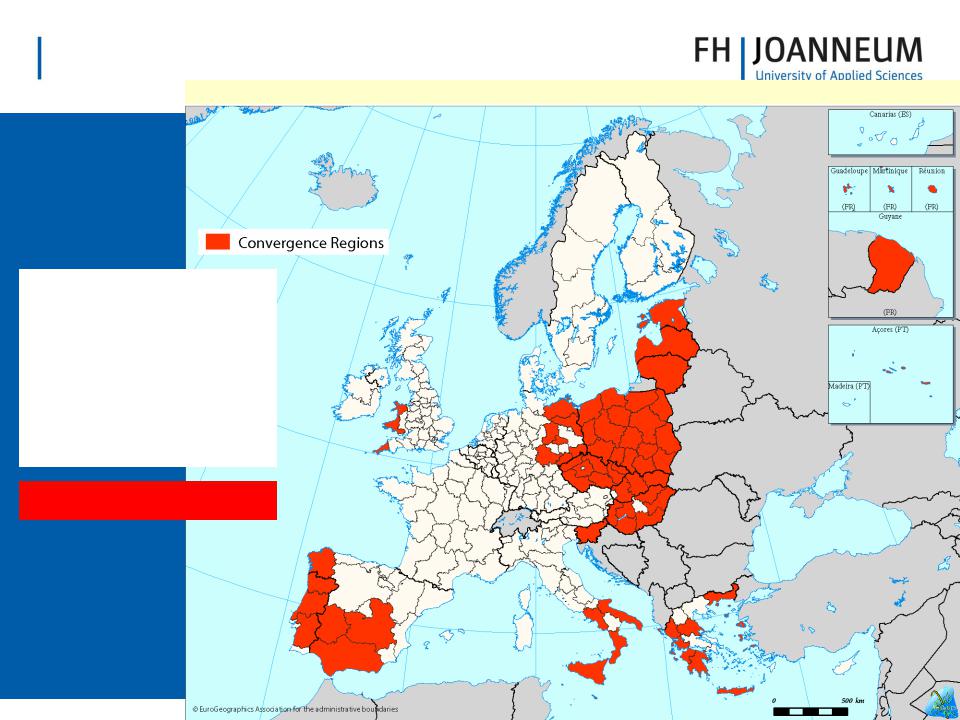
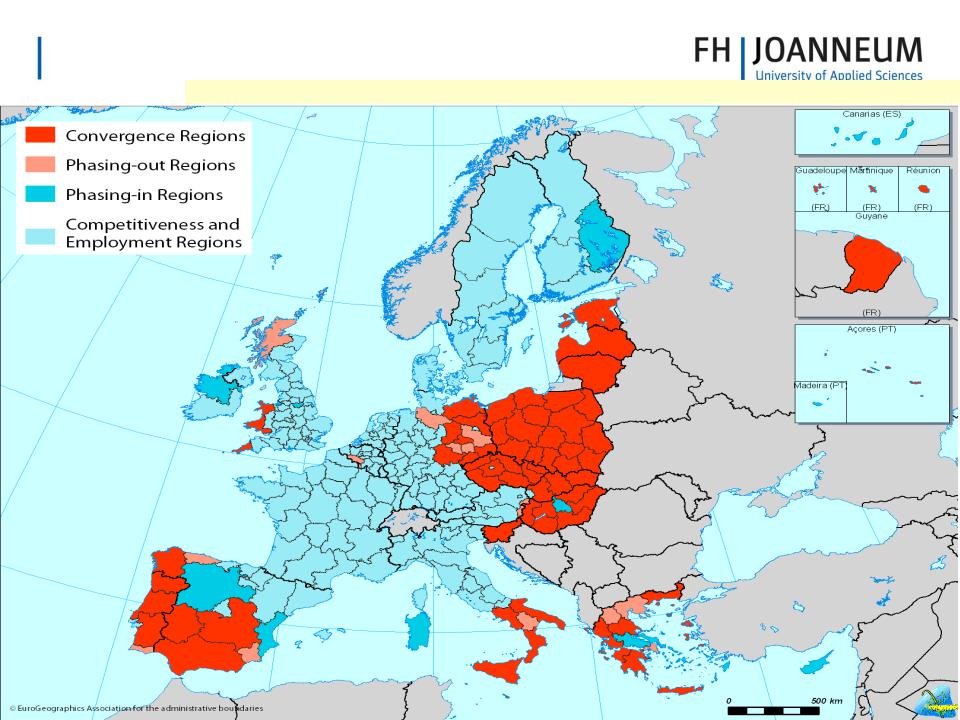
MANAGEMENT
Convergence-Objective: Regions below 75% of EU25 GDP
Average 2000-2002
86 Regions
124 million inhabitants 27.3%of EU population
Allocation: EUR 177.8 bn
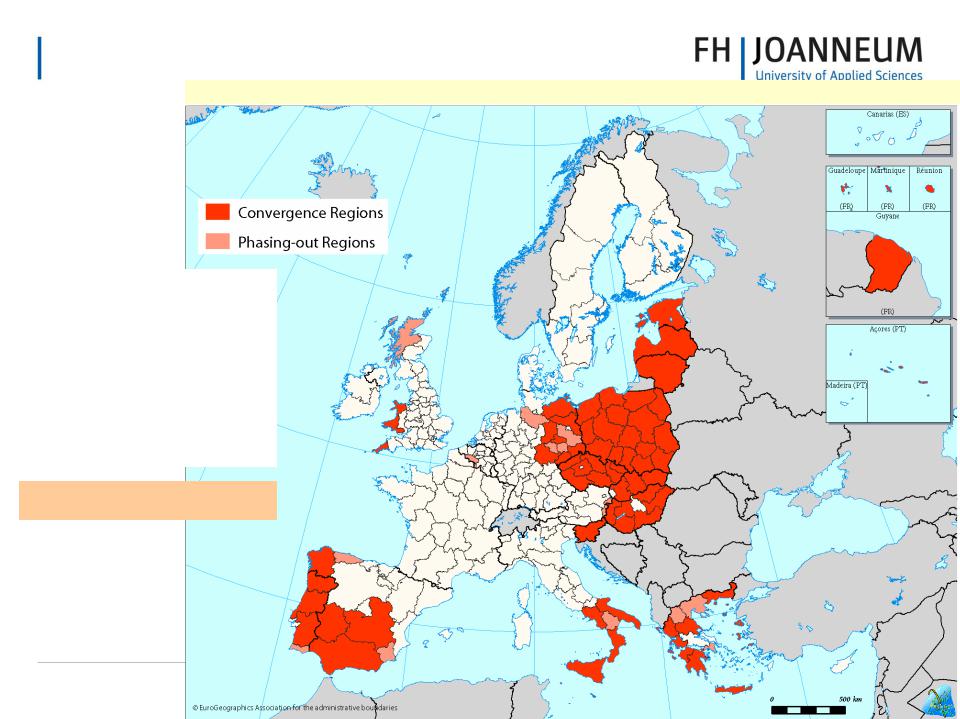
MANAGEMENT
Convergence Objective: Regions below 75% of EU15 GDP
(statistical effect/ phasingout regions)
16 Regions
16.4 million inhabitants
3.6% of EU population
Allocation: EUR 12.5 bn
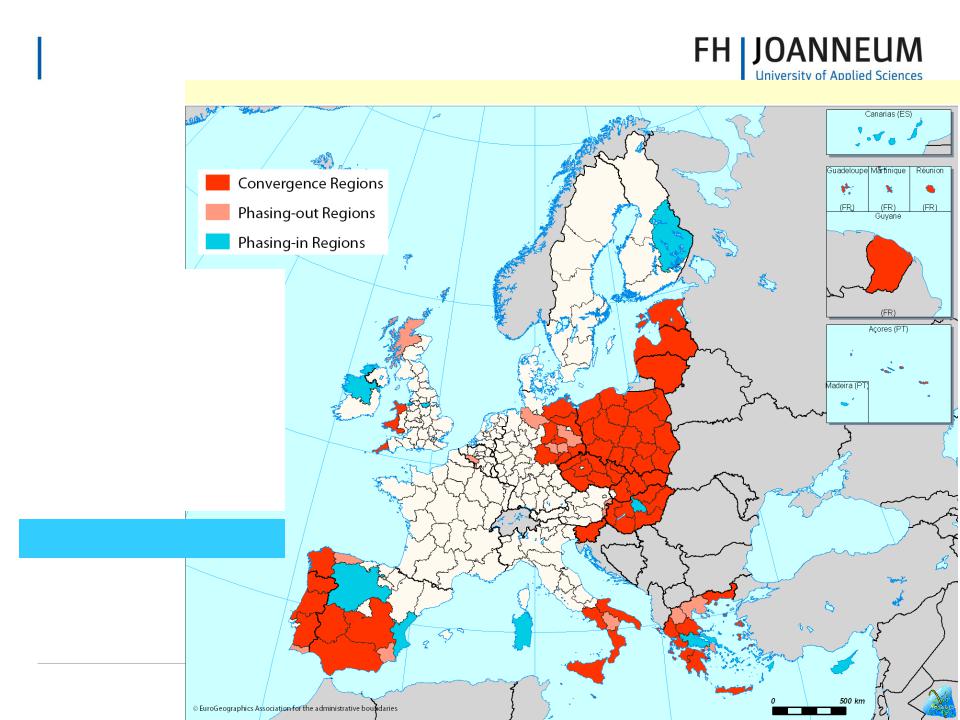
MANAGEMENT
Objective Regional
Competitiveness and Employment: Phasing-in regions
(covered by Objective 1 between 2000-2006, now above 75%)
13 Regions
19 million inhabitants
4.2% of EU population
Allocation: EUR 10.38 bn