


3 Statistical moments as signal features
measurements (e.g., through speech analysis [677]) have been applied in controlled settings such as telepsychiatry [279] and evaluation of therapy effectiveness [677]. However, outside such controlled conditions these measures have not proven to be reliable.
Measurement of biosignals have already been embedded into wearable tools; for example, Picard and Scheirer [523] designed the ’Galvactivator’, a glove that detects the skin conductivity and maps its values into a LED display. In an overview of previous work of the Affective computing Research Group at MIT, Picard [522] describes several affective wearables. One affective wearable that is of interest in this research is a pair of expression glasses. The pair of expression glasses sense facial movements, which are recognized as affective patterns.
3.5 Experiment
The goal of this experiment was to enable a search for robust (e.g., baseline-free) algorithms for use in future emotional awareness systems. These should interpret positive or negative emotions from biosignals.
3.5.1 Participants
In the experiment, 24 Dutch subjects participated (average age: 43 years). Twenty of the participants were females, since we expected clearer facial emotion expressions from them [66, 361]. As we could not find 4 more females, we replaced them by men in order to be able to maintain the counterbalancing in the experiment design, as will be depicted in Section 3.5.3. All subjects had been invited from a volunteer subjects database, and were rewarded with a small gift for their participation. All subjects signed an informed consent form.
3.5.2 Equipment and materials
We selected 16 film fragments for their emotional content. Most were adopted from the set of Gross and Levenson [235, 237] and are known to elicit one unique emotion from various viewers: Silence of the Lambs (198 seconds), When Harry met Sally (149 seconds), The Champ (153 seconds), Sea of Love (9 seconds), Cry Freedom (142 seconds), The Shining (80 seconds), Pink Flamingoes (30 seconds). We used these fragments in English-spoken versions with Dutch subtitles, as is usual on Dutch TV and in Dutch cinemas. Since we were not able to find enough material of Gross and Levenson [235, 237] with Dutch subtitles of acceptable quality, we added a number of similar fragments to the set: Jackass the Movie -
46

3.5 Experiment
paper-cut scene (51 seconds), Static TV color bars (120 seconds), The Bear - intro (120 seconds), Sweet Home Alabama - wedding scene (121 seconds), Tarzan - orchestra scene (133 seconds), Abstract Shapes - screen saver (120 seconds), Lion King - dad’s dead (117 seconds); Nature documentary (120 seconds), Final Destination - side-walk café scene (52 seconds). An overview of all film fragments used in this study is provided in Table 3.1. The duration of the 16 film fragments ranged from 9 seconds to 4 minutes. For the fragments with durations shorter than 120 seconds, a plain blue screen was added to make a total of 120 seconds, a minimum duration needed for assessing both the low and high frequency HRV components [44]. We displayed the film fragments on a large 42′′ 16 : 9 flat panel screen attached to the wall. The subjects viewed the fragments from a comfortable chair at a distance of about 2 meters.
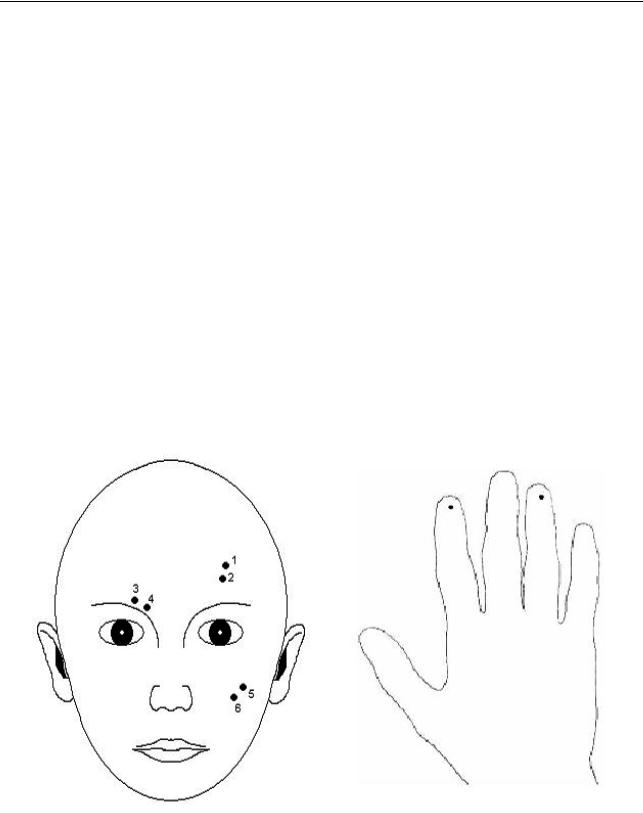
We used a TMS International Porti5 − 16/ASD system for the psychophysiological measurements. The system was connected to a computer with TMS Portilab software . Its ground electrode was attached to the subject’s right-hand side lower chest area. We performed 3 EMG measurements: at the right-hand corrugator supercilii muscle, the lefthand zygomaticus major muscle, and the frontalis muscle above the left eye (see Figure 3.1). The detail muscle positions were found by touching the contracting muscles, in line with
URL TMS Portilab software: http://www.tmsi.com/
Table 3.1: The eight film scenes with the average ratings with the accompanying standard deviations (between brackets) given by subjects (n = 24) on both experienced negative and positive feelings. Four emotion classes are founded: neutral, mixed, positive, and negative, based on the latter two dimensions. The top eight film scenes were selected for further analysis.
Film scene |
Positive |
Negative |
Emotion category |
|
|
|
|
Color bars |
1.60 (1.43) |
2.20 (2.04) |
neutral |
Abstract figures |
1.20 (0.70) |
2.10 (1.94) |
neutral |
The bear |
5.15 (1.50) |
1.65 (0.88) |
positive |
Tarzan |
5.10 (1.17) |
1.50 (0.95) |
positive |
Final destination |
3.11 (1.70) |
4.32 (1.63) |
mixed |
Lion King |
3.85 (2.21) |
3.65 (1.93) |
mixed |
Cry freedom |
1.95 (1.54) |
6.25 (1.07) |
negative |
Pink flamingos |
1.75 (1.20) |
5.60 (1.54) |
negative |
Silence of the lambs |
2.30 (1.38) |
3.85 (1.73) |
neutral |
When Harry met Sally |
4.60 (1.47) |
1.80 (1.15) |
positive |
The champ |
2.65 (1.46) |
4.35 (1.05) |
mixed |
Jackass the movie |
1.85 (1.57) |
5.95 (1.47) |
negative |
Sea of love |
2.15 (1.31) |
3.90 (1.74) |
neutral |
Sweet home Alabama |
4.35 (1.66) |
1.70 (1.26) |
positive |
The shining |
2.65 (1.39) |
3.55 (1.47) |
neutral |
Nature documentary |
4.50 (2.04) |
1.45 (1.28) |
positive |
|
|
|
|
47
3 Statistical moments as signal features
Lapatki, Stegeman, and Jonas’ [377] recommendations. Subsequently, for each measurement we placed 2 electrodes along the muscle (see Figure 3.1), respecting Fridlund and Cacioppo’s [206] “Guidelines for human electromyographic research”. The EMG signals were first high-pass filtered at 20 Hz; then, the signal was rectified by taking the absolute difference of the two electrodes and finally a central moving average filter was applied with a time constant of 0.2 seconds.
Two active skin conductivity electrodes were attached to the subject’s right hand: on the inside distal phalanges of the index and ring fingers (see Figure 3.1). We calculated skin conductivity from the measured signal by central moving average filtering with a time constant of about 2 seconds; thus, capturing EDA signal variations reliably in first order [62]; see also Table 1.1 in Chapter 1. ECG was also measured with the intention of investigating heart rate variability measures, but since the TMS program failed to actually record the data for many participants, these data were not analyzed.
Figure 3.1: Left: The points indicate the electrodes that were placed on the face of the participants to determine the EMG signals. The EMG signals of the frontalis, corrugator supercilii, and zygomaticus major were respectively measured through electrodes 1 − 2, 3 − 4, and 5 −6. Right: The points at which the electrodes were placed on the hands of the participants to determine the EDA signal.
48