

PAGE PROOF: 2ND PASS
14 Local Abundance, Diversity,
C H A P T E R
and Rarity
IIn this chapter we address a series of questions that raise fundamental issues in ecology as well as having important implications for applied ecology and conservation. What determines the relative abundances of the species in a community? Are abundant species competitively superior to
less common species, or are they more abundant for other reasons? Why are some species rare, others common, and still others invasive? Our focus in this chapter is mainly at the scale of communities; we return to some of the same issues at larger scales in Chapter 20.
The abundances of individuals within species are only part of the story, however. G. Evelyn Hutchinson asked a deceptively simple question in the title of his 1959 paper, “Homage to Santa Rosalia, or why are there so many kinds of animals?” Ecologists are still probing the implications of this general question. What determines the number of species that can coexist in a community? The number of species in a community might be determined largely by deterministic processes such as competition, or by chance processes, such as what species are able to reach the community. How do species interactions affect the ability of a new species to become integrated into the community? It may be that biotic and abiotic factors make a plant community more susceptible or more resistant to invasion by exotic species.
Much effort has gone into looking at how processes that determine local abundances play out within a single community. More recently, there has been a growing recognition that landscape and regional processes can also be very important in determining the relative numbers of individuals per species as well as the number of species in communities. In this chapter we examine the interaction between local and regional processes from a local perspective. In Chapter 17 we will look at landscape-level processes that determine population dynamics and species distributions, and in Chapter 20 we will consider abundance and diversity at regional and global scales.
Dominance
Even a cursory walk through any plant community will reveal that not all species are equally abundant. Typically, at least in temperate communities, most of the individuals (or biomass) in a community will belong to one or a few species, while many other species will be rare. The most conspicuous and abundant species (numerically or in terms of biomass) in a plant com-
274 Chapter 14
munity are called the dominants. Dominant species are often used to characterize plant communities: a cattail marsh, a pine barren, an oak-hickory forest, or a saguaro “forest” are all characterized by their most conspicuous or abundant plants.
Are Dominant Species Competitively Superior?
The term “dominant” implies competitive superiority. Are numerically dominant species really competitively dominant as well? While plant ecologists have generally assumed that this is the case, few have directly tested that assumption. We have already talked about differing views on the consistency of competitive hierarchies in Chapter 10. Here we examine the extent to which numerical abundance is determined by competitive ability. Random processes, such as which species happen to occupy a site first, can also contribute to the pattern of species abundances at a site. The current pattern of abundances in a community may also be temporary. For example, if a site is undergoing succession following a disturbance (see Chapter 13), one species may be more abundant than another because it tends to dominate during early succession, but may be displaced as time passes.
Timothy Howard and Deborah Goldberg (2001) used field and garden experiments on herbaceous perennials in a Michigan old field to test whether rankings of competitive ability were related to observed species abundances in the field. Competitive ability at the stage of seedling germination and early growth was strongly related to species abundance. The effects of adult competitors on germination and seedling growth were small for the most abundant species, Poa compressa (bluegrass, Poaceae), and large for the least abundant species, Achillea millefolium (yarrow, Asteraceae). In contrast, the competitive ability or survivorship of adult plants had only a limited relationship to species abundance. Other researchers who have examined the effects of competitive ability at single life history stages (mostly early seedling growth) have generally reported positive relationships between abundance and competitive ranking.
Another approach to testing whether numerical dominants are really competitive dominants is to experimentally remove the dominant species from a community and observe the effects on community structure. Gurevitch (unpublished data) found that removing the dominant species from an old-field community had different effects depending on the species removed. Removal of one of the dominants, Dactylis glomerata (orchard grass, Poaceae), had little influence on other species, but removal of another, Solidago rugosa (wrin- kle-leaved goldenrod, Asteraceae), had dramatic effects. Removal of S. rugosa from a plot resulted in an increase in species richness by permitting the persistence of species that had disappeared elsewhere in the old field
PAGE PROOF: 2ND PASS
in the process of succession and by allowing other species to increase in abundance much more than they did in nonremoval plots. This finding implies that the goldenrod was not only numerically dominant, but also competitively superior.
Other researchers have also reported community responses to the removal of dominant species. For example, Kutiel et al. (2000) found that removal of dominant shrubs on coastal dunes in Israel led to greater abundance of annual species and therefore higher diversity. Removal of the C3 grass Lolium perenne (English rye grass, Poaceae) in a New Zealand grassland resulted in increased species diversity, but removal of C4 grasses did not have that effect, presumably because no other species in the community had a phenology similar to that of the C4 grasses (Wardle et al. 1999).
Abundance Curves
One way of describing hierarchies of relative abundance is the use of abundance curves (Figure 14.1; also known as dominance-diversity curves). Abundance curves offer an alternative to diversity indices (see Chapter 12) for expressing the number and relative abundances of all the species in a community (or sample, or stand). Because they are a graphical presentation rather than an attempt at condensing everything into a single number, they avoid some of the limitations of diversity indices. Abundance curves can provide an excellent graphical contrast among different kinds of community structures—a curve representing a community with a high degree of dominance by a single species and low species richness will have a very different shape from one representing a highly diverse community without strong dominance, with many common species, and with a high total species number. However, these curves are more useful for descriptive purposes than for quantitative comparisons.
During the 1960s and 1970s it was suggested that abundance curves could serve as an indicator of the processes responsible for community structure, but this effort proved disappointing. Robert MacArthur (1960) proposed that the shape of a curve was created by the way in which species divided up the available energy in a system. Each species was hypothesized to monopolize a random fraction of that energy. This theory is referred to as the broken-stick model because the resulting pattern is the same as would be obtained if one took a stick (representing the available energy) and broke it into pieces at random (Figure 14.1, curve A).
Others demonstrated, however, that one could obtain an identical pattern through a strictly deterministic process. Depending on the assumptions used, curves of any shape can be generated, but such assumptions are extremely difficult to verify. Assume, for example, that the most dominant species can preempt 50% of

PAGE PROOF: 2ND PASS
|
|
|
|
|
|
|
Theoretical distributions |
|
|
||||
|
100 |
|
|
|
|
|
|
|
Broken-stick model (A) |
|
|
||
|
|
|
|
|
|
|
|
|
|
||||
|
|
|
|
|
|
|
|
|
Geometric series (B) |
|
|
||
|
|
|
|
|
|
|
|
||||||
|
|
|
|
|
|
|
|
|
Lognormal distribution (C) |
||||
|
|
|
|
|
|
|
|
|
|||||
|
|
|
|
|
|
|
|
|
|||||
|
|
|
|
|
|
|
Data plots |
|
|
|
|
||
|
|
|
|
|
|
|
|
|
|
||||
|
10 |
|
|
|
|
|
|
|
Subalpine fir forest (D) |
|
|
||
|
|
|
|
|
|
|
|
|
|
||||
(%) |
|
|
|
|
|
A |
|
|
Deciduous cove forest (E) |
|
|
||
|
|
|
|
|
|
|
|
|
|||||
|
|
|
|
|
|
|
|||||||
|
|
|
|
|
|
|
|
|
|||||
|
|
|
|
|
|
|
|
|
|
|
|
||
|
|
|
|
|
|
|
|
|
|||||
|
|
|
|
|
|
|
|
|
|
|
|
||
|
|
|
|
|
|
|
|
|
|
|
|
|
|
importance |
1.0 |
|
|
|
|
|
|
|
|
|
|
|
|
|
|
|
|
|
|
|
|
|
|
|
|
||
Relative |
|
|
|
B |
|
|
|
|
|
|
|
|
|
0.1 |
|
D |
|
|
|
C |
E |
|
|
||||
|
|
|
|
|
|
||||||||
|
|
|
|
|
|
||||||||
|
|
|
|
|
|
||||||||
|
|
|
|
|
|
||||||||
|
|
|
|
|
|
||||||||
|
|
|
|
|
|
||||||||
|
|
|
|
|
|
||||||||
|
|
|
|
|
|
|
|||||||
|
|
|
|
|
|
|
|
|
|||||
|
|
|
|
|
|
|
|
|
|||||
|
|
|
|
|
|
|
|
|
|
||||
|
|
|
|
|
|
|
|
|
|
||||
|
|
|
|
|
|
|
|
|
|
||||
|
|
|
|
|
|
|
|
||||||
|
|
|
|
|
|
|
|
||||||
|
|
|
|
|
|
|
|
|
|
|
|
||
|
0.01 |
|
|
|
|
|
|
|
|
|
|
|
|
|
|
|
|
|
|
|
|
|
|
|
|
|
|
|
0.001 |
|
|
|
|
|
|
|
|
|
|
|
|
|
|
|
|
|
|
|
|
|
|
|
|
|
|
|
|
|
|
|
|
|
|
|
|
|
|
|
|
|
|
|
|
|
|
|
|
|
|
|
|
|
|
|
|
|
|
|
|
|
|
|
|
|
|
|
|
|
|
|
|
|
|
|
|
|
|
|
|
|
|
|
|
|
|
|
|
|
|
|
|
|
|
|
|
|
|
|
|
|
|
|
|
|
|
|
|
|
|
|
|
|
|
|
|
|
|
|
|
|
|
|
|
|
0 |
|
10 |
20 |
30 |
40 |
|||||||
|
Most common |
Species rank |
|
Least common |
|||||||||
|
|
|
|
|
|
|
|
|
|
||||
Figure 14.1
Examples of both theoretical and empirical abundance curves. The vertical axis is the relative abundance of a species in a community—that is, the percentage of the community that it represents. Besides numbers of individuals, the relative abundance could be measured in terms of biomass, cover, frequency, or a combination of measures. As is often the case, the vertical axis is shown at a log scale. The horizontal axis arrays the species of the community in rank order, from most common to least common. The most common species has rank 1 (left side), the next most common species has rank 2, and so forth. The green curves represent three theoretical distributions. The black and gray curves represent two sets of empirical data for vascular plant communities in the Great Smoky Mountains of Tennessee—sub- alpine fir forests and deciduous cove forests. (After Whittaker 1975.)
the available energy in the system, that the next most dominant species can preempt 50% of the energy that remains, and so forth. This deterministic process would produce a geometric series (Figure 14.1, curve B). On the other hand, if dominance were determined by many independent factors that affected different species in different ways, the curve would be lognormal (Figure 14.1, curve C).
The problem with deciding among these alternatives (random division, preemption, or many factors) is that all three models (broken stick, geometric, and lognormal) could be fit to any given set of data. Thus, it is not possible to decide which process is responsible for a
Local Abundance, Diversity, and Rarity 275
given dominance pattern by examining the shape of the abundance curve for a given community. Instead, ecologists have shifted their attention to working out the mechanisms causing dominance patterns within different communities.
Rarity and Commonness
Species differ greatly not only in how abundant they are in any one place, but in the number of places in which they are found. Some species have a wide geographic distribution, while others are endemic (found in only one place). All species are rare when they first evolve; some go on to become common, while others remain rare. An understanding of rarity and the processes responsible for it is central to the preservation of endangered and threatened species. Endangered and threatened species are defined as being rare, although not necessarily globally rare. A species can be rare and listed as endangered in one state of the United States while being common in another state. In the United States and many other countries, the official listing of a species as endangered triggers a host of laws and regulations concerning how the species and its habitat must be protected. Thus, the topic of rarity is fraught with legal, political, and economic consequences.
The Nature of Rarity
While a plant species may be rare, common, or invasive (see below), these categories are not necessarily fixed characteristics of the species. A remarkable example is Pinus radiata (Monterey or radiata pine, Pinaceae) (Lavery and Mead 1998). Once a rare endemic limited to a narrow strip of the California coast, Monterey pine has escaped from timber plantations in the Southern Hemisphere to become a major invasive pest in a number of countries. In its native habitat, the trees are smallstatured and gnarled and, thus, are not used as timber. In plantations in the Southern Hemisphere, however, Monterey pine grows rapidly into large, straight trees. Chile, South Africa, New Zealand, and Australia all now have major naturalized populations of this species, and its geographic ranges and population sizes in these countries vastly exceed those in its native habitat. We will return to the factors that may make a species invasive after taking a look at some ecological aspects of rarity and commonness.
Deborah Rabinowitz (1981) identified three different aspects of species distributions: geographic range (wide or narrow), habitat specificity (broad or restricted), and local abundance (somewhere large or everywhere small; Table 14.1). These three aspects result in eight possible combinations of characteristics, and a given species could display any one of those combinations. Only one of the eight possible combinations—

276 Chapter 14 |
PAGE PROOF: 2ND PASS |
Table 14.1 A scheme for describing eight categories of commonness and rarity based on three traits
Geographic range |
|
Wide |
|
Narrow |
Habitat specificity |
Broad |
Restricted |
Broad |
Restricted |
Local abundance |
Somewhere |
Common |
Predictable |
Unlikely |
Endemic |
|
small |
|
(habitat specialists) |
|
counts |
||
|
large |
|
|
|
|
|
|
Everywhere |
Sparse |
|
Unlikely |
Rare on all |
|
|
|
|
|
|
|
|
Source: Rabinowitz 1981.
wide range, broad habitat specificity, and large local |
In a similar fashion, species that can live in a wide |
|||||||||||||
abundance somewhere—is classified as commonness. |
variety of habitat types tend to have large geographic |
|||||||||||||
The other seven each constitute some form of rarity. |
ranges because in any given area there is likely to be |
|||||||||||||
Commonness and rarity are the result of processes |
some suitable habitat. While these relationships are the |
|||||||||||||
that operate at local, regional, and even global scales. |
typical ones, exceptions exist. Some species are habitat |
|||||||||||||
Local differences in species abundances may or may not |
specialists with small geographic ranges, yet dominate |
|||||||||||||
be reflected at larger scales, and these patterns may |
the communities they are found in. An example is the |
|||||||||||||
change through time. Plants that were once common |
mint Mentha cervina (Lamiaceae), a specialist of montane |
|||||||||||||
may decline in numbers, while rare species may, over |
wetlands of the eastern Mediterranean. While it is found |
|||||||||||||
time, become common or even dominant, particularly |
in a very limited range of sites in central Spain, where |
|||||||||||||
in new or changed environments. Local and regional |
it is found, it exists at high densities. |
|
|
|
|
|||||||||
patterns may be uncoupled or may be |
|
|
|
|
|
|
|
|
|
|
|
|
|
|
linked in a variety of ways. By chance alone, |
|
|
|
|
|
|
|
|
|
|
|
|
|
|
a species may be introduced to a new site to |
|
5 |
|
|
|
|
|
|
|
|
|
|
|
|
|
|
|
|
|
|
|
|
|
|
|
|
|
||
which it is well adapted and may become |
|
|
|
|
|
|
|
|
|
|
|
|
|
|
highly abundant, as the Monterey pine has |
|
|
|
|
|
|
|
|
|
|
|
|
|
|
done. From there, it may spread and |
|
|
|
|
|
|
|
|
|
|
|
|
|
|
become abundant everywhere in a broad |
|
4 |
|
|
|
|
|
|
|
|
|
|
|
|
|
|
|
|
|
|
|
|
|
|
|
|
|
||
region. In this case, events at a local level |
|
|
|
|
|
|
|
|
|
|
|
|
|
|
spread to a regional scale. Conversely, |
|
|
|
|
Mentha cervina |
|
|
|
|
|
|
|
|
|
processes at a regional scale (such as gene |
|
|
|
|
|
|
|
|
|
|
|
|
||
abundance |
|
|
|
|
|
|
|
|
|
|
|
|
|
|
flow among sites; see Chapter 5) may result |
3 |
|
|
|
|
|
|
|
|
|
|
|
|
|
in a species becoming adapted to varying |
|
|
|
|
|
|
|
|
|
|
|
|
||
|
|
|
|
|
|
|
|
|
|
|
|
|
||
conditions across a wide geographic range. |
|
|
|
|
|
|
|
|
|
|
|
|
|
|
A high average level of adaptation, coupled |
local |
|
|
|
|
|
|
|
|
|
|
|
|
|
with metapopulation processes (see Chap- |
|
|
|
|
|
|
|
|
|
|
|
|
|
|
Mean |
2 |
|
|
|
|
|
|
|
|
|
|
|
|
|
ter 17), may result in the species reaching |
|
|
|
|
|
|
|
|
|
|
|
|
||
|
|
|
|
|
|
|
|
|
|
|
|
|||
high abundances everywhere it occurs. In |
|
|
|
|
|
|
|
|
|
|
|
|
|
|
|
|
|
|
|
|
|
|
|
|
|
|
|
|
|
this manner, regional-scale processes can |
|
|
|
|
|
|
|
|
|
|
|
|
|
|
determine local-scale patterns. |
|
|
|
|
|
|
|
|
|
|
|
|
|
|
Patterns of Rarity and Commonness |
|
1 |
|
|
|
|
|
|
|
|
|
|
|
|
|
|
|
|
|
|
|
|
|
|
|
|
|
||
|
|
|
|
|
|
|
|
|
|
|
|
|
|
|
While all possible combinations of local and |
|
|
|
|
|
|
|
|
|
|
|
|
|
|
regional patterns of commonness and rari- |
|
|
|
|
|
|
|
|
|
|
|
|
|
|
ty are conceivable, what combinations do |
|
|
|
|
|
|
|
|
|
|
|
|
|
|
|
|
|
|
|
|
|
|
|
|
|
|
|
|
|
|
0 |
|
|
10 |
20 |
30 |
40 |
50 |
||||||
we actually find in nature? There is often a |
|
|
|
|||||||||||
|
|
|
|
|
|
|
Range |
|
|
|
|
|
|
|
positive relationship between abundance |
|
|
|
|
|
|
|
|
|
|
|
|
|
|
Figure 14.2 |
|
|
|
|
|
|
|
|
|
|
||||
and geographic range (Figure 14.2): species |
|
|
|
|
|
|
|
|
|
|
||||
with large population sizes tend to be wide- |
Correlation of mean local abundance and geographic range for vascular |
|
|
|||||||||||
plants in montane wet meadows in Spain (rS = 0.17, P < 0.01). Mentha |
|
|
||||||||||||
spread, while species with small geograph- |
|
|
||||||||||||
cervina is an exception to the general trend that species with the largest |
|
|
||||||||||||
ic ranges tend to have small population |
geographic ranges also have the highest abundances where they are pres- |
|
|
|||||||||||
sizes. |
ent. (Data from Rey Benayas et al. 1999.) |
|
|
|
|
|
|
|||||||

PAGE PROOF: 2ND PASS
Local Abundance, Diversity, and Rarity 277
Table 14.2 Percentages of species falling into each of eight commonness and rarity categories in three studies
(A) Vascular plants of the British Isles (n = 160)
|
Geographic range |
|
Wide |
|
Narrow |
|
||
|
|
|
|
|
|
|
|
|
|
Habitat specificity |
Broad |
|
Restricted |
Broad |
|
Restricted |
|
|
|
|
|
|
|
|
|
|
|
Local abundance large |
36 |
|
44 |
4 |
|
9 |
|
|
|
|
|
|
|
|
|
|
|
Local abundance small |
1 |
|
4 |
0 |
|
2 |
|
|
|
|
|
|
|
|
|
|
(B) Vascular plants of montane wet meadows in Spain (n = 220) |
|
|
|
|||||
|
|
|
|
|
|
|
|
|
|
Geographic range |
|
Wide |
|
Narrow |
|
||
|
|
|
|
|
|
|
|
|
|
Habitat specificity |
Broad |
|
Restricted |
Broad |
|
Restricted |
|
|
|
|
|
|
|
|
|
|
|
Local abundance large |
14 |
|
7 |
12 |
|
13 |
|
|
|
|
|
|
|
|
|
|
|
Local abundance small |
2 |
|
10 |
2 |
|
39 |
|
|
|
|
|
|
|
|
||
(C) Trees of a tropical rainforest in Manú National Park, Peru (n = 381) |
|
|||||||
|
|
|
|
|
|
|
|
|
|
Geographic range |
|
Wide |
|
Narrow |
|
||
|
|
|
|
|
|
|
|
|
|
Habitat specificity |
Broad |
|
Restricted |
Broad |
|
Restricted |
|
|
|
|
|
|
|
|
|
|
|
Local abundance large |
68 |
|
19 |
0 |
|
0 |
|
|
|
|
|
|
|
|
|
|
|
Local abundance small |
7 |
|
6 |
0 |
|
0 |
|
|
|
|
|
|
|
|
|
|
|
|
|
|
|
|
|
|
|
Sources: (A) Rabinowitz et al. 1986 ; (B) Rey Benayas et al. 1999 ; (C) Pitman et al. 1999.
In an analysis of the entire native British flora, Rabinowitz and colleagues (Rabinowitz et al. 1986) found that 36% of species were common, with wide geographic ranges and large local abundances; almost 60% were restricted to particular habitats, while 15% had small geographic ranges and 7% had small maximum population sizes (Table 14.2A). This study was the first to analyze these patterns and is often used as a basis for generalizations about rarity. However, other researchers have found that these patterns vary depending on how one looks at the flora. A study by José Rey Benayas and colleagues considered the entire set of vascular plant species inhabiting a specialized habitat type, wet meadows in the mountains of central Spain (Table 14.2B). In this instance, the most frequent category was species with narrow geographic ranges, restricted habitat specificities, and small local abundances. In another study, Nigel Pitman and colleagues (Pitman et al. 1999) examined tree species in a highly diverse tropical rainforest in Manú National Park and the surrounding region in eastern Peru (Table 14.2C). Most of the tree species in this study were locally common in at least one plot and were found across a wide range of habitats (fewer than 25% were habitat specialists), and all had broad geographic distributions. This pattern contrasts strongly with the Rabinowitz et al. study of the British flora, in which many more species were habitat specialists (Rick-
lefs 2000). These results may have important implications for the conservation of tropical biodiversity because if most species are widespread, it will be easier to find land to preserve them.
We can also look at rarity from a taxonomic perspective. A study of rarity in the vascular plants of the United States and Canada found that taxonomic groups (genus, family, order, and class) with many species also tended to have higher than average numbers of rare species, while smaller groups had fewer rare species than expected (Schwartz and Simberloff 2001). This pattern would occur if large groups were more likely to produce new species through allopatric speciation (see Chapter 6), in which case, on average, the new species would be isolated, have small range sizes, and hence be more likely to be rare. Conversely, groups with high rates of extinction might lose their rare species first, so that small groups would be left with common species only.
Causes of Rarity and Commonness
Why is a particular species common or rare? The patterns described above suggest that ecological specialization may be an important cause of rarity. Species that are ecological specialists tend to have low abundances and small geographic ranges. This observation raises another question: why are there both ecological special-
278 Chapter 14 |
PAGE PROOF: 2ND PASS |
ists and ecological generalists? The traditional explanation is that there are trade-offs that result in commonness or rarity. By specializing, according to this theory, a species can better exploit a particular niche. The theory predicts that local abundance should be negatively correlated with the number of habitats occupied because a specialist should do very well where it is found, but be found in only a few places. However, this prediction is contrary to what is typically observed (see Figure 14.2).
The “environmental control” or “superior organism” theory was proposed and later elaborated by James Brown (1984, 1995) to account for differences among species in abundance. Brown began with the premise that species vary in their abilities to exploit nature. This premise is built on Hutchinson’s (1957) concept of the multidimensional niche. A niche is the set of all of the conditions and resources that determine the ability of the individuals of a species to survive and reproduce. A fundamental niche is the set of conditions and resources that the species could use in the absence of competitors (or, by extension, predators, pathogens, and parasites).
Brown assumed that some species have broad fundamental niches, while others have narrow ones. The center of a species’ geographic range, he proposed, is the place where it can exploit the widest range of resource combinations and, therefore, the widest number of habitats. In this region it should be at high abundance. As the distance from this center increases, the conditions favoring the species become less common, because, from its perspective, environmental conditions are deteriorating (since environmental variables tend to be correlated with one another). Therefore, the species’ local habitat specificity narrows and its abundance decreases. Eventually, the edge of its geographic range is reached. Those species that begin with a broad niche will have a large geographic range, while those that begin with narrow niches—that is, with restricted environmental toler- ances—will be rare and have a small geographic range. This theory has similarities to the centrifugal theory of community organization (see Chapter 10).
A major problem with Brown’s theory is that it does not account for the persistence of inferior species. According to the theory, the superior performers should simply overwhelm the inferior ones, eventually replacing them. In all likelihood, both mechanisms (the existence of trade-offs and the superior adaptations of some species) play a role in determining patterns of commonness and rarity.
Evidence relating to Brown’s theory is mixed. An analysis of the abundance and occurrence of plant species in 74 landscapes across the globe found support for his theory (Scheiner and Rey Benayas 1994). Two predictions of the theory were confirmed: first, there was a positive correlation between the number of patches a species occupied and its local abundance, and second,
the most frequent class of species in any given landscape was those found at only a single site, especially in middle- and low-latitude areas.
In contrast, Mark Burgman (1989), in a test using the flora of the mallee vegetation of western Australia, did not confirm the major predictions of Brown’s theory. This region has a mediterranean climate and highly variable soil conditions. The vegetation of the region is characterized by high species richness, with many endemic species, and is dominated by low shrubs and herbaceous perennials. Burgman’s analysis strongly refuted Brown’s “environmental control” theory. It found no support for the hypothesis that rare species have smaller fundamental niches than do widespread, abundant species. The low abundances of the rare plants in this study were not caused by limited environmental tolerances, nor was the high abundance of common plants attributable to wide environmental tolerances. Burgman explained these results by saying that even if a species can tolerate a broad range of environmental conditions, if those combinations of conditions and resources are found in only limited geographic areas or patches, those species will be limited as well.
The flaw in Brown’s theory, therefore, could be the assumption that the range of variation in environmental conditions is positively related to the geographic extent of the range. Imagine, for example, that a plant species can tolerate a wide range of soil textures, from sandy to loamy soils, but that in the environment in which it is found, there are no sandy soils, a few patches with loamy soils, and large areas with clay-loam and clay soils. Then, even though the species could do well on many different soil types, in that environment it will be restricted to a small number of patches and will be rare. The rare species in Burgman’s study appeared to be rare because, although they could tolerate a wide range of environmental conditions, those conditions were found at few sites. In contrast, the conditions tolerated by the common and widespread species were found in many places in Western Australia.
Gaston (1994) and Kunin (1997) list a number of hypotheses proposed to explain what makes a species rare. They suggest that the explanations for the immediate causes of rarity fall into three categories: ecological specialization, lack of dispersal, and historical accident. While various explanations have been proposed for why species become ecologically specialized (Rosenzweig and Lomolino 1997; see also other chapters in Kunin and Gaston 1997), the causes of specialization are not well understood, and the evidence connecting specialization with rarity is limited.
Colleen Kelly (1996; Kelly and Woodward 1996) searched for ecological correlates of commonness and rarity in the floras of Great Britain and Crete. She asked whether there are particular attributes of species that give

PAGE PROOF: 2ND PASS
them wide geographic ranges. She looked at a number of attributes, including growth form, pollination syndrome, and dispersal mechanism. Only growth form (trees were more common than shrubs) and pollination syndrome (wind-pollinated plants were more common than animal-pollinated plants) were found to explain geographic range.
Invasive Species and
Community Susceptibility
Ecologists and environmentalists have become alarmed at the tremendous spread of invasive species in the past few decades because their spread is often associated with the displacement of native species. In some cases invasive species have drastically altered community and ecosystem patterns. Many definitions for invasive species have been proposed, but the term generally refers to species that are rapidly expanding outside of their native range. Invasive species may be native to the general region, but usually are exotics that are far from their native habitats, often from other continents. In most cases they have not dispersed naturally, but have been brought either purposely or inadvertently to a new habitat by people. A large proportion of the plants that have become seriously invasive were deliberately introduced, planted, and cultivated by people (Figure 14.3). Between 2000 and 3000 exotic plant species have been introduced into the United States, most within the last 100 years.
Local Abundance, Diversity, and Rarity 279
Invasiveness is related to, but not exactly the same as, being weedy or ruderal. Weeds are generally defined as uncultivated species that proliferate in agricultural settings, interfering with crop production, although the term has been used in a broader context on occasion. Weeds are often exotic species, but may sometimes be natives that thrive in the conditions of high nutrient and light availability and frequent soil disturbance typical of agricultural fields. Ruderal species possess traits that allow them to do well in temporary habitats, including agricultural fields and roadsides, as well as areas subject to frequent disturbances such as rockslides or flash floods. The word “ruderal” derives from “rude,” in the sense of “wild” or “rough.” While “weedy” and “ruderal” are often used synonymously, the former is typically used in agriculture and the latter is used in ecology.
Ecologists are concerned with a number of questions regarding invasiveness. In this section we ask what makes species successful invaders and what factors make a community susceptible or resistant to invasion by exotic species. In Chapter 22 we return to this topic to look at the ecological effects of invasive species.
Why Do Some Species Become Invasive?
Ecologists have struggled to predict which plants might become invasive for many years. Charles Elton (1958) and Herbert Baker and Ledyard Stebbins (1965) attacked this question four decades ago, tabulating the characteristics and attributes of species known to be success-
(A) |
(B) |
|
Atlantic Ocean |
|
1830s |
|
1900 |
|
1940 |
|
1985 |
Gulf of Mexico |
Isolated |
records–1985 |
Figure 14.3
(A) Lythrum salicaria (purple loosestrife, Lythraceae) is an invasive wetland species that now dominates many marshes and lakes in the northeastern United States. (Photograph courtesy of P. O’Neil.) (B) Purple loosestrife spread across North America over a 150-year period. It may have been introduced into the United States in the 1700s, but it did not begin spreading for a half-century or more. (After Thompson et al. 1987.)

280 Chapter 14 |
PAGE PROOF: 2ND PASS |
ful invaders. But the attempt to successfully predict invasiveness has been a frustrating exercise. Different plant invaders have contrasting strategies: for example, one might have a very high seed output, while another invests in extensive rhizomatous spread. Most of the data addressing this question are qualitative observations of unrelated organisms; such observations are difficult to compare or synthesize across studies. Furthermore, data on failed invasions are, of course, unavailable, leaving us with only half the picture.
Recently, however, there has been progress in understanding what might make some plant species likely to become successful invaders. Rejmánek and Richardson (1996) quantified the traits of 24 species within a single genus—the pines—12 that are highly invasive and 12 that have been widely planted worldwide but have never become invasive. Because the pines are evolutionarily closely related and are ecologically and physiologically similar in many respects, this is a powerful approach for isolating those characteristics that might be closely linked to invasiveness. The researchers analyzed ten life history traits, and found that three were most closely related to invasiveness: reproduction at younger ages, smaller seeds, and large seed crops produced at shorter intervals. Rejmánek and Richardson then applied this information to 34 other pine species that were not in the original data set, but whose invasive status was known, and accurately predicted which of those species were invasive. They also offered a tentative set of rules for predicting woody plant invasiveness (Table 14.3). Mack et al. (2000) discuss more generally the (usually inadequate) attempts of ecologists to predict invasiveness.
Plant invaders may have the ability to grow rapidly in a new environment for several reasons. They may escape from herbivores and parasites that control them in their native environments (see Chapters 7 and 11). Human disturbances may reduce competition from
other plants, allowing invaders to become established and multiply. “Empty niches” may exist in the new communities in which an invader may be able to proliferate. An invasive shrub, for example, might succeed in a forest that has no native shrubs. Finally, invaders may alter ecosystem characteristics in ways that favor their own subsequent increase (see Chapter 22).
Williamson and Fitter (1996) proposed the “tens rule” in an attempt to make (and explain) statistical generalizations about the success of invaders. The tens rule states that 1 in 10 of the plant and animal species brought into a region will escape to appear in the wild, 1 in 10 of those escaped species will become naturalized as a self-sustaining population without cultivation, and of those naturalized species, 1 in 10 will become invasive. Rules of this sort are appealing, but we need to know why (and how well) they hold and when to expect them to fail. Many invasions seem to follow the tens rule, but there are significant exceptions, suggesting that it should be applied with caution.
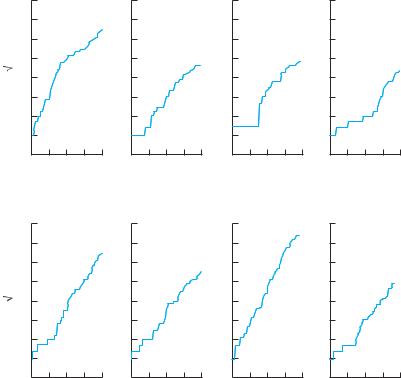
The process by which a species makes the transition from its first introduction to invasive status consists of several phases (Mack et al. 2000). Many invasive species have a long lag phase (Figure 14.4) during which their numbers are low and they are not particularly noticeable. This lag phase may be brief or may last well over a century. Because most introduced species disappear during this lag phase (see the tens rule above), it is difficult to tell during this period which introduced species are headed for extinction and which for invasive status.
Populations of successful invaders increase during this period even though their total numbers are still low. Many invasive plant species are introduced not once, but multiple times, and at multiple sites, during the lag phase. At some point, however, the population begins to grow rapidly and at an accelerating pace in both numbers and area occupied—at this point, the species has
Table 14.3 Tentative rules for predicting which woody seed plants are likely to become invasive
|
|
Opportunities for vertebrate dispersal |
|
|
Z* |
Type |
Absent |
Present |
|
|
|
|
|
|
> 0 |
Dry fruits and |
Likely invasive |
Very likely invasive |
|
|
seed mass > 2 mg |
|
|
|
|
Dry fruits and |
Likely invasive in |
|
|
|
seed mass < 2 mg |
wet habitats |
|
|
|
Fleshy fruits |
Unlikely invasive |
Very likely invasive |
|
< 0 |
All |
Noninvasive unless |
Possibly invasive |
|
|
|
dispersed by water |
|
|
Source: Rejmánek and Richardson 1996.
*Z = 19.77 – 0.15√ M – 3.14√ J – 1.21S, where M = mean seed mass (mg), J = minimum juvenile period (years), and S = mean interval between large seed crops (years). Z is thus a function that integrates several life history traits.
PAGE PROOF: 2ND PASS
Local Abundance, Diversity, and Rarity 281
8 |
|
area) |
|
Spread ( |
|
0 |
Final |
Initial |
|
(I) |
(F) |
8 |
|
area) |
|
Spread ( |
|
0 |
F |
I |
I |
F |
|
Time |
I |
F |
|
Time |
I |
F |
I |
F |
I |
F |
I |
F |
Figure 14.4
Some outcomes for a spatially explicit simulation model of the spread of an invasive species in a new environment. In this model, about half the time, the rate of spread is slow at first, then becomes more rapid as the invading species begins to more fully occupy the new habitat. This pattern corresponds to the lag phase seen in many actual plant invasions that have been documented, in which the rate of spread is unnoticeable at first, sometimes for decades to hundreds of years, but at some point becomes very rapid. (Model results taken from Hastings 1996.)
become invasive. Ultimately the invader reaches new geographic and ecological limits at which its population stabilizes.
What Makes a Community Susceptible to Invasion?
Various predictions have been made regarding the factors that make communities vulnerable to invasion. Some kinds of communities appear to be highly susceptible to invasion by exotic species, while others appear better able to resist invasion. In his classic study reviewing invasions by plants and animals, Elton (1958) hypothesized that invaders were most likely to become established in disturbed and species-poor communities.
While most ecologists continue to believe that disturbance is a critical factor in promoting invasion, there is conflicting evidence on its role, and its effects may differ among communities (Lodge 1993). In a native grassland community in Kansas, for example, Smith and Knapp (1999) showed that increased disturbance (annual burning) strongly decreased invasion by exotic species.
Furthermore, disturbance clearly encompasses more than a single factor; it may reflect changes in factors as diverse as soil surface microclimates, predator-prey relationships, resource availability, and competitive interactions (Orians 1986). Rigorous data appropriate for testing the importance of disturbance, or of its many
different effects, remain very limited (Lodge 1993; Rejmánek 1989). In examining the role of disturbance in promoting or inhibiting invasion, elucidating the effects of specific factors (such as soil disturbance, logging, or fire) is a much more satisfactory approach than lumping those factors together into a general category.
Likewise, evidence as to whether species-poor communities are indeed more vulnerable to invasion is limited and contradictory. In a recent review, Levine and D’Antonio (1999) evaluated data and theory linking diversity and biological invasions. They found that while both classic and recent theory predicted that more diverse communities would be more resistant to invasion (e.g., Elton 1958; Tilman 1999), data from experimental and descriptive studies were ambiguous. Some studies supported this predicted relationship and others refuted it.
Two recent studies in grasslands showed negative relationships between vulnerability to invasion and both species and functional group diversity (Tilman et al. 1997; Symstad 2000). Other recent studies, however, have shown the opposite pattern. Thomas Stohlgren and his colleagues (1999) studied the relationship between plant species richness and invasions in the Colorado Rockies and in the Central Great Plains of western North America across a wide range of plant community types (including forests, meadows, and grasslands) and over

282 Chapter 14 |
PAGE PROOF: 2ND PASS |
(A) |
|
|
|
|
|
|
|
|
|
|
|
|
|
|
|
|
|
20 |
|
Central grassland sites |
|
|
|
|
|
|
Tallgrass |
||||||
|
|
|
|
|
|
|
|
|||||||||
|
|
|
|
|
|
|
|
|
||||||||
richness |
|
|
|
|
|
|
|
|
|
|
Northern |
|||||
|
|
|
|
|
|
|
|
|
|
prairie |
||||||
|
15 |
|
|
|
|
|
|
|
|
|
mixed |
|||||
|
|
|
|
|
|
|
|
|
|
|
|
|||||
|
|
|
|
|
|
|
|
|
|
|
|
|||||
species |
|
|
|
|
|
|
|
|
|
|
prairie |
|
|
|||
10 |
|
|
|
|
|
|
|
|
|
|
|
Mixed |
|
|
||
Exotic |
5 |
|
|
|
|
|
|
|
|
|
|
|
prairie |
|
|
|
|
|
|
|
|
|
|
|
|
|
|
|
|
|
|||
|
|
|
|
Shortgrass steppe |
|
|
|
|
|
|
|
|
||||
|
|
|
|
|
|
|
|
|
|
|
|
|||||
|
|
|
|
|
|
|
|
|
|
|
|
|
||||
|
0 |
|
|
|
|
|
|
|
|
|
|
|
|
|
|
|
|
|
|
|
|
|
|
|
|
|
|
|
|
|
|
|
|
|
|
35 |
40 |
45 |
50 |
55 |
60 |
65 |
||||||||
|
30 |
|||||||||||||||
|
|
|
|
|
|
Native species richness |
|
|
|
|
||||||
(B) |
|
|
|
|
|
|
|
|
|
|
|
|
|
|
|
|
|
12 |
|
Colorado Rockies |
|
|
|
|
|
|
|
|
|||||
|
|
|
|
|
|
|
|
|
|
|||||||
richness |
11 |
|
|
|
|
|
|
|
|
|
|
|
|
Aspen |
||
|
|
|
|
|
|
|
|
|
|
|
|
|||||
|
|
|
|
|
|
|
|
|
|
|
|
|
||||
8 |
|
|
|
|
|
meadow |
|
|
|
|
|
|
|
|
||
|
10 |
|
|
|
|
|
|
|
|
|
|
|
|
|
|
|
species |
9 |
|
Ponderosa |
Wet |
|
|
|
|
|
|
|
|
||||
|
|
|
|
|
|
|
|
|
||||||||
6 |
|
|
|
|
|
|
|
|
|
|
|
|||||
|
|
|
|
|
|
|
|
|
|
|
||||||
Exotic |
7 |
|
pine |
|
|
|
|
|
|
|
|
|
|
|
|
|
|
|
|
|
|
|
|
|
|
|
|
|
|
||||
4 |
|
|
|
|
|
|
|
|
|
|
|
|
|
|||
|
|
|
|
|
|
|
|
|
|
|
|
|
||||
|
5 |
|
|
|
Dry meadow |
|
|
|
|
|
|
|
|
|||
|
3 |
|
|
Lodgepole pine |
|
|
|
|
|
|
|
|
||||
|
|
|
|
|
|
|
|
|
|
|
||||||
|
|
|
|
|
|
|
|
|
|
|
||||||
|
2 |
|
|
|
|
|
|
|
|
|
|
|
|
|
|
|
|
|
|
|
|
|
|
|
|
|
|
|
|
|
|
|
|
|
|
70 |
80 |
90 |
100 |
110 |
120 |
130 |
||||||||
|
60 |
|||||||||||||||
Native species richness
Figure 14.5
The relationship between native species richness and exotic species richness in the central Great Plains grasslands (A) and in the Colorado Rockies (B). The results are based on lists of species in 1000-square-meter plots of each vegetation type. Results of linear regressions (grasslands: r2 = 0.85,
P = 0.078; Rockies, r2 = 0.81, P = 0.038). (After Stohlgren et al. 1999.)
a range of spatial scales. They concluded that exotic species primarily invaded areas of high species richness (Figure 14.5). In a survey of 184 sites distributed globally, Lonsdale (1999) also found a positive relationship (on a landscape scale) between the degree of invasion and native species richness.
The same positive relationship between native species richness and invasion by exotics holds in systems as diverse as the South African fynbos (Higgins et al. 1999), New Zealand mountain beech forests (Wiser et al. 1998), and Great Plains grasslands (Smith and Knapp 1999). In a review of plant invasions globally, Levine (2000) states that, in general, the most diverse plant communities are the most likely to be invaded.
Variation in resource availability has been proposed as an underlying cause for the positive association between native and invasive species diversity. This factor
may be particularly important in systems on soils with low soil nutrient resources, such as soils on glacial outwash (e.g., Long Island, New York) and very old soils (e.g., Australia). A study of Long Island forest communities found that soil characteristics are critical in the facilitation or inhibition of invasion by exotic species (Howard et al., unpublished). There was a strong positive relationship between both nitrogen and calcium levels and plant invasions, and a weaker but also positive relationship between phosphorus levels and invasions. This study also found a strong positive relationship between native species diversity in forests and the degree to which those forests had been invaded by exotic species.
These results echo the pioneering experimental work of Hobbs (1989) in Australia, which showed that disturbance alone did not make a plant community susceptible to invasion, but that disturbance coupled with the addition of soil nutrients greatly facilitated invasion. Clearly, more information is needed before we can definitively answer why plant communities differ so much in their likelihood of becoming invaded by exotic species.
Abundance and Community Structure
As we have just seen, species can be rare or common within a community. They may be long-term or shortterm dominants, or they may be invading the community. If we shift our focus from individual species to the entire plant community, we recognize that communities may differ greatly in the number of species present and in the degree to which individual species are dominant. In other words, there are great differences in species richness and diversity among communities. Total biomass also differs greatly among communities, as does pro- ductivity—the rate of energy flow through a trophic level (see Chapter 15). What are some of the causes of these contrasts among communities? Are variations in these different aspects of communities causally related?
Various hypotheses have been proposed to explain the observed relationships between relative species abundances and the productivity and diversity of communities, and we briefly discuss some of those hypotheses here. We examined some of the causes of species diversity in Chapters 10, 11, and 13. Hypotheses explaining differences in species diversity at local and regional scales have been reviewed by Rosenzweig (1992), Huston (1994), Ricklefs and Schluter (1993), and Tilman (1982). We will examine patterns and possible explanations for differences in species diversity at larger spatial scales in Part V.
Productivity and Diversity
Productivity can affect community structure in a variety of ways. If rates of herbivory and decomposition differ little between communities, a community with higher