

Photosynthesis and the Light Environment 33
(A)
C3 grasses |
C4 grasses |
Shrubs |
(B) |
Relative abundance key |
|
|
|
|
|
|
|
|
|
|
|
||||||||||||
100 |
|
|
0 |
|
|
|
|
|
|
|
|
|
|
||||||||||
|
|
|
|
|
|
|
|
|
|
|
|
||||||||||||
|
|
|
|
|
|
|
|
|
|
|
|
|
|
|
|
|
|
|
|
|
|
|
Figure 2.19 |
|
|
|
|
|
|
|
|
|
|
|
|
|
|
|
|
|
|
|
|
|
|
|
|
|
|
|
|
|
|
|
|
|
|
|
|
|
|
|
|
|
|
|
|
|
|
|
C3 grasses, C4 grasses, and shrubs are the domi- |
|
C4 grasses |
|
|
|
|
|
|
|
|
|
|
C3 grasses |
|
nant functional groups in the central part of |
|||||||||
|
|
|
|
|
|
|
|
|
|
||||||||||||||
|
|
|
|
|
|
|
|
|
|
|
|
|
|
|
|
|
|
|
|
|
|
|
North America, which is dominated by grass- |
|
|
|
|
|
|
|
|
|
|
|
|
|
|
|
|
|
|
|
|
|
|
|
|
|
|
|
|
|
|
|
|
|
|
|
|
|
|
|
|
|
|
|
|
|
|
|
lands and shrublands. The maps indicate the |
|
|
|
|
|
|
|
|
|
|
|
|
|
|
|
|
|
|
|
|
|
|
|
relative abundances of each as an approximate |
|
|
|
|
|
|
|
|
|
|
|
|
|
|
|
|
|
|
|
|
|
|
|
percentage of the total biomass. (A) C4 grasses |
|
|
|
|
|
|
|
|
|
|
|
|
|
|
|
|
|
|
|
|
|
|
|
are the most abundant species in the southern |
|
|
|
|
|
|
|
|
|
|
|
|
|
|
|
|
|
|
|
|
|
|
|
plains, while C3 grasses predominate farther to |
|
|
|
|
|
|
|
|
|
|
|
|
|
|
|
|
|
|
|
|
|
|
|
|
|
|
|
|
|
|
|
|
|
|
|
|
|
|
|
|
|
|
|
|
|
|
100 |
the west and north. Shrubs are most abundant |
|
|
|
|
|
|
|
|
|
|
|
|
|
|
|
|
|
|
|
|
|
|
||
0 |
|
|
|
|
|
|
|
|
|
|
|
|
|
|
|
|
|
|
|
|
|
in the far west. (B) The combined abundances of |
|
100 |
|
|
|
|
|
|
|
Shrubs |
0 |
|
C4 grasses, C3 grasses, and shrubs, as indicated |
||||||||||||
|
|
|
|
|
|
|
|
|
|
|
|
|
|
|
|
|
|
|
|
by the key. (After Paruelo and Lauenroth 1996.) |
|||
34 |
Chapter 2 |
|
|
|
|
|
|
|
|
50 |
C4 grasses |
|
|
|
|
|
|
|
|
|
|
|
|
|
||
|
|
Absent |
Present |
|
|
|
|
|
|
40 |
|
|
|
|
Shrubs |
|
|
(°N) |
|
|
|
|
|
|
||
|
|
|
|
|
|
|
|
|
Latitude |
|
|
|
|
Present |
Absent |
|
|
|
|
|
|
|
|
|
|
|
|
|
Present |
|
|
|
|
|
|
|
30 |
Absent |
|
|
|
|
|
|
|
|
|
|
C3 grasses |
|
|
|
|
|
120 |
115 |
110 |
105 |
100 |
95 |
90 |
85 |
|
|
|
|
Longitude (°W) |
|
|
|
|
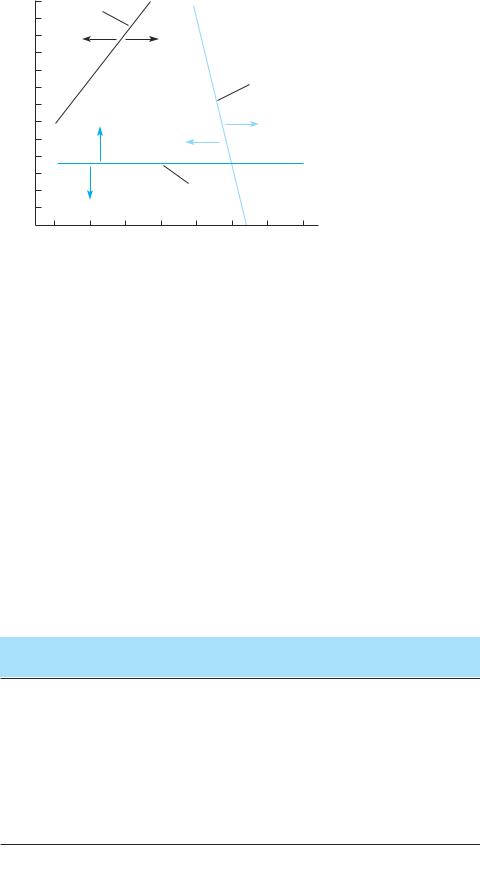
Figure 2.20
Results of a model with lines showing the latitude and longitude where C3 grasses, C4 grasses, and shrubs are predicted to be absent or present within the region of North America. The distributions of C4 grasses and shrubs are largely influenced by longitude, while C3 grasses are influenced by latitude. The predictions of this model were largely in agreeement with the distribution patterns shown in Figure 2.19. (After Paruelo and Lauenroth 1996.)
a greater proportion of rainfall during the winter months. Shrubs, with deep roots that increase their access to water stored deep in the soil, are most abundant as total rainfall decreases and as the proportion of winter rainfall increases. Consequently, the southeastern portions of the great North American grasslands (west of 90° longitude) are dominated by C4 grasses. C3 grasses increase to the north and to the west, and the westernmost, driest part of this region is dominated by (largely C3) shrubs (Figure 2.20; see also Figure 18.25).
Other research has documented changes with altitude, from a vegetation dominated by C4 species in the warm, often dry habitats at low altitudes to a C3-domi- nated flora in the cooler, moister conditions at high altitudes, in Kenya, Costa Rica, Hawaii, Arizona, and Argentina. CAM species are, as one might expect from their superior water use efficiencies, most closely associated with aridity in temperate and semiarid regions.
These studies of correlations between climate and photosynthetic type all share a common limitation, however. It is possible that their results are due, to some unknown extent, to historical phylogenetic factors that link the distributions of related species to climate and biogeography, regardless of photosynthetic type. C4 photosynthesis, for example, is most likely to have evolved in families that are found in warm environments, and therefore C4 species in those families, like their C3 relatives, should have numerous adaptations to living in those environments, irrespective of the pathway used to fix CO2. Tropical C4 grasses do not perform well in cold temperatures; neither do tropical C3 grasses. These factors make it somewhat difficult to disentangle the adaptive significance of photosynthetic type from all of the other adaptations of species of contrasting types. This is a particularly big problem in disentangling the possible ecological significance of the C4 subtypes, which are almost totally confounded with phylogenetic groups. We discuss this problem in a more general context in Chapter 6.
Nevertheless, there is abundant evidence, derived from a variety of approaches, that C4 and CAM photosynthesis are adaptations to environmental factors, and we have a fairly clear idea of what those factors are, as well as the mechanistic bases for the adaptations. Keep in mind that the above discussion concerns general patterns of association between physiology and climate. There are many C3 species that live in hot, dry places, and a few C4 species that live where it is cold most of the
Table 2.2 Contrasts between sun leaves and shade leaves of Fagus sylvatica (beech, Fagaceae)
Character |
Sun leaves |
Shade leaves |
Stomatal density (number/mm2) |
214 ± 26 |
144 ± 11 |
Leaf thickness ( m ) |
185 ± 12 |
93 ± 5 |
Leaf area (cm2) |
29 ± 4 |
49 ± 7 |
Fresh weight (g) |
0.5 ± 0.1 |
0.4 ± 0.1 |
Dry weight (g) |
0.24 ± 0.03 |
0.12 ± 0.02 |
Water content (% fresh weight) |
53 ± 4 |
70 ± 5 |
Total chlorophyll (mg/g dry weight) |
6.6 ± 2 |
16.1 ± 2 |
Total chlorophyll on a leaf area basis |
5.5 ± 1.8 |
3.9 ± 0.4 |
(mg/100 cm2) |
|
|
Source: Lichtenthaler et al. 1981.
Note: Values are means of 9 leaves ± 1 standard deviation.

Photosynthesis and the Light Environment 35
(A)Epidermis
Vascular bundle
Palisade cells |
(B) |
Epidermis |
Vascular bundle
100 mm
Spongy |
Figure 2.21 |
|
Cross sections of leaves of Thermopsis montana (golden banner, |
||
mesophyll |
||
Fabaceae) grown in two different light environments. (A) Leaf |
||
cells |
||
grown in sun. (B) Leaf grown in shade. Note in these scanning |
||
|
||
Epidermis |
electron micrographs that the sun leaf is much thicker and that |
|
|
its palisade parenchyma cells are much longer than those of the |
|
|
shade leaf. (Photographs courtesy of T. Vogelmann.) |
time. While general patterns may be very revealing, they cannot explain everything, and photosynthetic type is only one of a host of factors that determine how a plant interacts with its environment.
Adaptations to the Light Environment
Sun and Shade Leaves
A leaf that functions well in bright sunlight usually will not perform well in deep shade, and the reverse is also true. Many species of plants produce different kinds of leaves in the sun and in the shade (Figure 2.21). Leaves at the top of a tree, for example, may differ in a variety of ways from those deep within the canopy. “Sun leaves” are typically smaller in size (leaf area) and thicker than “shade leaves,” with greater leaf mass per leaf area (LMA, also called specific leaf mass or weight, dry mass per unit leaf area; the inverse, specific leaf area, or leaf area per gram of dry mass is often reported). They also tend to have higher concentrations of rubisco, chlorophyll, and other key components of both the light reactions and carbon fixation, per unit leaf area (Table 2.2).
In some plants, sun and shade leaves can also have different shapes, with deeper lobing, for example, in leaves produced in bright sunlight. As a consequence of the greater investments made in the machinery of photosynthesis, sun leaves usually have much higher light saturation levels and greater maximum photosynthetic rates than shade leaves (Figure 2.22). Shade leaves often have lower rates of cellular respiration, perhaps because there is less “machinery” to maintain, and they may have higher net rates of photosynthesis at low light levels, with lower light compensation points.
The ability of individual plants to produce different kinds of leaves in different light environments is an
example of phenotypic plasticity, the ability of an individual of a given genotype to produce different structures (such as leaf tissues) or to function differently under different environmental conditions (see Chapter 5). This flexibility in response can also be called an acclimation (a type of plasticity that involves potentially reversible adjustments to environmental conditions).
Not all acclimation to changes in light levels is through the production of different types of leaves. In the study of northeastern forest understory species discussed above (Rothstein and Zak 2001), the shifts in light
) |
4.0 |
|
|
|
|
|
|
|
|
|
|
|
|
|
|
|
|
|
|
|
|
|
|
|
|
|
|
|
|
|
|
|
|
|
|
|
|
|
|
–1 |
|
|
|
|
|
|
|
|
|
|
|
|
|
|
|
|
|
|
|
h |
|
|
|
|
|
|
|
|
|
|
|
|
|
|
|
|
|
|
|
|
|
|
|
|
|
|
|
|
|
|
|
|
|
|
|
|
|
|
|
–2 |
3.0 |
|
|
|
|
|
|
|
|
|
|
|
Sun leaves |
|
|
|
|||
|
|
|
|
|
|
|
|
|
|
|
|
|
|
||||||
100 cm |
2.0 |
|
|
|
|
|
|
|
|
|
|
|
|
|
|
||||
|
|
|
|
|
|
|
|
|
|
|
|
|
|
|
|
|
|
||
|
|
|
|
|
|
|
|
|
|
|
|
|
|
|
|
|
|
||
(mg |
|
|
|
|
|
|
|
|
|
|
|
|
|
|
|
|
|
|
|
|
|
|
|
|
|
|
|
|
|
|
|
|
|
|
|
|
|
|
|
|
|
|
|
|
|
|
|
|
|
|
|
|
|
|
|
|
|
|
|
|
|
|
|
|
|
|
|
|
|
|
|
|
|
|
|
|
|
|
|
|
|
|
|
|
|
|
|
|
|
|
|
|
|
|
|
|
|
|
|
uptake |
1.0 |
|
|
|
|
|
|
|
|
|
|
|
|
Shade leaves |
|
||||
|
|
|
|
|
|
|
|
|
|
|
|
|
|
||||||
2 |
|
|
|
|
|
|
|
|
|
|
|
|
|
|
|
|
|
|
|
|
|
|
|
|
|
|
|
|
|
|
|
|
|
|
|
|
|
|
|
|
|
|
|
|
|
|
|
|
|
|
|
|
|
|
|
|
|
|
|
|
|
|
|
|
|
|
|
|
|
|
|
|
|
|
|
|
|
|
|
CO |
0 |
|
|
|
|
|
|
|
|
|
|
|
|
|
|
|
|
|
|
|
|
|
|
|
|
|
|
|
|
|
|
|
|
|
|
|
|
||
|
–1.0 |
|
|
|
|
|
|
|
|
|
|
|
|
|
|
|
|
|
|
|
|
|
|
|
|
|
|
|
|
|
|
|
|
|
|
|
|
|
|
|
|
|
250 |
500 |
750 |
|
1000 |
|
|||||||||||
|
0 |
|
|
|
|
||||||||||||||
PPFD ( mol m–2 s–1)
Figure 2.22
Photosynthetic CO2 uptake in response to light intensity for sun leaves and shade leaves of Fagus sylvatica (beech, Fagaceae) on a leaf area basis (mg CO2/100 cm2/h), showing the midpoint and range for nine different sun leaves and nine different shade leaves. The sun leaves become light-sat- urated at much higher light intensities, and the maximum photosynthetic rates are much higher for sun leaves. (After Lichtenthaler et al. 1981.)

36 Chapter 2
compensation point in Viola pubescens and Tiarella cordifolia were due to physical and chemical changes within individual leaves, rather than the plant producing different kinds of leaves in different seasons.
Species’ Adaptations to High and Low Light Habitats
Contrasts between the leaves of plants that are native to high light environments and the leaves of plants from shaded habitats are similar in many ways to contrasts between sun leaves and shade leaves produced by the same individual. Species adapted to bright habitats frequently have costs or specializations that would put them at a disadvantage in deep shade, and the reverse is also true; in many cases plants could not survive in environments with drastically different light regimes. For example, the high investments in rubisco and chlorophyll and higher respiration rates that generally characterize the leaves of plants from high light environments would not be sustainable in deeply shaded habitats.
Unlike the more general differences between sun and shade leaves on the same plant, species native to high light or low light habitats also have a number of unique features. One such character is solar tracking. Irwin Forseth and James Ehleringer (1982) found that many desert annuals and some perennials from warm deserts—a high light environment—have leaves that track the sun across the sky during the day. This strategy increases the amount of light available to the chloroplasts over the course of the day (Figure 2.23), thereby increasing photosynthetic rates and presumably subsequent growth rates.
Why should solar tracking be advantageous in the bright, sunny environment of a desert? In desert environments, water is available for growth for only a small part of the year, and desert annuals, in particular, often germinate, grow, and reproduce in a very short time before water becomes unavailable and they die. Solar trackers are adapted to maximize their light capture in the short growth period available to them. In North American deserts, the proportion of species that are solar trackers becomes greater as the length of the growing season gets shorter. We discuss adaptations to desert environments in more detail in Chapter 3.
Some plants that live in deeply shaded habitats also have unique features. The small understory species that live in the extreme shade of humid tropical forests possess a number of unique adaptations to the quality and quantity of light available to them. Light intensities at the rainforest floor may be less than 1% of the PPFD at the top of the canopy. Characters such as velvety or satiny leaf surfaces and blue iridescence are found in widely divergent species in understory habitats (Lee and Graham 1986). Each of these characters appears to enhance the light available for photosynthesis slightly. That slight advantage in such an extreme environment
) |
2500 |
|
|
|
|
|
|
|
|
|
|
Solar-tracking leaf |
||||
|
|
|
|
|
|
|
|
|
|
|||||||
|
|
|
|
|
|
|
|
|
|
|
||||||
–1 |
|
|
|
|
|
|
|
|
|
|
|
|
|
|
|
|
s |
|
|
|
|
|
|
|
|
|
|
|
|
|
|
|
|
–2 |
|
|
|
|
|
|
|
|
|
|
|
|
|
|
|
|
m |
2000 |
|
|
|
|
|
|
|
|
|
|
|
|
|
|
|
( mol |
|
|
|
|
|
|
|
|
|
|
|
|
|
|
|
|
|
|
|
|
|
|
|
|
|
|
|
|
|
|
|
||
|
|
|
|
|
|
|
|
|
|
|
|
|
|
|
|
|
nm) |
1500 |
|
|
|
|
|
Horizontal leaf |
|
|
|
|
|
||||
(400–700 |
|
|
|
|
|
|
|
|
|
|
||||||
|
|
|
|
|
|
|
|
|
|
|
|
|
|
|
||
|
|
|
|
|
|
|
|
|
|
|
|
|
|
|
|
|
flux |
1000 |
|
|
|
|
|
|
|
|
|
|
|
|
|
|
|
photon |
|
|
|
|
|
|
|
|
|
Vertical |
|
|
|
|||
|
|
|
|
|
|
|
|
|
|
|
|
|
||||
|
|
|
|
Cupped leaf |
|
|
east-west leaf |
|
|
|
||||||
Incident |
500 |
|
|
|
|
|
|
|
|
|
|
|
||||
|
|
|
|
|
|
|
|
|
|
|
|
|
|
|
||
|
|
|
|
|
|
|
|
|
|
|
|
|
|
|
|
|
|
0 |
|
|
|
|
|
|
|
|
|
|
|
|
|
|
|
|
|
|
|
|
|
|
|
|
|
|
|
|
|
|
|
|
|
|
|
8 |
10 |
12 |
14 |
16 |
18 |
||||||||
|
6 |
|||||||||||||||
Hour of day
Figure 2.23
The amount of light received over the course of a midsummer day in the desert by a solar tracking leaf, a leaf held horizontally (in which case the light received in the early morning and late afternoon is sharply reduced), a leaf held vertically (in which case the light received during the middle of the day is sharply reduced), and a cupped leaf. The solar tracking leaf receives at least 38% more light than the fixed horizontal or vertical leaves. (After Ehleringer 1985.)
may, however, make the difference between life and death.
In some species, a velvety sheen is produced by epidermal cells, which act as lenses to focus light onto chloroplasts. Lee (1997) studied the intense, metallic blue iridescence found in the leaves of many plants in equatorial rainforests and found that it may serve to help them to absorb light more efficiently. In this environment, light in the photosynthetically most usable range, 400–700 nm, is particularly depleted because it has been absorbed by the plants in the canopy above. Working somewhat like the coating on a camera lens, the color of these leaves may enable them to absorb more light at the longest photosynthetically useful wavelengths, which are less depleted than the shorter wavelengths. The blue iridescence in such leaves is not produced by blue pigments, but is a structural effect (Box 2C).
All understory environments are not uniformly dark, however. The light environment is changing constantly, dim one moment and illuminated by the brilliant flash of a sunfleck the next (Figure 2.24). Shade-adapt- ed species appear to be capable of using brief sunflecks with unusual efficiency. Studies by Robin Chazdon and Robert Pearcy (1991) and their colleagues suggest that,

Photosynthesis and the Light Environment 37
BOX 2C
Leaf Iridescence and Structural Coloration
Structural coloration is caused by the way light bounces off physical surfaces with particular optical properties. It can be created by simple or very complex microscopic structures in both plants and animals. In the case of iridescent blue leaves, the optical effect is caused by thin-film interference within the leaf, which results from multiple layers (usually in the cell walls) of materials
that alternatively transmit or reflect particular wavelengths of light.
Similar optical interference or, alternatively, scattering of blue light by small particles is responsible for the structural blues found in many animals as well. The blues of butterfly wings, the brilliant blue colors found in some beetles, the amazing blue feathers of peacocks and the more modest blues of
blue jays, the blue rump of the baboon, and the blue eyes of some humans and cats are all due to these optical phenomena rather than to blue pigment. Blue colors in plants may also be produced by blue pigments such as anthocyanins. No blue pigment has ever been found in a vertebrate.
while understory plants in both temperate and tropical forests are capable of surviving well in very low light, they depend on the energy captured from occasional sunflecks to be able to grow and reproduce. A large proportion (up to half) of the carbon gained by understory plants may come from energy captured from sunflecks.
The ability of these forest floor species to capture the energy available in brief, unpredictable episodes of direct bright light depends on several adaptations that make them able to respond quickly and with great efficiency to that light. These adaptations include stomata that open even in dim light and a high electron transport capacity (a function of the light reactions) relative to carboxylation capacity (the capacity to carry out the initial
fixation of CO2). These plants also exhibit a slow loss of photosynthetic induction (the necessary start-up time for plants to reach maximum photosynthesis after exposure to bright light), so that once “primed” by a sunfleck, they remain capable of more fully responding to other sunflecks.
The ability of some shade-adapted species to capture and use sunflecks and light coming into the canopy at steep angles early in the morning and in the late afternoon may be enhanced by their having irregularly oriented grana stacks, in contrast to the neatly aligned grana of sun leaves, which are stacked perpendicular to the leaf’s surface. That irregular orientation would mean that at least some grana would be directly aligned with
Figure 2.24
Sunflecks on leaves of Geonoma cuneata (Arecaceae) in the understory of a tropical forest. (Photograph courtesy of R. Chazdon.)
38 Chapter 2
incoming light, regardless of the direction from which the light came. These plants may also have various adaptations that prevent them from being damaged by the intense sunlight in patches and flecks that may briefly illuminate the deep shade.
Do Sun and Shade Adaptations Exist within Species?
More controversial than the existence of species adapted to high and low light conditions is the question of whether, within a single species, there exist ecotypes (genetically distinct populations within a single species, adapted to local conditions; see Chapter 6) adapted to sunny spots and other ecotypes adapted to shaded habitats. This idea was first proposed in the 1960s based on comparisons of populations of several species collected from sunny and shaded habitats, including Solidago virgaurea (Asteraceae), Rumex acetosa (Polygonaceae), Geum rivale (Rosaceae), Dactylis glomerata (Poaceae), and Solanum dulcamara (Solanaceae). These studies reported that genetically distinct populations of these plants existed, with some adapted to high light environments and others adapted to shade, and went on to describe the physiological adaptations of these ecotypes in detail (for example, see Björkman and Holmgren 1966; Björkman 1968). The results of this research became widely accepted.
However, there were several basic problems with the research upon which these results were based. We discuss these problems here not only because this question is inherently interesting, but also because this case provides some insight into the scientific process and the role controversy sometimes plays in that process. While the original physiological work was innovative and of high caliber, not enough attention was paid to the pop- ulation-level aspects of the question. First, only one to three individuals were sampled from each population. These sample sizes were so small that it was impossible to know whether the differences found were real biological differences between sun and shade populations or were due merely to chance. How reliably did these few individuals represent the populations from which they were drawn? A second limitation of the original studies was that the sun and shade populations sampled were often located far apart (sometimes by hundreds of kilometers) from one another. Were the hypothesized differences due to sunny versus shaded habitats or to other differences between the habitats?
To overcome these methodological difficulties, John Clough and his colleagues (Clough et al. 1979) sampled 15 individual plants of S. dulcamara (Figure 2.25) that were growing in sunny sites (100% full sun) and 15 individuals from shady locations (< 10% of full sun) separated by only 25 meters in northern Illinois. Cuttings were made from each plant and grown in an array of different light, water, and temperature treatments. While
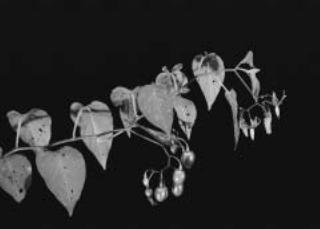
Figure 2.25
Solanum dulcamara (nightshade, Solanaceae), a European species that has become a common weedy vine in the eastern and central United States. Its common name hints at its poisonous leaves and berries. In England it is also called snakeberry and witchflower, and was reputed to be helpful against witchcraft. (Photograph © J. Wexler/Visuals Unlimited.)
these researchers did find genetic differences in photosynthetic traits among individual plants, the sun and shade populations did not differ from each other on average, and did not differ at all with regard to traits associated with hypothesized sun/shade differences. Rather, all individuals adjusted their physiology and morphology to their growth conditions. Research has continued in the effort to find evidence for the existence of within-species sun and shade ecotypes in these and other species (for example, Sims and Kelley 1998).
Day Length: Responses and Adaptations
Another aspect of the light environment that is important to plants is day length. Plants can detect, quite precisely, not only how long the day (or actually, the night) is, but they can also determine whether day length is increasing (as it does in spring) or decreasing (as it does in autumn). Day length is often a more reliable indicator of season than is temperature or other more proximate cues, and plants can make use of this information to time important phenological events, including flowering, the onset of dormancy, or leaf fall. Even many seeds are capable of detecting day length (usually via the seed coat) and using this information to determine when to remain dormant and when to begin the process of germination. Day length is often used together with other environmental cues, including temperature and moisture.
In some species, genetic variation in both the sensitivity and the nature of the response to day length exists.

In the widespread arctic/alpine species Oxyria digyna (alpine sorrel, Polygonaceae), populations from California, Wyoming, and Colorado flower when the daylength is about 15 hours. In populations from near the Canada–United States border, some plants will flower in 15 hour daylength, but many will not. In populations from north of the Arctic Circle, flowering requires a daylength of over 20 hours (Mooney and Billings 1961; Billings and Mooney 1968).
Thus, the onset of flowering occurs in mid-May both at the Canada–United States border and north of the Arctic Circle, although at the border daylengths are 15
hours at this time, while at the Arctic Circle they are 20 hours. The more southern, high elevation populations do not reach 15 hour daylengths until midto late-June. These alpine populations may still be under snow in mid-May, with a high probability of frost, and do not flower until about a month later than the more northern populations.
Although plant sensitivity to day length was first discovered in the 1920s, its mechanistic basis is still not fully understood, and depends in part on some unknown biological clock. It is known, however, that phytochromes—bluish pigments that exist in several different forms that respond to light—play a major role in the photoperiodic timing mechanism. Phytochromes play a role in a number of the ways in which plants detect and respond to various aspects of light in their environments (see Chapter 5).
Additional Readings
Classic References
Kramer, P. J. 1981. Carbon dioxide concentration, photosynthesis, and dry matter production. BioScience 31: 29–33.
Mooney, H. A. and W. D. Billings. 1961. Comparative physiological ecology of arctic and alpine populations of Oxyria digyna. Ecol. Monogr. 31: 1–29.
Von Caemmerer, S. and G. D. Farquhar. 1981. Some relationships between the biochemistry of photosynthesis and the gas exchange of leaves. Planta 153: 376–387.
Contemporary Research
Cushman, J. C. and A. M. Borland. 2002. Induction of Crassulacean Acid Metabolism by water limitation. Plant Cell Environ. 25: 295–310.
Thomas, S. C. and W. E. Winner. 2002. Photosynthetic differences between saplings and adult trees: An integration of field results by meta-analysis.
Tree Physiol. 22: 117–122.
Photosynthesis and the Light Environment 39
Summary
The process of photosynthesis consists of two parts, the light reactions, in which light energy is captured, and the Calvin cycle, in which carbon is fixed. The rate at which photosynthesis proceeds depends on the amount and quality of the light reaching the chloroplasts, the CO2 concentration gradient between the air and the chloroplasts, and conductance to CO2.
There are three different photosynthetic pathways: C3, C4, and CAM photosynthesis. C3 photosynthesis is ancestral to the other types and is the most common. C3 plants rely on the enzyme rubisco to capture CO2 from the atmosphere. Because rubisco also catalyzes photorespiration, photosynthetic rates can be severely limited for C3 plants under warm, bright conditions. C4 and CAM photosynthesis are evolutionary specializations that overcome the limitations of rubisco in such environments. Each offers advantages under particular environmental conditions and is at a disadvantage under other conditions.
Numerous adaptations exist among species adapted to high or low light environments. These adaptations confer advantages in the environment to which the species are adapted, but cause them to function more poorly in other environments. Some individual plants can produce leaves with different properties in the sun and in the shade. The ability to use the light available in brief sunflecks is an important feature of many understory forest species. Day length is another feature of the light environment that plants are often capable of detecting and which they may use as a reliable indicator of changing seasons.
Wookey, P. A., C. H. Robinson, A. N. Parsons, J. M. Welker, M. C. Press, T. V. Callaghan and J. A. Lee. 1995. Environmental constraints on the growth, photosynthesis and reproductive development of Dryas octopetala at a high Arctic polar semi-desert, Svalbard. Oecologia 102: 478–489.
Additional References
Chazdon, R. L. and R. W. Pearcy. 1991. The importance of sunflecks for forest understory plants. BioScience 41: 760–766.
Jones, H. G. 1992. Plants and Microclimate: A Quantitative Approach to Environmental Plant Physiology. Cambridge University Press, Cambridge.
Lambers, H., T. L. Pons and F. S. Chapin III. 1998. Plant Physiological Ecology. Springer, New York.
Larcher, W. 1995. Physiological Plant Ecology. 3rd ed. Springer, Berlin.
Nobel, P. S. 1999. Physiochemical and Environmental Plant Physiology. Academic Press, New York.