

P A R T
I The Individual
and its Environment
2Photosynthesis
and the Light Environment 15
3Water Relations and Energy Balance 41
4Soils, Mineral Nutrition,
and Belowground Interactions 63
C H A P T E R 2 Photosynthesis
and the Light Environment
How does a plant “perceive” and respond to the environment that surrounds it? Why is it that some plants can survive extremes of temperature and drought while others cannot? What enables certain plants to thrive in the deep shade of the understory of a tropical rainforest, and
others to succeed only in the sunniest habitats?
The functional ecology of plants is concerned with how the biochemistry and physiology of individual plants determine their responses to their environments within the structural context of their anatomy and morphology. Functional ecology is similar to physiological ecology, a subdiscipline of ecology that focuses on physiological mechanisms underlying whole-plant responses to the environment. It underlies much about the ecology of plants. Part I of this book is particularly concerned with functional ecology.
Plants must acquire energy and materials for growth, maintenance, and reproduction. They must also limit their losses; for example, if a plant loses too much water, it will wilt and eventually die. Plants must also allocate resources in ways that maximize their chances for contributing offspring to the next generation while simultaneously maximizing their chance of surviving to reproduce. In this chapter and the next two, we examine how plants capture the energy of sunlight and incorporate carbon from the atmosphere in photosynthesis, their adaptations to the light environment, their water relations, and their uptake and use of mineral nutrients. We also examine the structures in which some of these processes take place and consider some of the biochemistry involved.
While we focus here on processes occurring at the small scale of a cell, a leaf, or an individual plant, it is important not to lose sight of the forest: plants have evolved and live in an ecological context. Photosynthesis, the biochemical process by which plants capture energy from sunlight and fix carbon from the air, is usually carried out not in a laboratory, but in natural environments. The photosynthetic machinery, and the leaf in which it is housed, are both evolutionarily adapted and acclimated to the environment in which the individual plant is growing. The temperature and the amount of available light, water, and nutrients in the environment determine when and how rapidly the leaf can photosynthesize and the extent to which the plant grows and is likely to survive.
The physical conditions that the plant experiences are determined not only by the physical features of the environment, but also by other living organisms
16 Chapter 2
in that habitat. The amount of light available for photosynthesis may be limited by other plants competing for that light. A plant’s ability to capture carbon and energy may also be reduced by herbivores eating its leaf tissue. Pathogens and pollutants may limit the plant’s ability to photosynthesize. The plant responds to all of these aspects of its environment as an integrated unit, although in textbooks such as this one, we arbitrarily separate its responses into categories for convenience, treating them in different chapters. With that perspective, we begin our examination of plants’ interactions with their environment with the process by which they acquire energy and carbon: photosynthesis.
(A)
 Lipid (oil) globule
Chloroplast envelope (outer membrane)
 Plasmalemma
(cell membrane)
 Stroma thylakoids
Grana stacks
Stroma
 Cell wall
 Grana stack
The Process of Photosynthesis
Photosynthesis is the set of processes by which plants acquire energy from sunlight and fix carbon from the atmosphere. It consists of two major parts: the initial capture of light energy and the incorporation of that energy, together with carbon dioxide, into organic compounds. The organic molecules formed in photosynthesis are used by the plant to create new tissues, regulate the plant’s metabolic processes, and to supply energy to those metabolic processes. Both the capture of energy (the light reactions) and the initial formation of carbohydrates (carbon fixation) take place in the chloroplasts.
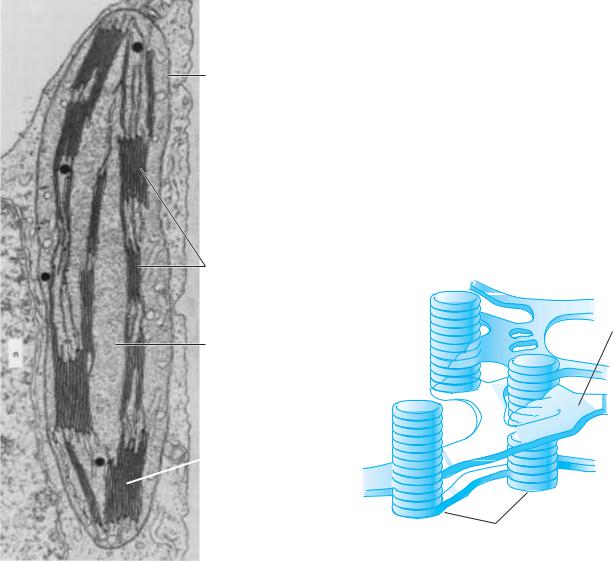
The light reactions of photosynthesis occur on the thylakoid membranes (also called lamellae) in the interior of the chloroplasts. These double membranes exist in the form of grana stacks alternating with sheets of interconnecting stroma thylakoids (Figure 2.1). The successful capture of light energy depends on the precise spatial arrangement of these photochemical reactions within the membranes in which they occur. The architecture of the thylakoid membranes is complex and is not yet fully understood, but they appear to consist of a lipid matrix (which may be partially fluid) into which enzyme proteins and pigment-protein complexes are integrated. These highly organized components exist within a dynamic and flexible membrane system.
The pigment molecules responsible for the capture of light energy form two distinct molecular complexes in plants, photosystem I and photosystem II (Figure 2.2). Unicellular eukaryotic algae, such as the Chlorophyta, and prokaryotic cyanobacteria also have photo-
(B)
 Stroma
thylakoids
Grana stacks
|
|
|
|
Figure 2.1 |
|
|
|
|
(A) Chloroplast from a leaf of Nicotiana tabacum (tobacco, Solanaceae), showing grana |
|
|
|
|
stacks and stroma thylakoids. (B) A model of grana stacks and stroma thylakoid |
|
1 m |
|
|
structure within a chloroplast. (After Esau 1977.) |
|
|
|
|
|

ENERGY STATE
|
2e− |
Chl* |
|
|
|
|
|
|
|
|
F |
|
|
|
Fd |
|
2e− ATP |
ADP |
|
2e− |
|
|
|
|
NADP+ |
|
|
Q |
|
|
|
|
2e− |
|
|
|
|
PQ |
|
NADPH |
|
|
Cytb/f |
|
|
|
Chl |
PC |
|
|
|
Reaction |
|
|
|
|
|
center P700 |
|
|
|
|
Antenna |
1 |
|
|
|
/2O2 |
|
|
|
|
molecules |
+ 2H+ |
PHOTOSYSTEM I 


H2O
PHOTOSYSTEM II
Photon of
light
Photosynthesis and the Light Environment 17
|
|
|
Figure 2.2 |
|
|
|
|
The light reactions of photosynthesis in plants. |
|
|
|
|
Photons of light excite electrons in photosystems I |
|
|
|
|
and II. The excited electrons from photosystem I |
|
|
|
|
are passed eventually to NADPH, where the ener- |
|
2e− |
gy is captured in a high-energy bond. The excited |
|||
electron from PS II is passed through a series of |
||||
Chl* |
||||
|
|
|
electron acceptors, transferring energy in a regulat- |
|
|
|
|
ed fashion to ATP, finally replacing the electron lost |
|
|
|
|
||
|
|
|
from PS I with an electron from a water molecule. |
|
|
|
2e− |
||
2e− |
|
|
Reaction |
|
|
||||
Chl |
||||
center P680 |
||||

 Antenna

 molecules
 (accessory


 pigments)
Photon of
light
systems I and II, but certain other photosynthetic bacteria have only photosystem I. Each photosystem consists of hundreds of pigment molecules, including several forms of chlorophyll plus accessory pigments. In terrestrial plants, the accessory pigments are primarily carotenoids and xanthophylls, but eukaryotic algae and photosynthetic bacteria also use other pigments.
When a photon of light is captured by the tightly packed “antenna molecules,” it is passed from one molecule to another by the process of resonance transfer until it reaches the chlorophyll molecule in the reaction center of the photosystem, where it is trapped. The excited chlorophyll molecule then passes a light-excited, high-energy electron to an electron acceptor. The energy in this high-energy electron is ultimately captured in high-energy bonds in ATP and NADPH+.
Water molecules are the ultimate donors of these electrons. The oxygen that we breathe was released into the atmosphere from water molecules that were split to replace the electrons in photosystem II. Oxygen from photosynthesis was first released into the atmosphere beginning about 2 billion years ago, but was consumed by the weathering of iron and other minerals in rocks for over a billion years after that. Atmospheric oxygen reached its present levels about 400 million years ago, although there have been some fluctuations in that level since that time.
In the biochemical reactions of the Calvin cycle (Figure 2.3), CO2 is taken up from the atmosphere and the carbon is ultimately incorporated into organic compounds (“fixed”). These reactions take place in the stroma, the watery matrix that fills the chloroplast. In C3 plants (plants with the most common type of photosynthetic pathway; see below), large amounts of the enzymes that catalyze the reactions of the Calvin cycle are dissolved in the stroma. Energy captured by the light reactions is transferred, in the form of high energy bonds in ATP and NADPH+, to the stroma, where it is incorporated, along with CO2, into carbohydrate molecules. The fixation of carbon is thus powered by the light reactions, and the light energy captured in photosynthesis is ultimately stored in the chemical bonds of carbohydrates and other organic molecules.
Photosynthetic Rates
The rate at which a leaf can capture light energy and fix carbon is determined by several factors. Plants, like other aerobic organisms, use oxygen and release CO2 in the process of cellular respiration, by which organic compounds are broken down to release energy. Gross photosynthesis, or the total amount of carbon captured, is reduced by the plant’s respiratory release of CO2. Photosynthetic uptake of CO2 by plants is far greater on

18 Chapter 2
To lipids and proteins
|
|
CO2 |
Energy from |
|
|
ATP |
light reactions |
|
|
3PGA |
ADP |
|
|
|
|
|
|
(3-C) |
|
|
|
RUBISCO |
NADPH |
|
|
|
|
ADP |
|
RuBP |
|
|
(5-C) |
NADP+ |
|
|
|
|
|
|
|
|
G3P |
|
|
|
(3-C) |
ATP |
|
Other |
|
|
|
|
|
|
Ru5P |
carbon |
|
|
chains |
|
|
|
(5-C) |
|
|
|
|
|
Energy from light reactions
 Fructose
  Glucose
  To sucrose, starch, cellulose
Figure 2.3
The Calvin cycle of carbon fixation in plants. CO2 enters the stomata from the air surrounding the leaf. In a reaction catalyzed by the enzyme rubisco, CO2 is joined with the 5-carbon molecule RuBP to form two 3-carbon molecules (3PGA). Eventually simple sugars such as fructose and glucose are formed, to be ultimately transformed into many other organic (carbon-based) molecules.
average than respiratory losses, however, resulting in a |
|
|
|
|
|
|
|
|
|
net gain of carbon by plants. |
|
|
Maximum rate of photosynthesis (Pmax) |
||||||
|
|
||||||||
|
|
|
|||||||
Limitations Caused by Light Levels |
|
|
|
|
|
|
|
|
|
The most basic factor limiting photosynthesis is the total |
|
|
|
|
|
|
|
|
|
amount of light energy that reaches the thylakoid mem- |
|
|
|
|
|
|
|
|
|
branes. In darkness, cellular respiration results in a net |
exchange |
|
|
|
|
|
|
|
|
photosynthetic capture of either light or carbon (for a |
|
|
|
|
|
|
|
||
loss of carbon and energy from the plant, as there is no |
|
+ |
|
|
|
|
|
|
|
|
|
|
|
|
|
|
|
||
partial exception, see the discussion of CAM photosyn- |
2 |
|
|
|
|
|
|
|
|
CO |
|
|
|
|
|
|
|
||
thesis below). As the light level increases, plants begin |
|
|
|
|
|
|
|
||
Net |
|
|
|
|
|
|
|
||
to take up CO2. At the light compensation point, pho- |
0 |
|
|
|
|
|
|
||
|
|
|
|
|
|
||||
|
600 |
1200 |
1800 |
||||||
tosynthetic gains exactly match respiratory losses (in |
|
|
|||||||
|
|
|
PPFD ( mol m–2 s–1) |
||||||
other words, net CO2 exchange is zero) (Figure 2.4). |
|
|
|
||||||
|
|
|
|
|
|
|
|
||
Beyond that point, the more light that is available to be |
|
– |
Compensation point |
|
|
||||
captured, the greater the photosynthetic rate, up to a |
|
= light intensity at zero CO2 exchange |
|||||||
|
|
||||||||
maximum at which the rate plateaus in most plants. |
Figure 2.4 |
|
|
|
|
|
|
|
|
The light compensation point can differ among plant |
|
|
|
|
|
|
|
||
Net CO2 exchange (per unit leaf area) for a typical C3 plant |
|||||||||
species living in different parts of the environment or |
|||||||||
as a function of increasing light levels, showing the light |
|||||||||
within a given habitat. It can even differ within individ- |
|||||||||
compensation point and a plateau at a maximum rate of |
|||||||||
ual plants depending on the structure and biochemical |
photosynthesis. (After Fitter and Hay 1981.) |
|
|
||||||
Photosynthesis and the Light Environment 19
Table 2.1 Maximum photosynthetic rates (Amax), light compensation points (LCP), and rubisco levels for three forest understory herbs
|
|
|
|
Spring |
|
|
Summer |
|
Autumn |
||
Parameter |
Allium |
Viola |
Tiarella |
Viola |
Tiarella |
|
Tiarella |
||||
|
|
|
|
|
|
|
|
|
|
|
|
Amax |
15.4 |
± 0.9 |
12.1 |
± 0.7 |
6.8 ± 0.7 |
5.6 ± 0.5 |
3.9 ± 0.5 |
5.4 ± 0.3 |
|||
LCP |
21.6 |
± 1.4 |
8.4 ± 1.3 |
9.0 ± 1.0 |
4.1 ± 0.9 |
3.2 ± 0.5 |
6.5 ± 0.8 |
||||
Rubisco |
2.83 |
± 0.21 |
1.84 |
± 0.25 |
1.47 ± 0.12 |
0.93 ± 0.07 |
0.50 ± 0.17 |
0.78 ± 0.11 |
|||
Source: Rothstein and Zak (2001)
Note 1: Values are expressed on a per unit leaf area basis. Amax is given in mol CO2/m2/s; LCP is given as the PPFD
at which net CO2 assimilation is zero, in mol/m2/s; and rubisco levels are in g/m2. Values are means ± 1 standard error, with n = 5 plants per measurement.
Note 2: The duration during which each species had green leaves above ground was: Allium tricoccum, about 75 days;
Viola pubescens, about 150 days; and Tiarella cordifolia, about 185 days.
constituents of the leaves. Rothstein and Zak (2001) contrasted the photosynthetic characteristics of three for- est-floor herb species within a northern hardwood forest. In this forest, understory light levels are high in early spring before the canopy leafs out, low in midsummer, and higher again in autumn as leaves start to fall. A spring ephemeral, Allium tricoccum (wild leek, Liliaceae), had a constant light compensation point (Table 2.1), but was photosynthetically active only during a short period in spring. In contrast, a summer-green plant, Viola pubescens (downy yellow violet, Violaceae), shifted its light compensation point downward from spring to midsummer, while a semi-evergreen species, Tiarella cordifolia (foam-flower, Saxifragaceae), also shifted its light compensation point downward over that period, but shifted it upward again in autumn. The spring ephemeral appears to be adapted to optimize its photosynthetic uptake in the high-light environment it experiences in spring, while the other two species are both better adapted to photosynthesize under shady conditions, at least in part due to their ability to shift the light compensation point.
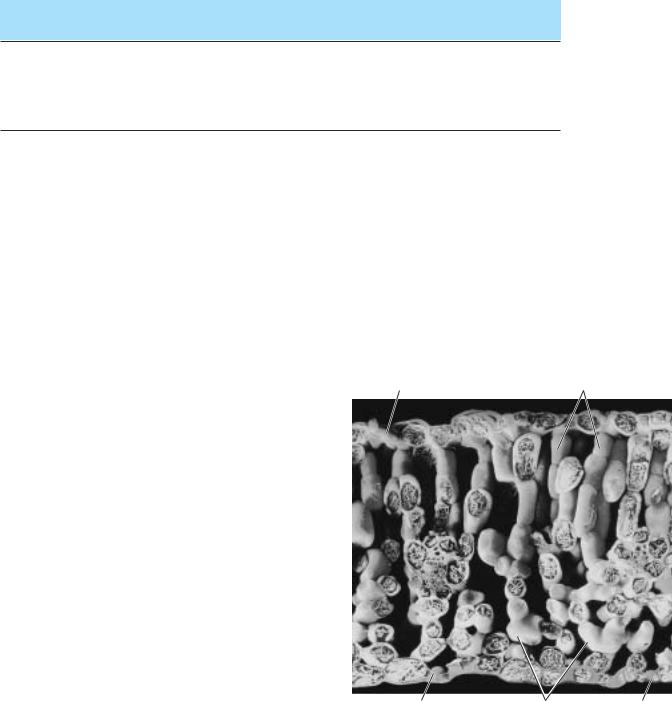
The quantity of light reaching the thylakoid membranes of a chloroplast can be limited by a number of factors. The location of the chloroplast within the leaf can affect the light reaching the thylakoid membranes, as can the angle at which sunlight hits the leaf. In a typical C3 leaf, photosynthesis takes place in the spongy and palisade parenchyma cells that make up the mesophyll (the photosynthetic tissue between the upper and lower epidermis of a leaf). There are many chloroplasts in each photosynthetic cell (Figure 2.5). On a larger scale, selfshading by other leaves on the same plant, or shading by competitors, can also limit the amount of light available to be captured. We will examine some of these factors in more detail in other chapters.
Robin Chazdon (1985) studied the efficiency of light capture in two understory dwarf palms in the rainforests of Costa Rica, Asterogyne martiana and Geonoma cuneata
(both in the Arecaceae). Both species have narrow, spi-
rally arranged leaves that minimize self-shading. A. martiana was found in locations with somewhat higher light levels, and had a greater number of leaves and a greater total leaf area, compared with G. cuneata. As a result, G. cuneata had greater efficiency of light interception (the proportion of incident light intercepted by the plant
Epidermis |
Palisade parenchyma |
Stoma |
Spongy |
Stoma |
|
parenchyma |
|
Figure 2.5
Scanning electron micrograph of a cross section of a leaf of Brassica septiceps (turnip, Brassicaceae), showing the palisade parenchyma and spongy parenchyma cells inside which most chloroplasts are found and in which most of the plant’s photosynthesis takes place. Many of the cells in this micrograph have been broken open to expose their internal structure. The upper epidermis is visible, as are several stomata on the underside of the leaf, along with the substomatal cavities they open into on the inside of the leaf. (Photograph © J. Burgess/Photo Researchers, Inc.)

20 Chapter 2
(A)
|
1.0 |
|
|
|
Whole leaf |
|
|
|
|
|
|
|
|
|
|
Absorbance |
0.8 |
|
|
|
|
|
|
0.6 |
|
|
|
|
|
|
|
|
|
|
|
|
|
|
|
|
0.4 |
|
|
|
|
|
|
|
0.2 |
Pigment extract |
|
|
|
|
|
|
|
|
|
|
|
||
|
0 |
340 |
420 |
500 |
580 |
660 |
740 |
|
|
||||||
(B)
absorptivity |
|
120 |
|
–1 |
100 |
|
|
|
] |
|
|
|
–1 |
80 |
|
|
cm• |
|
|
|
|
|
|
Molar |
•nmol |
60 |
|
40 |
|
||
) [l |
|
|
|
( |
|
20 |
|
|
|
|
|
|
|
0 |
340 |
|
|
|
|
(C) |
|
|
|
|
|
1.0 |
|
|
Absorbance |
0.8 |
|
|
0.6 |
|
|
|
|
|
|
|
|
0.4 |
|
|
|
0.2 |
|
|
|
0 |
340 |
|
|
|
|
Chlorophyll b
Chlorophyll a
420 500 580
Lutein
β -Carotene
420 500 580 Wavelength (nm)
|
|
160 |
|
|
|
|
140 |
|
( |
|
|
120 |
) [l |
|
|
|
80 |
Molar 1– |
|
|
|
100 |
• nmol |
absorptivity |
|
|
|
||
|
|
|
] |
|
|
|
60 |
•cm |
|
|
|
40 |
1– |
|
|
|
|
|
|
|
|
20 |
|
|
660 |
740 |
0 |
|
|
660 740
UV Violet Blue Green Yellow Red IR
canopy, which depends upon leaf arrangement and display angle), but A. martiana had a greater total capacity to capture light (where the light interception capacity, or effective leaf area, is the product of total leaf area and light interception efficiency). Takenaka and associates (Takenaka et al. 2001) followed up this work by analyzing the effects of leaf display on light capture efficiency in another understory palm, Licuala arbuscula (Arecaceae), which grows in lowland rainforests in southeast Asia. This species has compound, fan-shaped leaves with long petioles. The authors found that the angle at which the petioles are held changed as the number of leaves increased. As plants grew from juveniles with few
Figure 2.6
(A) Absorption spectra of (wavelengths of light absorbed by) a whole leaf and an extract of all photosynthetic pigments from that leaf. (B) Absorption spectra of purified extracts of chlorophylls a and b. (C) Absorption spectra for two of the most important accessory pigments, lutein and β -carotene. (After Mohr and Schopfer 1995.)
leaves to mature plants with many leaves, this shift reduced self-shading to a minimal level and optimized light capture for individuals of very different forms and total leaf areas.
The quality of light, or the wavelengths of light available to be captured, can also limit photosynthetic rates (Figure 2.6). Blue and red wavelengths are preferentially captured by the light reactions. Perhaps paradoxically, given our image of the beautiful green world, green wavelengths are particularly ineffective for photosynthesis. We see nature as green because green light is reflected or transmitted—“discarded” rather than used—by plants. The wavelengths of light that can be used in photosynthesis are termed photosynthetically active radiation, or PAR. The amount of usable light energy impinging upon a leaf per unit time is called the photosynthetic photon flux density (PPFD).
Limitations on Carbon Uptake
Plants take up CO2 from the atmosphere as air moves through the stomata and into the intercellular spaces surrounding the photosynthetic cells within a leaf. Carbon uptake is driven by a concentration gradient of CO2, set up by the biochemical reactions in the chloroplasts that remove CO2 from the intercellular spaces. The uptake of CO2 is regulated by the conductance to CO2 diffusion on the pathway from the air into the leaf and into the chloroplast. The concentration of CO2 in the intercellular spaces depends on how rapidly CO2 is removed by being fixed into organic compounds, and on how readily CO2 comes into the leaf to replace that CO2.
The leaf conductance to CO2 is the rate at which CO2 flows into the leaf for a given concentration difference between ambient and intercellular CO2. The inverse of conductance is resistance. Low conductance or high resistance at a particular point in the pathway of CO2 movement will limit its movement along that pathway. If the overall leaf conductance to CO2 is high and CO2 concentrations in the intercellular spaces are being continually drawn down by the rapid fixation of carbon, then CO2 influx from the air surrounding the leaf will be high.
The rate of CO2 uptake can be modeled with a flux equation. Flux equations are used to model flow rates, and are of the general form
flux = (conductance) × (driving force)
For CO2 uptake, the driving force is a difference in CO2 concentration, and the flux equation can be stated as
CO2 uptake rate = (leaf conductance to CO2 diffusion) × (difference in CO2 concentration between air and chloroplast)
or, using conventional symbols,
A = gleaf × (Ca – Ci)
The term A is the assimilation rate (in µmol/m2/s); this is the rate at which CO2 is taken up by the leaf. The terms (CO2a) Ca and Ci are the ambient and intercellular concentrations of CO2, respectively; that is, the concentrations in the surrounding air and at the surface of the photosynthetic cell. The term gleaf is the total conductance of the leaf to CO2.
We can separate leaf conductance into its two major components, gs and ga—the conductances to CO2 through the stomata and through the boundary layer of air surrounding the leaf, respectively—so that
1/gleaf = 1/ga + 1/gs
Generally, ga is large, since CO2 readily passes through the boundary layer, and so does not contribute greatly to the regulation of CO2 flux. The conductance to CO2 through the stomata (gs), however, is highly variable and is under the control of the plant. Stomatal conductance regulates leaf CO2 flux under most conditions. Thus, plants are not merely passive recipients of CO2, but regulate its uptake closely. This regulation occurs over short time scales (seconds to minutes), as stomata are opened or closed, and over longer time scales (days to months), as leaf morphology and chemistry are altered. Over much longer time scales (centuries to millennia or longer), natural selection acts to alter the capacity of plant populations in different environments to take up
Photosynthesis and the Light Environment 21
carbon under different conditions as morphology, physiology, and other plant characters evolve.
Why would plants ever restrict their uptake of CO2? We examine this question in more detail in Chapter 3, but briefly, it is largely because CO2 gain is linked inextricably with the loss of water through the same stomatal openings in the leaf through which CO2 is taken up.
A different formulation for photosynthetic rate is sometimes employed to describe net photosynthesis at light saturation, Asat, the light level at which the maximum photosynthetic rate is reached, when CO2 uptake is not limited by stomatal conductance:
Asat = gm × (Ci – Cc)
where Cc is the compensation point for CO2 and gm is the mesophyll conductance or intracellular conductance, the conductance to CO2 through the leaf mesophyll cells and cell walls.An enormous amount of air must be processed by the leaf in the course of photosynthesis. To make a single gram of the carbohydrate glucose, a plant needs 1.47 grams of CO2, which is the amount in about 2500 liters of air. Looked at another way, the air needed to fill a structure the size of the Houston Astrodome could supply enough CO2 to fix about 590 kilograms (1300 lbs) of glucose (Figure 2.7).
When the stomata of a leaf are fully open, its conductance to CO2 is generally high. The exact value depends on the number and size of the stomata, and it varies among species, individual plants, and even leaves on the same plant. (We will return to the issue of stomatal number and size in the next chapter.) When the stomata are closed, leaf conductance to CO2 approaches zero, although sometimes small amounts of CO2 may “leak” through the cuticle.
The stomata of many plants are very dynamic. The guard cells that determine the degree of stomatal open-
Photo to come afternoon of 5/13/02-
David waiting on corbis-
Figure 2.7
The Houston Astrodome in its glory days. Given the amount of air that filled the Astrodome at any one moment, had its builders used real Bermuda grass instead of inventing Astroturf and not painted the dome to make it opaque, the turf could have turned the CO2 in that air into roughly 590 kilograms of glucose— and that’s without a single player or spectator breathing into it. The advent of retractable domes has returned natural, carbon-fixing turf to its former prominence at ball fields.

22 Chapter 2
ing are continually in motion, widening and narrowing the stomatal pores to regulate CO2 entering the leaf and water leaving it. Some of the stomata may begin to close while others remain open (Figure 2.8). Such patchy stomatal closure may be more common when plants are experiencing stress, but this phenomenon is still under active study (Terashima 1992). The guard cells are under a complex set of controls that respond to both internal and external factors.
Variation in Photosynthetic Rates within and between Habitats
Photosynthetic rates sometimes vary among plants within a habitat, and across habitats, in ways that seem to make sense because they are correlated with species composition, habitat preferences, or growth rates. In other cases, photosynthetic rates may have little role in determining population processes or species’ distributions. Even growth rates may be minimally related to photosynthetic rates. The total carbon accumulated by a plant depends not only on the rate of photosynthesis on a leaf area basis, but also on the total leaf area of the plant, as well as on other factors, such as the length of time the leaves are maintained and are photosynthetically active.
An example of a case in which differences in photosynthetic rates correlate with species and habitat differences comes from a study of dwarf shrubs in a subalpine heath community in the Apennine Mountains of northern Italy (Gerdol et al. 2002). In sheltered locations, two deciduous shrubs, Vaccinium myrtillus (blueberry, Ericaceae) and V. uliginosum (bog-bilberry, Ericaceae) are dominant, or at least abundant, and the vegetation is very dense. In exposed habitats, the vegetation is more open, and a variety of shrubs are dominant, including
V. uliginosum and an evergreen species, Empetrum hermaphroditum (crowberry, Ericaceae). Renato Gerdol and colleagues found that the evergreen E. hermaphroditum had the lowest photosynthetic rates of the three species. The deciduous V. uliginosum had intermediate rates, which did not differ among habitats. The deciduous species restricted to the more favorable sites, V. myrtillus, had the highest photosynthetic rates. The differing photosynthetic rates of these plants did not, however, correspond to their relative growth rates, nor did they explain the relative responses of the plants to removal of competing neighbors or to fertilizer additions.
In the study of northeastern forest understory species discussed above (Rothstein and Zak 2001), maximum photosynthetic rates were correlated with the growth environment of the three species studied (see Table 2.1). The spring ephemeral, Allium, which grew only in the highest light period, had the highest maximum photosynthetic rates overall. During spring, the summer-green Viola pubescens had intermediate photo-
Stomatal width ( m)
0–2
2–4
4–6
6–8
8–10
> 10
Figure 2.8
Stomatal widths in different parts of a leaf of Commelina communis (day-flower, Commelinaceae) at midday. Some stomata are wide open, while others are partially open or fully closed. (After Larcher 1995.)
synthetic rates, and the evergreen Tiarella cordifolia had the lowest rates. In midsummer, when light levels were lowest, photosynthetic rates declined substantially for both Viola and Tiarella, but Tiarella still had the lower rates of photosynthesis. In autumn, only Tiarella was photosynthetically active, and its maximum photosynthetic rate increased again in the higher light environment. These differences among species and seasons were positively correlated with the levels of rubisco (the enzyme that catalyzes the initial capture of CO2; see below) in the leaves and patterns of plant growth as well as with the duration of time that each plant is photosynthetic. Allium gained all of its biomass during the spring high light period and lost biomass after that time. Viola and Tiarella also gained biomass rapidly during spring, and continued to increase in biomass during the summer. Viola sharply declined in biomass from late summer through winter, but Tiarella continued to accumulate biomass through early winter. Only 25% of the