

PAGE PROOF: 2ND PASS
C H A P T E22R Global Change:
Humans and Plants
Earth is going through one of the most rapid periods of change in its history, and the primary cause of the ongoing changes is humans. The global carbon cycle is central to these changes.
One of the major consequences of alterations in the carbon cycle has been a global rise in temperatures. Some of the other likely changes in weather include shifts in rainfall patterns, so that some areas will become wetter and others drier; changes in the seasonality of rainfall in many locations; and increases in rainfall intensity during storms. These changes will affect most living organisms.
The global carbon cycle is intimately intertwined with plant ecology. Plants both drive and respond to the carbon cycle. As conditions for plant growth change over the face of the globe, dramatic changes—some predictable, but others unpredictable—will affect agricultural systems and natural ecosystems in all biomes. Plant and animal distributions will shift, natural communities will have different species compositions than they have today, some species will become extinct, and some natural communities will decline or vanish altogether. Humans and human institutions (such as national economies) will almost certainly be affected by these changes as well, directly by changing weather patterns and rising sea levels and indirectly by alterations in agricultural productivity (for better or worse, depending on the location).
While shifting weather patterns are the best known of its effects, anthropogenic global change encompasses far more than warmer temperatures. Other global changes caused by humans over the past 150 years include greatly altered patterns of land use and a large and continuing decline in the diversity of plants and animals living on Earth. To adequately address the role of plants, and consequences for plants, in this global drama, we must digress in places from our focus on plants to look more closely at the actions of people.
Carbon and Plant-Atmosphere Interactions
The Global Carbon Cycle
The uptake of carbon by plants was introduced in Chapter 2, and we examined in detail how carbon moves through ecosystems in Chapter 15. To recap briefly, plants take up carbon in the form of CO2 from the atmosphere and incorporate it into organic compounds using energy from sunlight. Carbon
438 Chapter 22
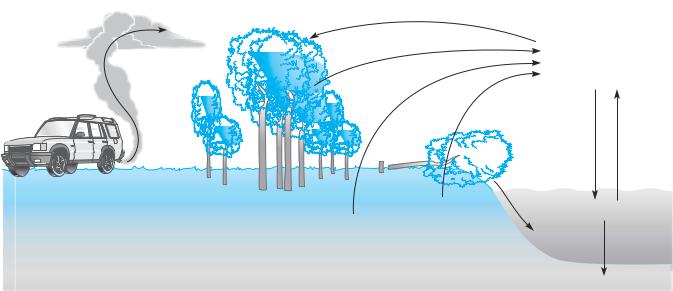
moves through ecosystem food webs via consumption of plants and plant parts and by the actions of decomposers. Organic carbon accumulates in ecosystems for a period of time both in living organisms and as soil organic matter. Carbon returns to the atmosphere primarily through the respiration of soil organisms. We now widen our focus to a global scale, examining the pools and fluxes of carbon in terrestrial environments, the atmosphere, and the oceans (Figure 22.1).
By far the largest active pool of carbon on or near the Earth’s surface is that dissolved in the oceans. (This does not include the substantial pools of carbon contained in rock, oil, and natural gas, which are naturally largely inactive.) Most of the active marine carbon is found in deep ocean waters, and the exchange of this carbon with the atmosphere occurs slowly, with a turnover time of about 350 years. Surface waters exchange CO2 with the atmosphere much more quickly. It takes about 11 years, on average, for a molecule of CO2 in the atmosphere to be dissolved at the ocean surface and then released again. Slightly more CO2 is dissolved every year than is released, so the oceans currently act as a net sink for carbon.
Another substantial pool of carbon is found in soil organic matter. A major flux of CO2 into the atmosphere comes from the respiration of soil organisms, primarily microorganisms (Schlesinger 1997). The atmosphere and
6
Land
 plants Anthropogenic 560 sources
Figure 22.1
The global carbon cycle. The numbers show the pools (in units of 1015 g C) of carbon in various major compartments and the fluxes (in units of 1015 g C/year, shown in boldfaced type) of carbon moving between portions of the land, oceans, and atmosphere. Notice that land plants take up about twice as much carbon annually as they release, and that land plants store almost as much carbon as the atmos-
PAGE PROOF: 2ND PASS
living plants contain the two other major active pools of CO2, with somewhat more carbon stored in the atmosphere than in plants. (The organic matter stored in living animals is minuscule because the total biomass of animals is small relative to the global carbon budget.)
Gross primary production—the total flux of CO2 into living terrestrial plants—removes the greatest amount of carbon from the atmosphere yearly. About half of this carbon is returned to the atmosphere through the respiration of terrestrial plants, so that terrestrial global NPP (net primary production: see Chapter 15) is about 60 × 1015 g C/year. Marine phytoplankton—par- ticularly cyanobacteria—exchange CO2 directly with that dissolved in surface ocean water and only indirectly with the atmosphere. NPP in the oceans is estimated to be about 35–50 × 1015 g C/year, or somewhat less than that of terrestrial plants. Most of the carbon fixed by marine phytoplankton is taken up by heterotrophic bacteria and zooplankton in surface waters. Much of the CO2 taken up by the bacteria is quickly transformed to inorganic forms again and released into the water, while the zooplankton form the basis for marine food webs. Only a tiny proportion of the NPP eventually sinks to the ocean bottom. The total pool of carbon in marine organisms at any one time is very small, although the turnover rate of carbon in this pool is very rapid.
GPP
120 |
|
RP |
Atmospheric pool |
750 |
|
60 |
Annual change: +3.2 |
|
60 |
|
0.9 |
|
|
Rivers |
92 |
90 |
|
Net destruction |
0.4 DOC |
|
38,000 |
|
0.4 DIC |
|
||
Soils |
of vegetation |
|
||
|
|
Ocean |
||
|
|
|
||
1500 |
|
|
|
|
|
|
|
|
|
|
|
|
|
0.1 |
|
|
|
|
Burial |
phere. Earth contains about 1023 g carbon; most of this carbon is buried in sedimentary rocks. Only about 1018 g carbon is contained in active pools, as shown here, with the largest of these as marine dissolved inorganic carbon. DOC, dissolved organic carbon; DIC, dissolved inorganic carbon; GPP, gross primary production; RP, plant respiration. (After Schimel et al. 1995 and Schlesinger 1997.)

PAGE PROOF: 2ND PASS
Global Change: Humans and Plants 439
(A) |
|
|
|
|
|
|
380 |
|
|
|
|
|
370 |
|
|
|
|
|
360 |
|
|
|
|
(ppmv) |
350 |
|
|
|
|
|
|
|
|
|
|
2 |
340 |
|
|
|
|
CO |
|
|
|
|
|
|
|
|
|
|
|
|
330 |
|
|
|
|
|
320 |
|
|
|
|
|
310 |
1970 |
1980 |
1990 |
2000 |
|
1960 |
||||
|
|
|
Year |
|
|
Figure 22.2
(A) Recent increases in atmospheric CO2 (in parts per million by volume, ppmv) recorded at the Mauna Loa observatory in Hawaii. This site was chosen because it is not subject to the variation in CO2 levels that would be found close to sources of anthropogenic emissions, but the results are similar to those found at many other sites. The actual monthly values are shown by data points; the wiggling line is a result of seasonal variation due to the decrease when Northern Hemisphere terrestrial vegetation is most actively photosynthesizing in summer and the increase when it is least actively photosynthesizing in winter. The long-term trend is shown by the colored line, which has been statistically smoothed based on the monthly values. Data for 1958 to 1974 are from the Scripps Institution of Oceanography, and for May 1974 to 2001 from the U.S. National Oceanic and Atmospheric Administration. (Keeling and Whorf 2001.) (B) The trend in CO2 concentrations over the past two centuries, determined from bubbles of gas in ice cores from Antarctica. (After Vitousek 1992.)
These fluxes of CO2 are natural, although they can be affected by human activities. Two additional important fluxes in the global carbon cycle, however, are entirely anthropogenic, at least on their current scales. These two fluxes, both of which add CO2 to the atmosphere, result from the cutting and burning of large areas of forests and from the extraction and combustion of fossil fuels, including oil, natural gas, and coal. The immediate consequence of these additional fluxes is that atmospheric concentrations of CO2 are rising. Before the Industrial Revolution of the nineteenth century, CO2 was 280 ppmv (parts per million by volume) of the atmosphere. The concentration of CO2 is now about 370 ppmv on average at Earth’s surface and, if we continue our current practices, could reach twice preindustrial levels— 560 ppmv—by 2065 (Figure 22.2). These higher levels of CO2 will have direct effects on plants as well as indirect effects mediated by changes in climate. After exam-
(B) |
|
|
|
|
|
|
|
360 |
|
|
|
|
|
|
340 |
|
|
|
|
|
(ppmv) |
320 |
|
|
|
|
|
concentration |
|
|
|
|
|
|
300 |
|
|
|
|
|
|
|
|
|
|
|
|
|
2 |
|
|
|
|
|
|
CO |
|
|
|
|
|
|
|
280 |
|
|
|
|
|
|
260 |
1800 |
1850 |
1900 |
1950 |
2000 |
|
1750 |
|||||
|
|
|
|
Year |
|
|
ining the direct effects of increasing CO2 levels, we discuss the effects they may have on global climates. We then examine the sources of this anthropogenic atmospheric carbon.
Direct Effects of Increasing CO2 on Plants
Plants and other photosynthetic organisms use atmospheric CO2 in photosynthesis, and the carbon in the atmosphere is thus the basis for most food webs on Earth. For plants that use C3 photosynthesis—that is, the majority of photosynthesizers—the concentration of CO2 in the atmosphere is suboptimal (see Chapter 2). It is reasonable to assume, therefore, that rising atmospheric CO2 levels might act as a “fertilizer” to stimulate plant productivity. Elevated CO2 levels can also increase the efficiency of water and nutrient use (at least for C3 plants) and alter patterns of carbon allocation within the plant body. Because different plants respond very differently to enhanced CO2 levels, global changes in atmospheric CO2 concentrations might change intraand interspecific competitive interactions among plants. Changes in competitive abilities, as well as any other responses that lead to differences in relative performance among individuals, can change the relative reproductive output of individuals, thus altering the future genetic structure of plant populations. Elevated CO2 can also affect leaf chemistry, alter local ecosystem carbon cycles, and change nitrogen cycling and other ecosys- tem-level processes. Some ecologists have predicted that although there will be large positive responses to higher CO2 levels initially (due to the “fertilizer” effect), this

440 Chapter 22
will be followed by adjustment and reduced responses over time, over a range of scales from individual plants to ecosystems. The details of these changing physiological and biogeochemical responses to rising CO2 levels are interesting, but beyond the scope of this book.
It has been predicted that C3 plants should grow more vigorously under elevated CO2, while C4 plants should not (see Chapter 2), and that C4 plants may therefore be at a greater competitive disadvantage in an enhanced-CO2 world. Differences among species in growth and other responses to enhanced CO2 would be likely to change community composition, as some species would do better and others relatively worse. Wand et al. (1999) carried out a quantitative synthesis of the results of published studies on the responses of uncultivated grasses to elevated CO2. The researchers showed that across all studies, both C3 and C4 plants had higher photosynthetic rates on average in response to elevated CO2 (33% and 25%, respectively). Total biomass increased for both C3 and C4 grasses (by 44% and 33%, respectively), and leaf water use efficiency was also greater for both grass types. These findings were surprising, and show that the presumed competitive disadvantage of C4 species at higher CO2 levels may not exist.
In an analysis of the effects of elevated CO2 on trees (all with C3 photosynthesis), Curtis and Wang (1998) found that both photosynthesis and total growth increased substantially when CO2 levels were elevated to twice the current atmospheric levels, although stressful conditions such as low soil nutrient levels reduced these effects of enhanced CO2. They also found no evidence that trees eventually would acclimate to high CO2, reducing its effect over time, as some have predicted. It is probably safe to say, therefore, that many plants would
PAGE PROOF: 2ND PASS
have positive direct responses to higher atmospheric CO2 levels, including higher photosynthetic rates, greater growth, and reduced water loss, if nothing else changed. However, the indirect effects of the climate changes that are likely to occur due to elevated CO2 will probably dwarf these direct effects.
Anthropogenic Global Climate Change
The Greenhouse Effect
Carbon dioxide molecules in the atmosphere are highly effective at absorbing infrared (or longwave) radiation (see Chapter 18). Visible (short) wavelengths of sunlight pass through the atmosphere without being absorbed by it, warming the Earth’s surface. Earth’s surface reradiates some of that energy in the longwave part of the spectrum (see Chapter 3). Some of that reradiated energy is absorbed and trapped by the atmosphere, particularly by water and CO2 molecules (Figure 22.3). This recaptured energy warms the atmosphere, which then further warms the surface. The longwave energy that is not trapped by the atmosphere escapes to space.
Sun
Reflected from
atmosphere
Reflected from earth’s surface
Radiated by |
Reabsorption by |
|
atmosphere |
||
greenhouse gases |
||
into space |
||
in atmosphere |
||
|
 Infrared radiation Infrared from surface radiation
from surface lost to space
Figure 22.3
The greenhouse effect. About 70% of the incoming shortwave radiant energy from the sun is absorbed by Earth’s surface; the remainder is reflected by the surface and the atmosphere. About half of the absorbed energy heats the Earth’s surface. Some of that energy is radiated by the surface as longwave (primarily infrared) radiant energy. Most of that radiated energy is reabsorbed by atmospheric gases, which then reradiate it back to further warm the Earth’s sur-
Solar energy Water input
vapor flux
Absorbed by surface
face. A small portion of the longwave energy escapes from the atmosphere to space. The other half of the energy absorbed by the Earth’s surface is used in the evaporation of water, which adds water vapor to the atmosphere and initially cools the surface. When that water vapor condenses to form clouds, the energy removed from the surface is transferred to the atmosphere, driving the creation of storms and releasing precipitation.

PAGE PROOF: 2ND PASS
The carbon dioxide in the atmosphere is a natural part of the carbon cycle. Why, then, does it threaten to change global climates? The problem is not that there are CO2 molecules in the atmosphere, but that there has been a tremendous rise in their concentrations. The greater the number of CO2 molecules in the atmosphere, the more infrared radiation is trapped, and the more heat is retained at the Earth’s surface. CO2 is called a greenhouse gas because, like the glass in a greenhouse, it lets visible light energy enter the atmosphere but prevents longwave radiation from escaping, thereby warming the Earth’s surface. The greenhouse effect is the warming of the Earth’s surface and atmosphere due to the retention of heat by the greenhouse gases in the atmosphere. The greenhouse effect is natural and is necessary for the continuation of life on Earth—without it, the average temperature of the Earth’s surface would be –18°C (0°F) instead of its actual 14°C (57°F). However, most popular usage of the term “greenhouse effect” refers to the rise in temperatures resulting from the increases in atmospheric CO2 and other greenhouse gases caused by human activities. It is the increase in the greenhouse effect that is leading to global climate change.
Water vapor is the most predominant and effective greenhouse gas, followed by CO2. Both occur in the atmosphere naturally. Because it is produced in the largest quantities (after water vapor), carbon dioxide is the most important greenhouse gas currently increasing due to human activities, but it is unfortunately not the only one. A variety of other gases also contribute to global warming. (Anthropogenic effects on water vapor are complex and not fully understood; they are not thought to be a major contributor to the increase in the greenhouse effect.) In addition to CO2 and water vapor, four of the most important greenhouse gases are methane (CH4), nitrous oxide (N2O), ozone (O3), and chlorinated fluorocarbons (CFCs). The first three occur naturally, but humans have greatly increased their concentrations in the atmosphere.
Anthropogenic methane (Figure 22.4) is released in large quantities by leakage during the drilling and transportation of natural gas, by anaerobic prokaryotes in cattle rumens, and in decomposing trash in landfills and dumps. Increases in nitrous oxide are largely a by-prod- uct of commercial agriculture, as it is released by the microbial degradation of nitrogen-containing fertilizers; nylon production is another substantial source of N2O. Ozone, O3, is produced in the lower atmosphere (the troposphere) through a series of chemical reactions where air pollution is high, particularly as volatile hydrocarbons and carbon monoxide in the presence of high NO. Some ozone is also produced naturally from compounds emitted by vegetation and by forest fires. CFCs are artificial compounds used primarily as refrigerants and propellants. While recent international treaties have dra-
Global Change: Humans and Plants 441
matically reduced their production, they are so stable chemically that the molecules already in the air will persist for a very long time.
While humans produce far smaller amounts of these four compounds than of CO2, these other greenhouse gases are much more potent absorbers of infrared radiation. Methane traps more than 20 times the amount of heat per molecule than a carbon dioxide does, while nitrous oxide absorbs 270 times more. Carbon dioxide emissions are responsible for about two-thirds of the anthropogenic intensification of the greenhouse effect, with most of the remainder due to CH4 (about 19%), CFCs (10%), and N2O (6%).
(A)
|
1750 |
|
(ppbv) |
1500 |
|
|
||
4 |
1250 |
|
CH |
||
|
||
Concentration |
1000 |
|
|
||
|
750 |
|
|
500 |
|
3000 2000 |
1000 700 |
500 |
300 |
200 |
100 |
0 |
|
|
Time (years ago) |
|
|
|||
(B) |
|
|
|
|
|
|
|
|
400 |
|
|
|
|
|
|
) |
350 |
|
|
|
|
|
|
4 |
|
|
|
|
|
|
|
CH |
|
|
|
|
|
|
|
300 |
|
|
|
|
|
|
|
g/yr |
|
|
|
|
|
|
|
250 |
|
|
|
|
|
|
|
12 |
200 |
|
|
|
|
|
|
(10 |
|
|
|
|
|
|
|
150 |
|
|
|
|
|
|
|
Emissions |
|
|
|
|
|
|
|
100 |
|
|
|
|
|
|
|
50 |
|
|
|
|
|
|
|
|
0 |
1900 |
|
|
1950 |
|
2000 |
|
1850 |
|
|
|
|||
|
|
|
Year |
|
|
|
|
Figure 22.4
Increases in atmospheric concentrations of methane, a major greenhouse gas. (A) Atmospheric methane (CH4) levels (in parts per billion by volume, ppbv) during the past 3000 years (note that the x-axis expresses time on a logarithmic scale). Concentrations were measured from air bubbles trapped in ice cores from Greenland and Antarctica, or from historic and current air samples. (After Schlesinger 1997; Cicerone and Oremland 1988.) (B) Global anthropogenic emissions of methane (CH4,, in 1012 g/year) from all sources from 1860 to 1994. (After Stern and Kaufmann 1998.)

442 Chapter 22
Many people, incidentally, confuse the intensification of the greenhouse effect with the problem of the ozone hole in the atmosphere. They are two different— although related—problems. The ozone hole is the loss of parts of the protective layer of ozone high in the stratosphere (the part of the atmosphere from 10 to 50 km above the surface), caused primarily by a class of artificial compounds called halogenated hydrocarbons (including CFCs and related chemicals). Ordinarily the stratospheric ozone layer absorbs much of the high-ener- gy ultraviolet radiation coming from the sun, preventing it from reaching the Earth’s surface. Halogenated hydrocarbons destroy ozone in the stratosphere, allowing more ultraviolet radiation to reach the surface; this effect has been particularly severe at high latitudes in the southern hemisphere. The increase in ultraviolet radiation poses a risk of damage to many organisms, including humans. This phenomenon contrasts with the intensification of the greenhouse effect, which is caused by a buildup of heat-trapping gases in the atmosphere, with consequent increases in global temperatures. The ozone hole is connected to the greenhouse effect and the problem of global warming specifically because CFCs act both to destroy stratospheric ozone and as greenhouse gasses, and more generally because both are anthropogenic changes in Earth’s atmosphere.
PAGE PROOF: 2ND PASS
Global Climate Change: Evidence
The evidence is clear that the concentrations of CO2, methane, and certain other greenhouse gasses have been increasing in the atmosphere. Predictions based on physics say that these increases will result in a warmer Earth. But what is the evidence, if any, that Earth is actually warming, or that any other climate changes have resulted from the rising concentrations of greenhouse gasses? Weather and climate are complex phenomena, and natural variation can confound and mask general trends (see Chapter 18), so sifting out the effects of any particular factor can be difficult.
That is why it has taken so long to nail down the effects of CO2 on past and future climate change. By now, however, the weight of evidence is so great that there is little scientific doubt remaining that the Earth is rapidly becoming warmer even if the exact magnitude is still uncertain. We now take a brief look at some of the different lines of scientific evidence that have been amassed on anthropogenically caused global climate change.
Over the past hundred years, the average temperature of the Earth’s surface has increased by 0.6°C (± 0.2°C). Almost half of this change (0.2–0.3°C) has occurred over the last 25 years, and temperature increases may now be accelerating (Figure 22.5). Since 1980, the Earth has experienced 17 of the 18 hottest years of the
Figure 22.5
Temperature increases over the past 120 years, expressed as differences between annual values and long-term mean temperatures (°C) for the entire Earth (terrestrial and oceanic), the world’s oceans, and the world’s land surfaces. Global temperatures over the past 20 years were consistently above the long-term averages, and most of the hottest years on record occurred recently. Temperature increases have been greater on land than in the oceans, although temperatures are consistently increasing for both. The long-term mean temperatures were calculated from data recorded at thousands of worldwide terrestrial and oceanic observation sites for the entire period of the data, and by interpolation for areas that were not monitored. (Unpublished data of T. C. Peterson, U.S. National Climatic Data Center/NOAA, October 2001.)
Deviation from mean temperature (°C)
0.9
Land and ocean
0.6
0.3
0.0
–0.3
–0.6
0.8
Ocean
0.5
0.2 –0.1 
 –0.4
–0.4
1.2
Land
0.9
0.6
0.3
0.0
–0.3
–0.6
–0.9
–1.2 


 1880 1900 1920 1940 1960 1980 2000
Year
PAGE PROOF: 2ND PASS
twentieth century. Some regions have experienced much greater warming, while others have not warmed as much, or have even cooled. The greatest warming has occurred in northern latitudes (between 40° N and 70° N across Eurasia and North America). Summer temperatures in the Northern Hemisphere in recent decades have been the warmest in the past thousand years. Nighttime temperatures are increasing more than daytime temperatures, leading to reduced day/night differences in many places.
In addition to direct measurements of increasing temperatures, indirect data also show evidence of general global warming. Glaciers are retreating, snow cover is decreasing and melting earlier in the spring, and Arctic sea ice has declined both in thickness and in the area it covers. Permafrost in the Arctic is melting. In the Antarctic, the rate at which the ice shelves that ring much of the continent are breaking up appears to be increasing. There is evidence of both surface melting and warming below floating ice, and average air and water temperatures around the coastlines of Antarctica are becoming higher as well. Sea levels globally have already risen between 10 and 20 centimeters in the past hundred years, largely due to the expansion of water when it warms.
Temperature is not the only aspect of global climates that is changing. The frequency and intensity of El Niño Southern Oscillation events (see Chapter 18) also appears to have increased over the past few decades, with an abrupt increase in the mid-1970s that has persisted since then. ENSO events have been occurring for at least hundreds of years (and maybe far longer). However, it is hypothesized that recent global warming, by pumping heat energy into the surface of the oceans, will intensify their effects. Although some scientists have predicted that a consequence of global warming will be a global increase in extreme weather, there is presently no evidence for general increases in extreme events or weather variability across the entire globe.
At a regional scale, however, there has been an increase both in the variability of weather conditions and in extreme events. It has not been firmly demonstrated that there is a tie between these ENSO-related increases and global warming, but there are some reasons to believe that there may be a connection between the two. There is evidence suggesting that heavy rainfall events have become more severe regionally, particularly at higher latitudes in the Northern Hemisphere. Parts of Africa and Asia have suffered from more frequent and severe droughts, associated in part with shifts in ENSO patterns. ENSO is linked to other regional circulation phenomena that may interact with global warming to further change climates in complex ways that are not yet fully understood.
How long have we known about the greenhouse effect, changes in it as a result of increasing atmospheric
Global Change: Humans and Plants 443
CO2 levels, and global warming? Probably the first scientist who published the prediction that CO2 from the combustion of fossil fuels would lead to global climate change was the Swedish chemist Svante Arrhenius in 1896. It was first confirmed that CO2 concentrations in the atmosphere were actually rising by the 1930s, and by the 1950s there were precise measurements of the magnitude of the increase. Most scientists had accepted the reality of global warming by the 1990s. A small number of scientists do not accept the generally held conclusion that anthropogenic rises in CO2 concentration are responsible for global temperature increases. There is, however, agreement that adding greenhouse gases to the atmosphere must ultimately warm it , and a large majority of scientists today believe the evidence is strong enough to link recent warming to anthropogenic changes in the concentrations of greenhouse gases.
Global Climate Change: Predictions
We have just taken a look at some of the actual changes in the Earth’s climate that are associated with the intensified greenhouse effect. What kinds of changes are predicted for the future? Climatic scientists use a variety of direct and indirect measurements to document climate changes. Predictions for what future climates might be like are made by constructing and refining complex computer simulation models (Box 22A).
The popular reaction to evidence for global warming sometimes seems to be that some warm winter days in temperate regions would actually be pleasant and welcome. What could be wrong with getting to play ball or wash your car outside in the middle of winter? To answer that question, we need to consider more closely what global climate change may entail.
A variety of changes are predicted to result from the greenhouse effect. Averaged across the entire globe, temperatures are likely to rise by 1.4–5.8°C or more over the next hundred years. To get an idea of how large such a change would be, consider that during the most recent glacial maximum 20,000 years ago, temperatures were only about 9°C cooler globally than they are today (see Figure 21.8). Or consider that the average temperature over the year is only 3°C higher in Milan, Italy, than in London, England, and 4°C higher in Charlotte, North Carolina, than in New York City. Clearly, what might seem to be a small average temperature increase can mean a very different climate.
But these temperature increases will not be evenly spread across the globe. Changes in atmospheric and oceanic circulation patterns are forecast to affect temperature, rainfall, and other climatic factors differently at different locations. Land areas will probably warm much more than oceans, and higher latitudes in the Northern Hemisphere will warm much more than other places, particularly in the winter. Summer warming is

444 Chapter 22 |
PAGE PROOF: 2ND PASS |
BOX 22A
Modeling Climate
How do scientists know what the values for temperatures, precipitation, and other weather and climatic variables were in the past, particularly the distant past? There are both direct records of these variables—measurements that have been taken and recorded around the world—as well as indirect records of various kinds. Reasonably good instrumental records have been kept in many places for temperature, rainfall and snowfall, humidity, and air pressure at Earth’s surface for at least a hundred years, but some locations are missing data entirely or for earlier years. For recent years, data from satellites and high-atmosphere weather balloons exist. There are also excellent recent data for global ocean temperatures. Physical, biological, and chemical indicators offer insight into climate and weather further back in time (see Chapter 21). Some of these indicators include measurements of tree rings from trees that are hundreds or thousands of years old, sediments at the bottom of lakes and oceans, air trapped in ancient ice cores, and annual density bands in long-lived corals.
How do scientists make predictions about future climates? Atmospheric sci-
entists use complex computer simulation models, called General Circulation Models or Global Climate Models (GCMs), that incorporate existing weather and climate data, as well as what is known about the major processes that determine climate, to predict climate change. These climatological models have been constructed using largely physical rather than biological data, in contrast to the ecological models discussed in Chapter 15, although they can incorporate some effects of vegetation.
Once a model is constructed, changes in some factors—such as CO2 levels in the atmosphere—can be introduced to see how the climate might be affected in different parts of the globe. Many scientists must work together to construct a GCM, and only a small number of major GCMs exist. These models incorporate large amounts of known data and make predictions about future temperatures, rainfall, snow cover, sea level, and other climatic factors.
Recent research in this area, for example, has included efforts to incorporate more accurate satellite data on Earth’s radiation balance into GCMs (Wielicki et al. 2002). These attempts
have revealed greater variation in radiation fluxes between Earth’s surface and the atmosphere than was previously thought to exist, particularly in the Tropics. Differences in cloudiness appear to account for this variation; clouds both increase reflection of incoming solar radiation (a cooling effect), and reduce infrared radiation to space (a warming effect). A complex set of feedbacks between Earth’s surface and the atmosphere can affect the degree of cloudiness.
The predictions based on GCMs are uncertain to various extents, due to limitations in what is known as well as uncertainty about what human actions will be taken (for example, whether CO2 emissions will be reduced). However, these models have been continually refined and improved, and they are becoming increasingly accurate and detailed. They offer a reasonable set of predictions that will help us to anticipate changes in global climate.
Some of the elements in a Global Climate Model (GCM). The model shown incorporates an atmospheric and an oceanic component. (Based on information from U.S. Global Change Research Program Office.)
expected to be particularly great in central and northern Asia. More hot days and periods of extended intense heat are predicted over all land areas, and average humidity is expected to increase. Cold waves will become fewer and less intense. Glaciers and ice caps will continue their dramatic retreats.
Large changes in precipitation levels and storm severity are also predicted. Large increases in yearly rainfall are expected at high latitudes across the Northern Hemisphere. Winter precipitation is predicted to increase in tropical Africa and at mid-latitudes in the Northern Hemisphere, and summer rainfall is predicted to increase in southern and eastern Asia. Rainfall will decrease in Australia, Central America, and southern Africa, particularly in winter. Rainfall patterns will shift, becoming more variable from year to year almost everywhere, with increased flooding in some years and drought in others. Extreme rainfall events will become
more frequent and more intense (more rainfall per event) over most land areas. Mid-continental areas will become drier, with major implications for the world’s “breadbasket” regions (see Chapter 19). Both mean and peak rainfall during tropical cyclones are expected to increase a great deal, although the frequency of cyclones is not predicted to be greater. The effects on mid-latitude storm intensities are still uncertain.
Sea levels are predicted to rise between 11 and 77 centimeters globally, due largely to the continued thermal expansion of water and, to a lesser extent, to melting glaciers. If this rise occurs as predicted, it will result in widespread coastal flooding. The consequences of this flooding will be felt from low-lying island nations such as the Maldives to highly populated coastal regions from Bangladesh to China to Florida. Most coastal cities— which contain a large proportion of the world’s popu- lation—will also be threatened.

PAGE PROOF: 2ND PASS
Global Change: Humans and Plants 445
|
|
Incoming solar |
|
|
|
|
energy |
Outgoing heat |
ATMOSPHERIC GCM |
|
|
|
|
|
|
|
|
energy |
|
Transition from |
|
|
|
Cirrus clouds |
|
|
|
|
|
solid to vapor |
|
|
|
|
|
Stratus clouds |
|
|
Atmosphere |
|
|
|
(Temperature, winds, |
|
|
|
|
|
|
|
Precipitation and |
|
Cumulus clouds |
and precipitation) |
Snow cover |
|
|
||
evaporation |
|
|
Stratus |
|
|
|
|
|
|
|
Evaporative |
|
clouds |
|
|
and heat energy |
|
|
|
|
exchanges |
|
Precipitation and |
|
|
|
|
|
|
|
|
|
|
evaporation |
Runoff |
|
|
Winds |
|
|
|
Sea ice |
|
|
Soil |
|
|
|
|
moisture |
|
|
|
Heat and salinity |
|
|
|
Ocean |
|
|
|
|
exchange |
|
|
|
|
(Currents, temperature, |
|
Land surface |
Geography |
and salinity) |
|
|
|
|
|||
(Snow cover, vegetation, reflectivity, |
|
|
|
|
topography, and land use) |
|
|
|
|
|
|
|
Ocean bottom |
OCEAN |
|
|
|
GCM |
|
|
|
|
topography |
|
|
|
|
|
|
Atmospheric model layers
Vertical overturning
Ocean model layers
Biotic Consequences of Climate Change
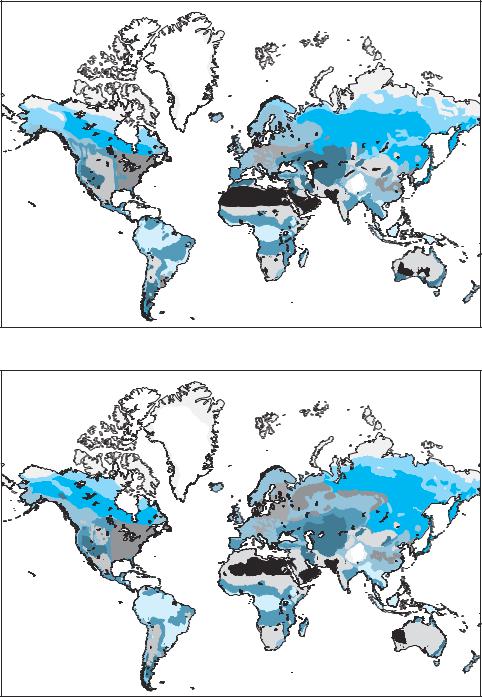
The consequences of regional and global changes in climate are likely to have large, though only partially predictable, effects on plants. The details of these changes are not yet known, but parts of the bigger picture are beginning to come into focus. Some species, ecosystems, and vegetation types will benefit from these changes and increase, while others will lose ground, declining or disappearing (Figure 22.6). While there are models that make specific predictions about particular regions, we will focus here on the general nature of the changes we can expect.
Individual plant physiology, growth, reproduction, and allocation are all likely to be affected by changing climates. Interactions of plants with other species—com- petitors, pollinators, herbivores, and pathogens—will probably change as well. For example, plants that are dependent on highly specialized pollinators or dis-
persers will clearly suffer if environmental changes reduce or eliminate the animals they depend on. Climate change is predicted to alter ecosystem cycling for many major nutrients. Soil respiration and nitrogen mineralization rates, for example, have been shown to increase substantially when ecosystems are warmed experimentally. Some models of climate change predict increases in fire frequency and severity in many ecosystems.
The distributions of many plant species are expected to change, resulting both in shifts in the locations of plant communities and in different combinations of species growing together in the communities of the future. The increases in productivity resulting from higher CO2 levels may be amplified in some ecosystems by warmer climates and longer growing seasons. Other ecosystems will be affected by increased drought, which will cancel out the positive effects of higher CO2 levels on photosynthesis and growth. Changes in temperatures
446 Chapter 22
Figure 22.6
(A) Current distribution of the world’s biomes, as derived from current climatic data using the MAPSS model (Mapped Atmosphere Plant Soil System). (B) Predicted altered distribution of biomes 75 to 100 years in the future, based on one set of scenarios for global CO2 increases. According to this model, the early stages of global warming will lead to increases in the productivity and density of forests worldwide, as increased carbon dioxide levels act as a fertilizer. Continued elevated temperatures, however, will strain water resources, in time producing drought-induced stress and broad-scale die-offs of vegetation, with associated increases in wildfires. (Based on models by Neilson 1995 and data from http://www.fs.fed.us/ pnw/corvallis/mdr/mapss/)
PAGE PROOF: 2ND PASS
(A) Current biome distribution
(B) Predicted distribution, 2070 – 2099
|
|
Tundra |
|
Tropical broadleaf forest |
|
|
|
|
|||
|
|
Taiga/tundra |
|
Savanna/woodland |
|
|
|
|
|||
|
|
Boreal conifer forest |
|
Shrub/woodland |
|
|
|
|
|||
|
|
Temperate evergreen forest |
|
|
Grassland |
|
|
|
|
||
|
|
Temperate mixed forest |
|
|
Arid lands |
|
|
|
|
||
|
|
|
|
|
|