

Кононов / 3
.pdfCorrelation function
The autocorrelation function, G(Δt), calculated in Fluorescence Correlation Spectroscopy (FCS) measurements represents the correlation coefficient between the intensity at time t = 0, I(0), and the intensity at all times, t, later, I(t). The autocorrelation function can be expressed as
G( ) |
x(t) x(t |
) |
|
|
|
||
x |
2 |
||
|
|||
|
|
where m is an integer multiple of a time interval, τ, such that Δt = mτ (where 0 ≤ m < M). I(t) is the timeresolved fluorescence intensity with M + 1 data points spanning from t = 0 to t = Mτ. <I> is the mean intensity over all values of t.

Suppose that we take signal intensity measurements over 100 ns intervals (100 ns is referred to as the counting interval) and thus generate a stream of data as a function of time. Figure 1 shows what such data might look like.
If we examine the data in Figure 1 closely, we see something interesting. The fluctuations do not appear perfectly random. The widths of the peaks and valleys appear to favor a characteristic time scale. The amplitude of the intensity fluctuations may be randomly distributed, but the distribution of times over which they occur is not perfectly random.
Suppose that we were to plot each intensity value against the intensity value one counting interval later. This is shown in the next figures


R(Δt) represents the probability that the intensity stream will still be on the same rising or falling fluctuation some time, Δt, later. Another way to look at it is that the system has memory of where it has been, and the correlation coefficient, R(Δt), expresses how long this memory lasts.
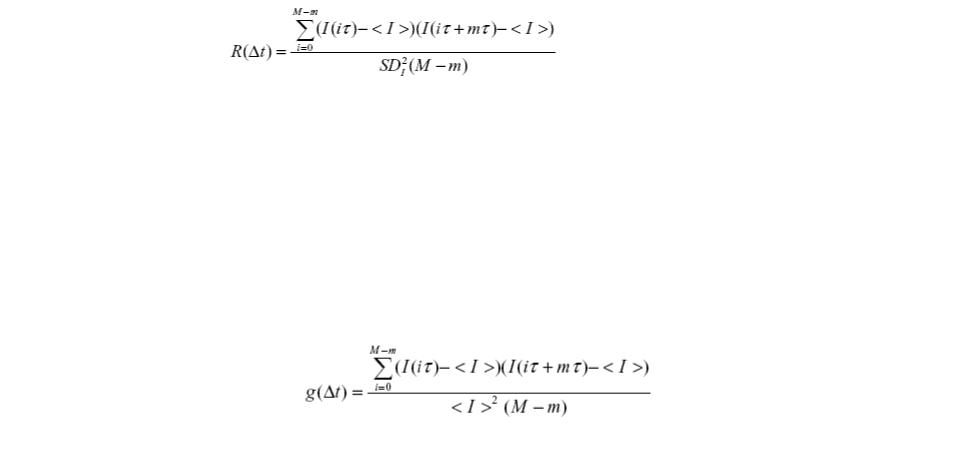
Above, we concluded that R(Δt) represents the probability that the intensity stream will still be on the same rising or falling fluctuation some time, Δt, later. Let us formally express R(Δt) in terms of the intensities. Let us assume, as in the example above,
that Δt is an integer multiple, m, of some counting interval, τ. In this case, xi becomes I(iτ) and yi becomes I(iτ + mτ), such that
where Δt = mτ (0 ≤ m < M) and I(t) is the time-resolved fluorescence intensity with M + 1 data points spanning from t = 0 to t = Mτ.
R(Δt) is an autocorrelation function. It expresses the correlation between the fluctuation from the mean intensity at time 0 with the fluctuation from the mean intensity at later times. It has a characteristic constant, τD, referred to as the correlation time, which is determined by the underlying physics, chemistry, and biology that are causing the intensity fluctuations.
Expressing the Autocorrelation Function

Above, we expressed the autocorrelation, g(Δt), which represents the correlation coefficient between the fluctuation from the mean intensity at time t = 0 and the fluctuation from the mean intensity at some time later.
Computationally, calculating g(Δt) is made difficult because it requires maintaining a running measure of the mean intensity, <I>. As a result, it is more convenient to calculate G(Δt), which represents the correlation between the intensity at time t = 0, I(0), and the intensity at some time later, I(t):