Кононов / 4
.pdf
Continuous
Fourier Transform Spectroscopy
•All modern IR and Raman spectrometers are done in this way
•Measures all frequencies at same time. More efficient at signal-gathering in a give time (better S/N)
•The frequencies present are deconvoluted (or dispersed) after data is collected.
•Fourier Analysis is the mathematical method for doing this. It is based on the theory that any complex periodic (repeats over time) wave can be decomposed into a linear combination of sinusoids

Continuous wave Michelson or Fourier transform
spectrograph
= 2(M−F)


Interferogram & Fourier transformation
•Interference ---- Resulting singnal is called Interferogram.
•Make up the signal having information about every IR frequency which comes from source.
•For identification, frequency spectrum is requried.
•Means of decording frequency via Fourier transformation.
Bruker Optics http://www.brukeroptics.com/

FT
P t |
k cos 2 |
1t cos 2 |
2 t |
FT

http://www.wooster.edu/chemistry/is/brubaker/ir/ir_works_modern.html


Types of Optical Instruments
spectroscope – monochromator, detector is eye
photometer – source, filter, photoelectric detector (fluorometer for fluorescence)
spectrometer – source, 's determined by means other than a filter, electronic detector
spectrograph - source, 's determined by means other than filter, photographic film or plate for detector
spectrophotometer – source, 's determined by means other than a filter, photoelectric detector

From: Skoog and Leary, Principles of Instrumental Analysis, p. 111, 4th edition, Saunders College publishing, New York, 1992.

The Instrument Response Function
(аппаратная функция)
Convolution’, n. Origin: Latin: from ‘convolvere’ – ‘roll together’
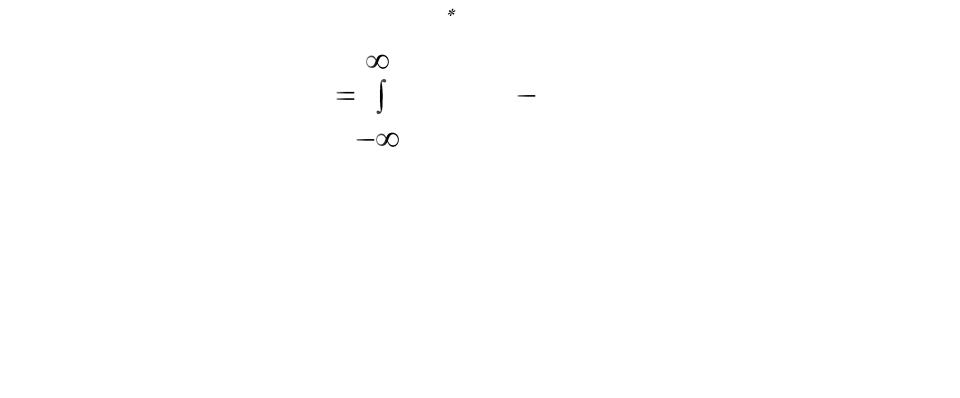
The convolution of two functions f(x) and g(x) (f g) is given by:
h(x') f (x)g(x' x)dx
OK, but what does that integral actually do…?
1.Sketch f(x)
2.Sketch the other function (g(x)) backwards on a transparency
3.Incrementally slide the transparency across the graph paper in the +x direction
4.At each point (x’) calculate the area under the curve representing the product of the two functions.
