

Аппаратура. ГОСТ Р 533363-2009 / NMS_ENG
.pdfPASOLINK Network Management System
(Java version)
The PASOLINK Network Management System Java version (PNMSj) provides easy-to-use monitoring, control, configuration and management of PASOLINK family radio networks.
You can use PNMSj to do the following:
Monitor PASOLINK family radio equipment status.
Control and configure PASOLINK family radio equipment.
Collect Link Performance data.
Update PASOLINK family radio network configuration data.
Features and Benefit
• Any Platform
Free from OS limitations, PNMSj runs on either Windows or UNIX. PNMSj is based on SNMP Manager/Agent Technology.
• Any Client
PNMSj Clients are able to monitor and control NEs using most Web browsers (IE, etc). Remote NEs can be accessible using either PPP serial interface or LAN interface. NE: Network Element
• Advanced Event/Alarm Management
NE List; Event Log; Event Log History; Active Alarm; Alarm Panel; Alarm History; Filter Setting; Severity Setting; Search; Logical Group; Graphical Map;
• Enhanced Performance Management
Conforms to ITU-T G.826 Recommendation Scheduled or on-demand upload
Report or chart presentation Threshold setting and alerts
• Flexible Security Management
Setting changes are recorded in a log with the user’s name. Multi-level user groups
Functions and NEs can be defined for each user group.
• User-friendly Configuration Management
Automatic creation and easy modification of network configuration data using Network Configuration Tool.
Intuitive GUI (Graphical User Interface) simplifies configuration and control of link-related parameters, maintenance operation functions and auxiliary I/O.
Changes to the network configuration made by an operator are recorded in PNMSj Log. (These include Log-in, Alarm Ack, PMC/CTRL Soft Download, Upload / Download to PMC, and Network Configuration file Import.)
• System Management
Database Backup / Restore; Automatic Date/Time Setting to NEs; Color Setting; Polling Setting; Severity Setting;
• Other Function
Upload/Download Configuration File;
MTL-PL-022

System Overview
The PASOLINK Network Management System (Java version) is comprised of three elements, a high performance computer with peripheral equipment, a software package called PASOLINK Network Management System Java version (PNMSj) and PASOLINK Management Card (PM Card) or CTRL Module to be equipped in the PASOLINK or PASOLINK+ and PASOLINK Mx equipment respectively.
The PNMSj is located at a central or a regional operation center and enables network operators to monitor and control the PASOLINK family network elements (NEs) Web browsers.
Alternatively, a laptop computer with simplified software package, called PASOLINK Network Management Terminal - Java version (PNMTj) is available for maintenance purpose at local site.
The PASOLINK family NE at the central site interfaces with the PNMSj through one of the following interfaces.
-PASOLINK: 10BASE-T (LAN) or V.11/RS-232C 19.2/9.6 kbps, Async (through Router)
-PASOLINK+/PASOLINK Mx: 10BASE-T (LAN) or V.11 19.2/9.6 kbps, Async (through Router)
The communication to the remote PASOLINK family NE is established through one of the digital service channels in the network.
|
Digital Service Channel, 9.6kbps, Async |
|
ODU |
|
|
IDU |
|
|
PM CARD |
RS-232C |
|
RS-232C |
||
19.2/9.6kbps, Async |
||
19.2/9.6kbps, Async |
|
|
|
PNMTj |
|
PNMSj |
|
|
|
1 |
|
Serial Interface (RS-232C) |
||
|
Digital Service Channel, 9.6kbps, Async |
|
|
ODU |
|
|
PM CARD |
|
|
IDU |
|
|
|
RS-232C |
10BASE-T(LAN) |
10BASE-T(LAN) |
19.2/9.6kbps,Async |
|
LAN |
PNMTj |
|
|
|
PNMSj |
|
|
LAN Interface
|
Typical Configuration of PNMSj for PASOLINK |
|
|||
|
|
Digital Service Channel, 64kbps, Sync |
Digital Service Channel, 64kbps, Sync |
||
|
|
|
|||
ODU |
|
|
|
|
|
|
|
|
|
ODU |
|
IDU |
|
|
|
|
|
|
|
RS-232C |
|
IDU |
|
V.11 |
|
19.2/9.6kbps, Async |
|
|
|
19.2kbps, Async |
LAN |
10BASE-T |
LAN |
RS-232C |
|
|
|
19.2/9.6kbps,Async |
|||
Existing Network |
PNMSj |
|
|
|
|
|
|
|
|
||
(Dedicated line) |
|
|
|
|
|
|
|
PNMTj |
|
|
|
Router |
LAN |
PNMTj |
LAN |
PNMSj |
|
|
1 |
|
LAN Interface through Router |
LAN Interface |
|
Typical Configuration of PNMSj for PASOLINK+/PASOLINK Mx
MTL-PL-022

PNMSj Management Functions
PNMSj main window
The PNMS GUI is based on standard architecture – containing standard menu and functions. This makes navigating the PNMS window straightforward.
The PNMSj main screen is composed of five main sections. These are:
• Hierarchy View:
Composed of two views – Group View and Connection View.
• Map View:
It shows the correlated location of the network map on a graphical background.
• List View:
It shows a network element list belongs to the group that selects it on Group View.
• Alarm Information View:
It shows a summary of current active alarms.
• Event Log View:
It shows the log of every event in the network.
• Total Alarm
The total count of current active alarms (Not Ack and Total) in each category is shown at the top of the main window.
Link Summary window
There are five ways to display the Link Summary of a specific NE.
1. From Group Map and Connection Map
(Click the target NE ( ) icon on the map to display its Link Summary window.)
2.From Group Map and Connection Map (Right click the NE to display the context menu.)
3.From List View
4.From Alarm Information View
5.From Search result
MTL-PL-022
PNMSj Management Functions
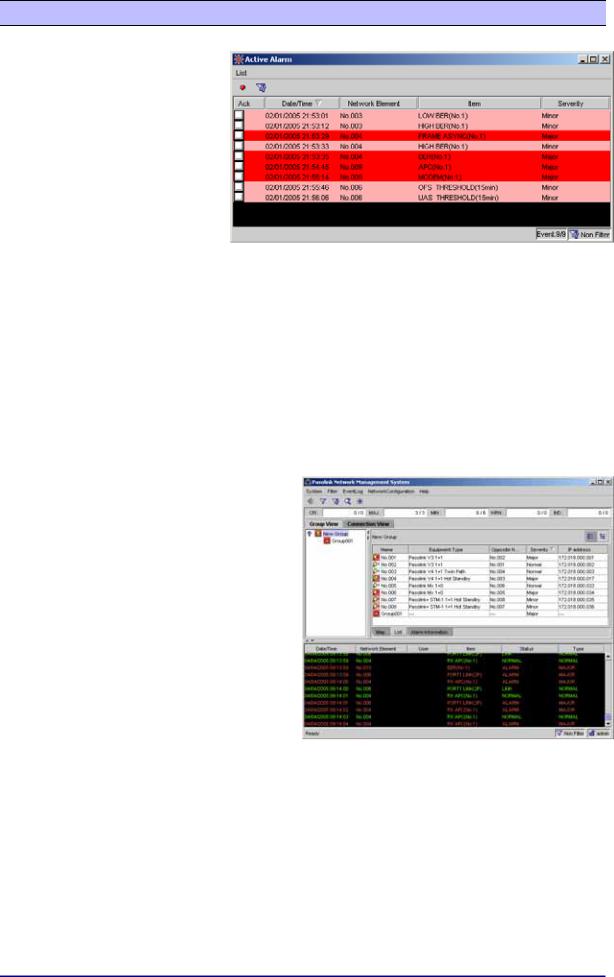
Active Alarm window
The Active Alarm function supports monitoring of active alarms on all connected network elements. Alarms that have been cleared in the NE will be removed on the Active Alarm window and logged in the Alarm History window.
• Ack:
The user can acknowledge any of the alarm items by checking the Ack box opposite the alarm item.
A check mark indicates whether the alarm item has been acknowledged.
• Date/Time:
The date and time that the alarm occurred.
• Network Element:
Indicates the NE name where the alarm occurred.
• Item:
Indicates the name of the alarm.
• Severity:
Indicates the severity to the alarm. The background color of each line is also indicates the color of the severity.
NE List
• List View:
The List View shows the list of network elements belonging to the group selected in the Group View. Contents are as follows. (It is possible to sort it by each column.)
• NE Icon:
Current status of each NE which shows the highest severity color.
• Name:
Network Element name
•Equipment Type:
Network Element Type
•Opposite Network Element:
Network Element name of radio opposite the given NE.
• Severity:
Current status of each NE which shows the highest alarm severity in the target NE.
• IP Address:
IP Address of the NE
MTL-PL-022

PNMSj Management Functions
Alarm Information
• Alarm Information View:
The Alarm Information View is used to view the summary of current active alarms. This screen shows the list of active alarm information of NEs belonging to the same group. The list also shows what alarm severities are currently active in the NE and whether it has been acknowledged or not.
• Group/NE Icon:
Current alarm status of the group or NE which shows the highest alarm severity color.
• Name:
Network Element name
• Critical (Not Ack / Total):
Shows the total number of critical alarms in the NE or group and how many of those alarms have not been acknowledged yet.
• Major (Not Ack / Total):
Shows the total number of major alarms in the NE and how many of those alarms have not been acknowledged yet.
• Minor (Not Ack / Total):
Shows the total number of minor alarms in the NE and how many of those alarms have not been acknowledged yet.
• Warning (Not Ack / Total):
Shows the total number of Warning alarms in the NE and how many of those have not been acknowledged yet.
• Indeterminate (Not Ack / Total):
Shows the total number of Indeterminate alarms in the NE and how many of those have not been acknowledged yet.
• Total Alarm
The total number of Active alarms in all the managed NEs in network are displayed according to severity. The format is the same as Alarm Information View.
MTL-PL-022

PNMSj Management Functions
Alarm History display
• Ack:
This shows whether the alarm was acknowledged before it recovered. It will not be possible to acknowledge alarms in this window.
•Network Element:
NE name
•Item:
Alarm name
• Severity:
The alarm severity of the given alarm. The font of the alarm item indicates its severity.
• Start Time:
The date and time when the alarm occurred.
• End Time:
The date and time when the alarm recovered.
Event Log History display
• Date/Time:
The date and time when the event occurred.
•Network Element:
NE name
•User:
If the event is due to operator control, the user name used by the operator is shown in this column.
• Item:
The name of the event (status, control or alarm).
• Status:
Shows the status of the event.
• Type:
Shows whether the alarm was operator control, system status log or alarm log. In case of alarm log, the severity is shown in this column.
MTL-PL-022

PNMSj Management Functions
Filter
This function allows the flexible viewing of Active
Alarm, Event Log, Alarm History, Event Log
History window.
This window is accessible from the PNMSj main window and is available in all the log windows. User can customize the list of events displayed by setting and activating this filter.
Network Element Search
This function allows the operator to locate NEs by providing one or a combination of the following NE information:
1.Network Element Name
2.Equipment Type
3.Opposite Network Element
4.IP Address
MTL-PL-022

Network Configurations
The PNMSj supports various network configurations, from a simple trunk-line network structure to complex multi-branch networks. The number of manageable Network Elements (NEs) per one PNMSj is up to 10,000*.
*The PNMS PC, workstation or server specification must be considered to provide recommended performance.
1)Multi branches network
The figure shows a trunk network with multi branches network, monitored and controlled by the PNMSj as demonstrated in the figure to the right. At remote site-C for example, up to 13 branches for PASOLINK and up to 29 branches for PASOLINK+/PASOLINK Mx per site are available.
|
(For PASOLINK) |
Digital Service Channel |
|
|
|
PPP, RS232C/V.11 |
|
||
PNMSjLAN |
LAN |
9.6bps Async for PASOLINK |
DigitalRemoteServiceClusterChannel-A |
|
19.2/9.6kbps, Async |
||||
PNMSj |
(For PASOLINK+) |
64kbps Sync for PASOLINK+ |
9.6bps Async for PASOLINK |
|
|
|
PPP, V.11 |
|
64kbps Sync for PASOLINK+ |
|
19.2kbps,Async |
Remote Site-B |
|
|
|
M |
M |
|
|
|
|
|
||
Network operation |
|
Network operation |
M |
Center |
|
Center |
|
M |
RemoteRemoteSite-ClusterE |
-B Remote Site-C |
Multi-drop line |
Remote Site-A |
|
RS485 |
|
|
9.6kbps Async(PASOLINK) |
M |
|
19.2kbps Async(PASOLINK+) |
||
|
Remote Cluster-C
|
Remote Site-G |
Remote Site-F |
Remote Site-D |
|
|
M |
|||
|
|
|
||
|
: Router |
|
Multi-drop line |
|
|
: PASOLINK/PASOLINK+ |
RS485 |
||
|
9.6kbps Async(PASOLINK) |
|||
|
: |
: ROUTER |
|
|
M |
MODEM / Microwave Radio Equipment |
19.2kbps Async(PASOLINK+) |
||
|
: PASOLINK/PASOLINK+ |
|
||
M |
M |
|
||
: Dedicated leased line / Digital Service Channel |
||||
2)Multi cluster network
The figure shows a multi-cluster network monitored and controlled by the PNMSj through other vendor’s microwave equipment (digital service channel) or modem (dedicated leased line). Following physical interface is available between PASOLINK and other vendor’s equipment.
Between PNMSj and PASOLINK cluster
<PASOLINK>
-10BASE-T (LAN)
-RS-232C/V.11 19.2/9.6 kbps, Async
<PASOLINK+/PASOLINK Mx>
-10BASE-T (LAN)
-V.11 19.2/9.6 kbps, Async
Between each PASOLINK clusters
<PASOLINK>
-RS-232C, 9.6 kbps, Async
-RS-485 (V.11), 9.6 kbps, Async
<PASOLINK+/PASOLINK Mx>
-V.11, 64 kbps, Sync
-RS-485 (V.11), 19.2 kbps, Async (for multi-drop connection)
|
(For PASOLINK) |
Digital Service Channel |
|
LAN |
PPP, RS232C/V.11 |
Remote Cluster-A |
|
19.2/9.6kbps, Async |
9.6bps Async for PASOLINK |
||
PNMSj |
(For PASOLINK+) |
64kbps Sync for PASOLINK+ |
|
|
PPP, V.11 |
|
|
|
19.2kbps,Async |
|
|
M |
M |
Network operation |
M |
|
Center |
|
|
|
M |
Remote Cluster-B |
Multi-drop line |
|
|
RS485 |
|
|
9.6kbps Async(PASOLINK) |
M |
|
19.2kbps Async(PASOLINK+) |
|
|
|
|
Remote Cluster-C
M


 : Router
 : PASOLINK/PASOLINK+
M : MODEM / Microwave Radio Equipment
M
 M
M : Dedicated leased line / Digital Service Channel
MTL-PL-022

Network Configurations
3)Multi cluster network
The figure shows a multi-cluster network, monitored and controlled by the PNMSj through LAN interface (IP network). Up to 192 remote clusters (up to 10,000 NEs) can be connected with PNMSj through LAN interface (IP network). The remote clusters are also possible to concentrate by using Management Interface Unit (MIU) and Hybrid Converter (HYB CONV) in the figure to the right.
|
|
|
|
|
|
|
Remote Cluster-A |
|
LAN |
|
|
1 |
|
|
RS-232C |
|
|
|
|
|
|
|
|
|
PNMSj |
|
|
|
|
|
|
|
|
|
|
|
|
2 |
Remote Cluster-B |
|
|
|
|
|
|
|
|
Network operation |
|
|
|
|
|
|
|
Center |
|
|
|
|
|
|
|
|
Customer |
|
|
|
|
Remote Cluster-X |
|
|
|
IP |
|
|
|
|
3 |
|
Network |
|
M |
|
M |
|
|
|
|
|
|
|
|
|
Remote Cluster-Y |
|
|
|
|
|
H |
M |
M |
|
|
|
|
32 |
Y |
||
|
|
|
|
B |
|
|
|
|
|
|
MIU |
OC |
M |
Remote Cluster-Z |
|
|
|
|
|
|
N |
|
|
|
|
|
|
|
V |
M |
|
|
|
|
|
|
|
|
|
|
: ROUTER |
|
H |
|
|
|
|
|
|
Y |
|
|
|
|
|
|
: PASOLINK/PASOLINK |
+ |
B |
: Hybrid Converter |
|
||
|
|
C |
|
||||
MIU |
: Management Interaface Unit |
O |
|
|
|
|
|
N |
|
|
|
|
|||
|
|
V |
|
|
|
|
|
M M : Dedicated leased line / Digital Service Channel |
|
||||||
4)Mixed PDH, STM-1, radio equipment
PNMSj is designed that management of mixed STM-1 and PDH radio equipment can be performed under one PC (NMS). Ring configuration is available only for the PASOLINK+/PASOLINK Mx.
|
Network operation Center |
|
PPP, RS485 |
PNMSj |
LAN |
19.2kbps,Async |
|
|
|
|
|
or |
|
|
10BASE-T(LAN) |
|
Network operation |
|
|
Center |
|
|
PASOLINK(PDH) |
PASOLINK(PDH) |
PASOLINK+(STM-1) |
|
|
|
PASOLINK(PDH) |
: ROUTER |
|
|
: PASOLINK(PDH) |
|
|
: PASOLINK+(STM-1) |
|
|
5)Parallel PNMS configuration
Two PNMSj can monitor and control PASOLINK network (up to 5,000 NEs) simultaneously and independently to provide fault redundancy function. They are connected through Router, as shown in the figure to the right. This configuration is called Parallel PNMSj. “Parallel" means that status change (ex. alarm and event occurrence) of each NE is recognized in both PNMS. Even if one PNMSj is down, the other PNMSj can monitor and control NEs in the network.
(The logging data, performance monitor data and network configuration data are not synchronized between the PNMSj-1 and PNMSj-2.)
Network Operation Center-1 |
|
PNMSj-1 |
|
Customer IP network |
|
PNMSj-2 |
: ROUTER |
Regional Network Operation Center-2 |
: PASOLINK/PASOLINK+ |
|
MTL-PL-022

Network Configurations
6)Hierarchical PNMSj Configuration
Central and Regional PNMSj can be configured as shown in the figure to the right. Regional PNMSj monitors and controls PASOLINKs (up to 10,000 NEs) in its region. Central PNMS monitors and controls all PASOLINKs (up to 10,000 NEs) in all regions (up to 50 regions). It is considered an alternative configuration of “Parallel PNMSj “.
Each NE is monitored and controlled by both Central and Regional PNMSj. It means that even if Central PNMSj is down, each Regional PNMSj can monitor and control NEs in its monitored and controlled region.
In a similar way, if a regional PNMS is down, the central PNMSj can monitor and control NEs under the region where the regional PNMSj is down.
(The logging data, performance monitor data and network configuration data are not synchronized between the central PNMSj and Regional PNMSj. Central PNMSj has some restriction of the function.)
Network Operation |
Center |
Central PNMSj |
|
Regional PNMSj |
Regional PNMSj |
Regional Operation Center-1 |
Regional Operation Center-4 |
|
Customer IP Network |
Regional Operation Center-2 |
Regional Operation Center-5 |
Regional Operation Center-3
Regional Operation Center-6
7)Higher-level Management Interface
In order to make NEC's PASOLINK family equipment an integral part of a higher-level management system, an optional SNMP interface to higher-level management system is provided with the PNMSj. The interface is based on SNMPv1 and resides on the same PC as the PNMSj. The detailed control and data gathering are performed by the PNMSj. The summarized alarm traps (Summary SNMP trap such as Group of NE summary trap or NE summary trap) are sent to higher-level management system through this interface. As higher-level management system receives summary traps from PNMSj, the operator needs to access the PNMSj for the detail.
In addition, as each PASOLINK family NE also has SNMP interface in itself, each PASOLINK family NE is directly accessible from higher-level management system if required.
The interface to the higher-level management is UDP/IP with Ethernet interface. 10/100BASE-T is assumed for LAN interface.
Higher-level Manager |
Windows PNMSj |
|
|
(Customer’s NMS) |
|
||
(SNMP Manager) |
(SNMP Agent) |
|
|
|
|
LAN |
|
SNMP Trap (Summary) |
|
||
(For PASOLINK) |
|
||
PPP, RS232C/V.11 |
|
||
19.2/9.6 kbps, Async |
|
||
or |
|
|
|
10BASE-T (LAN) |
|
||
(For PASOLINK+) |
SNMP Trap |
||
PPP, V.11 |
|
||
19.2/9.6 kbps, Async |
|
||
or |
|
Alarm Occur |
|
10BASE-T (LAN) |
|||
PASOLINK/PASOLINK+ NETWORK |
|||
|
|
||
MTL-PL-020