- •Contents
- •Course Overview
- •Course Agenda
- •Document Conventions
- •Additional Information
- •The Junos CLI
- •Overview
- •Part 1: Logging In and Exploring the CLI
- •Step 1.1
- •Step 1.2
- •Step 1.3
- •Step 1.4
- •Step 1.5
- •Step 1.6
- •Step 1.7
- •Step 1.8
- •Step 1.9
- •Step 1.10
- •Step 1.11
- •Step 1.12
- •Step 1.13
- •Step 1.14
- •Step 1.15
- •Step 1.16
- •Step 1.17
- •Step 1.18
- •Step 1.19
- •Initial System Configuration
- •Overview
- •Part 1: Loading a Factory-Default Configuration and Performing Initial Configuration
- •Step 1.1
- •Step 1.2
- •Step 1.3
- •Step 1.4
- •Step 1.5
- •Step 1.6
- •Step 1.7
- •Step 1.8
- •Step 1.9
- •Step 1.10
- •Step 1.11
- •Step 1.12
- •Step 1.13
- •Step 1.14
- •Step 1.15
- •Step 1.16
- •Part 2: Saving, Displaying, Loading, and Deleting a Rescue Configuration
- •Step 2.1
- •Step 2.2
- •Step 2.3
- •Step 2.4
- •Step 2.5
- •Step 2.6
- •Step 2.7
- •Step 2.8
- •Step 2.9
- •Part 3: Configuring Interfaces and Verifying Operational State
- •Step 3.1
- •Step 3.2
- •Step 3.3
- •Step 3.4
- •Secondary System Configuration
- •Overview
- •Part 1: Configuring User Authentication
- •Step 1.1
- •Step 1.2
- •Step 1.3
- •Step 1.4
- •Step 1.5
- •Step 1.6
- •Step 1.7
- •Step 1.8
- •Step 1.9
- •Step 1.10
- •Step 1.11
- •Step 1.12
- •Step 1.13
- •Step 1.14
- •Step 1.15
- •Step 1.16
- •Step 1.17
- •Step 1.18
- •Step 1.19
- •Part 2: Performing System Management Options
- •Step 2.1
- •Step 2.2
- •Step 2.3
- •Step 2.4
- •Step 2.5
- •Step 2.6
- •Step 2.7
- •Step 2.8
- •Step 2.9
- •Step 2.10
- •Step 2.11
- •Step 2.12
- •Step 2.13
- •Step 2.14
- •Step 2.15
- •Step 2.16
- •Step 2.17
- •Step 2.18
- •Operational Monitoring and Maintenance
- •Overview
- •Part 1: Monitoring System and Chassis Operation
- •Step 1.1
- •Step 1.2
- •Step 1.3
- •Step 1.4
- •Step 1.5
- •Step 1.6
- •Step 1.7
- •Step 1.8
- •Step 1.9
- •Step 1.10
- •Step 1.11
- •Step 1.12
- •Step 1.13
- •Step 1.14
- •Step 1.15
- •Step 1.16
- •Part 2: Using Network Utilities and Monitoring Traffic
- •Step 2.1
- •Step 2.2
- •Step 2.3
- •Step 2.4
- •Step 2.5
- •Step 2.6
- •Part 3: Upgrading the Junos OS
- •Step 3.1
- •Step 3.2
- •Step 3.3
- •Step 3.4
- •Step 3.5
- •Part 4: Recovering the Root Password
- •Step 4.1
- •Step 4.2
- •Step 4.3
- •Step 4.4
- •Step 4.5
- •Step 4.6
- •Step 4.7
- •Step 4.8
- •Lab 5 (Optional)
- •The J-Web Interface
- •Overview
- •Part 1: Logging In to and Exploring the J-Web Interface
- •Step 1.1
- •Step 1.2
- •Step 1.3
- •Step 1.4
- •Step 1.5
- •Step 1.6
- •Step 1.7
- •Step 1.8
- •Step 1.9
- •Part 2: Exploring J-Web Configuration and Diagnostic Capabilities
- •Step 2.1
- •Step 2.2
- •Step 2.3
- •Step 2.4
- •Step 2.5
- •Step 2.6
- •Step 2.7
- •Step 2.8
- •Step 2.9
- •Appendix A: Lab Diagrams

Introduction to the Junos Operating System
Part 1: Monitoring System and Chassis Operation
In this lab part, each team will use key commands within the CLI to monitor system and chassis operation.
Step 1.1
Ensure that you know to which student device you have been assigned. Check with your instructor if you are not certain. Consult the management network diagram to determine the management address of your student device
Question: What is the management address assigned to your station?
Step 1.2
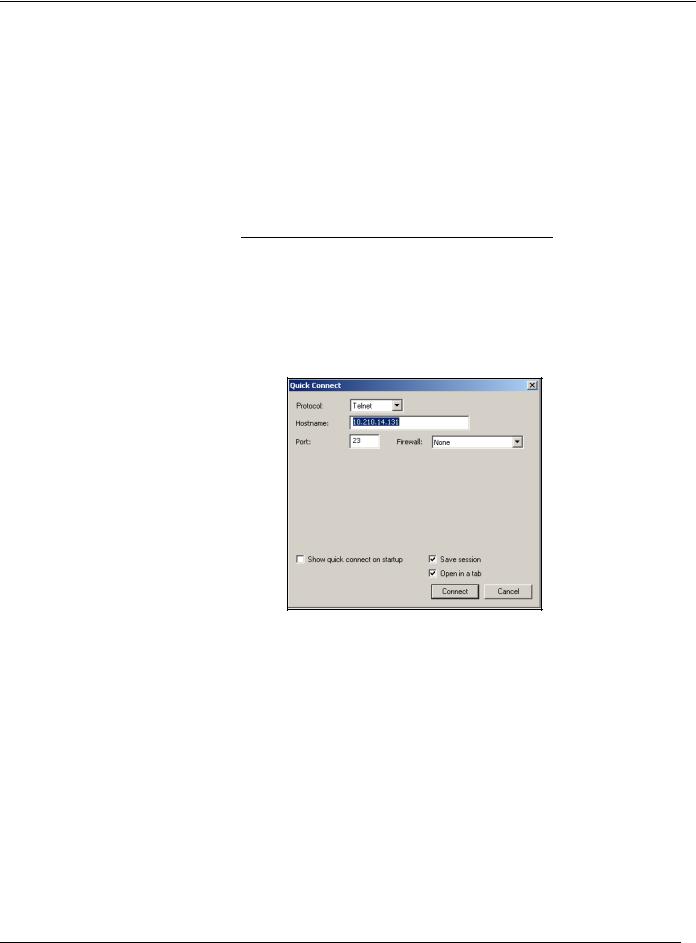
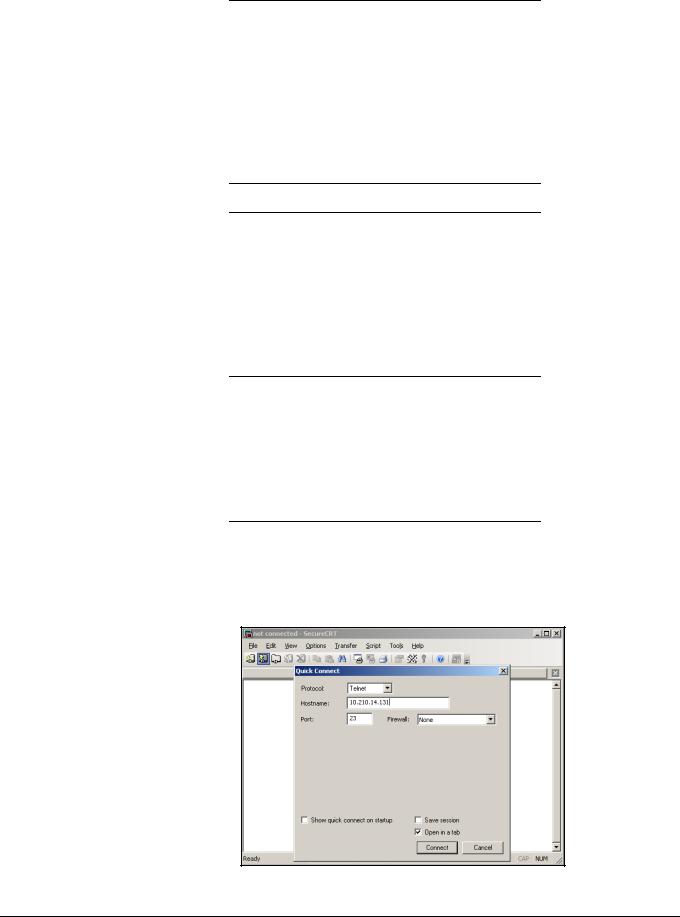
Access the CLI at your station using either the console, Telnet, or SSH as directed by your instructor. Refer to the management network diagram for the IP address associated with your team’s station. The following example uses a simple Telnet access to srxA-1 with the Secure CRT program as a basis:
Step 1.3
Log in to the student device with the username lab using a password of lab123. Note that both the name and password are case-sensitive. Enter configuration mode and load the reset configuration file using the load override /var/home/ lab/ijos/lab4-start.config command. After the configuration has been loaded, commit the changes and return to operational mode.
Step 1.4
Issue the show system processes extensive command to check the status of the routing protocol daemon (rpd). Alternatively, issue the show system processes extensive | match "pid | rpd" command to parse the output. The use of two pipes (|) in this command allows you to make multiple matches. In this case it matches rpd for the routing protocol process as well as PID to view the column headers.
Lab 4–2 • Operational Monitoring and Maintenance |
www.juniper.net |

Introduction to the Junos Operating System
Question: What is the weighted CPU usage of rpd?
Step 1.5
Issue the show system statistics command to view protocol statistics related to your team’s device.
Question: How many TCP packets did your assigned device send since the last clearing of the system statistics?
Step 1.6
Issue the show system storage command to view information regarding the device storage space.
Question: How much free space is available on your device?
Step 1.7
Issue the show system uptime command to view the current system time.
Question: When was your team’s device last booted?
Step 1.8
Open another terminal window and use Telnet to access your system’s management IP address. If needed, refer to the management network diagram. Log in with the username walter and the password walter123.
www.juniper.net |
Operational Monitoring and Maintenance • Lab 4–3 |

Introduction to the Junos Operating System
Step 1.9
Return to the original session opened to your device.
Return to the original session logged in as lab and issue the show system users command to view information about users logged in to your team’s device.
Question: What is the source IP address of the
Telnet session established by the user walter?
Step 1.10
Issue the request system logout user walter command to force a log out for the user walter. Next, issue the show system users command to verify that the user session for walter was terminated.
Question: Was the user Telnet session for walter properly closed?
Step 1.11
Check the environmental status of your team’s device by issuing the show chassis environment command.
Question: What is the temperature and status of the
Routing Engine (RE)?
Question: Name another show chassis command that displays the RE temperature. (Hint: Use the ?.)
Step 1.12
Issue the show chassis temperature-thresholds command.
Question: At what temperature is a red alarm generated for the RE?
Step 1.13
View details about your system’s hardware components using the show chassis hardware command.
Question: What is the chassis serial number for your team’s device?
Lab 4–4 • Operational Monitoring and Maintenance |
www.juniper.net |

Introduction to the Junos Operating System
Step 1.14
Issue the show interface terse command to quickly verify the administrative and link state for your device’s interfaces.
Question: What are the Admin and Link states for all configured interfaces?
Step 1.15
Issue the show interfaces ge-0/0/0 extensive command and answer the questions that follow:
Question: What is the SNMP ifIndex for ge-0/0/0? What about for ge-0/0/0.0?
Question: What is the current hardware address for the ge-0/0/0 interface?
Question:
Does the ge-0/0/0 interface show any input errors?
Question: Does the ge-0/0/0 interface show input and output traffic statistics? How are those statistics counted?
Step 1.16
Issue the clear interfaces statistics ge-0/0/0 command followed by the show interfaces ge-0/0/0 extensive | find "traffic" command.
Question: Were the statistics for the ge-0/0/0 interface successfully cleared?
STOP |
Wait for your instructor before you proceed to the next part.
www.juniper.net |
Operational Monitoring and Maintenance • Lab 4–5 |
