

Сборник трудов конференции СПбГАСУ 2014 ч
.1.pdfРаздел 3. Аналитические и численные методы исследований оснований и фундаментов
paction tests on a new runway in Paris, Menard realised that while strengthdeformation properties were important, field tests and measurements were not able to measure them. Consequently, he developed the first prototype of the Menard pressuremter as his dissertation and filed for a patent for it in 1954 at the age of 23. Menard later improved his invention and carried out the first tests with the new probe while studying for a Master’s degree under the supervision of Professor Peck at the University of Illinois, and filed for a second pressuremeter patent in 1959(Communication Department of Menard, 2007). Baguelin et al. (1978) and ASTM (2007) describe the device and the testing procedure in full.
Menard set up a bilingual quarterly technical journal, Sols-Soils, in 1962 and continued to publish the fundamentals of calculation concepts and procedures using the pressuremeter and his other innovations until his death in 1978. To date, these publications remain the basis of all well-established codes and standards.
2. New Approaches
Bearing capacity has historically been based on Mohr-Coulomb failure criterion and bearing capacity factors (Prandl, 1920; Terzaghi 1943; Bolton and Lau, 1993). Menard has directly related bearing capacity to PMT limit pressure, PLM, and factors that are a function of shape and embedment depth (Menard, 1975). Ultimate bearing capacity of a foundation can be calculated using Equation 1:
(1) qu= ultimate bearing capacity, qo= total overburden pressure at the periphery of the foundation level after construction, k= a bearing factor varying from 0.8 to 9 according to the embedment, the shape of the foundation level after construction. It is the authors’ experience with thousands of footings that Equation 1 yields very reliable results.
Menard and Rousseau (1962) have carried out full scale field tests on footings, and have observed that contrary to the formulas derived from the elastic theory for homogeneous, elastic medium, settlement does not increase in direct proportion to the width of the footing. According to Menard (1975), foundation settlement due to external loads is the result of two completely different phenomena; i.e. volumetric compression and shear deformation. The first phenomenon is caused by the spherical component of the stress tensor. The increase of bulk pressure (volumetric compression) causes a reduction in volume of the material in relation to the modulus of volumetric compression. On the other hand, the latter phenomenon is caused by the deviatoric components of the stress tensor, and displacements occur without variation in volume of the material.
Total final settlement, s, can be estimated for a footing with width and length respectively equal to B and L, that is embedded by at least the footing width using Equation 2 when the width is greater than 0.6 m (Menard, 1975). In this equation the first and second terms that are multiplied by the mean contact added stress respectively represent the influence of the deviatoric and volumetric stress tensors. There is also a negligible term corresponding to a purely elastic settlement that has been omitted from Equation 2 (Menard and Rousseau, 1962; Menard, 1975).
551
Современные геотехнологии в строительстве и их научно-техническое сопровождение
(2)
q= design normal pressure applied on the footing, σvo= total (initial) vertical stress at the level of the footing base, Bo= reference footing width, equal to 0.6 m, B= footing width, α= rheological factor, which can be different in the two terms of Equation 1 according to the prevalent material in each zone of influence, λd and λc= shape factors, Ec= weighted value of PMT (Menard) Modulus, EM, from under the footing to a depth equal to half the footing width, and Ed= harmonic mean of EM in all layers down to the depth of 8B below the footing.
Immediate field interpretation of the PMT parameters Pf (creep or end of pseudo elastic phase pressure), PLM, EM, have made this test a choice instrument for design and acceptance for specific soil improvement techniques.
3. Early Applications of PMT in Ground Improvement
The pressuremeter was already developed, well-established and had gained international recognition in 1969 when the Mandelieu-la-Napoule five story buildings project was to be constructed on 11 hectares of reclamation in the French Riviera. Up to 6 m of fill was loosely dumped onto loose marine bay silts for preparing the platform. The building were designed to be supported by piles subjected to substantial amounts of negative skin friction; however the utilities would have undergone excessive amounts of differential settlement without implementation of specific measures. Menard applied his newly developed ground improvement technique, dynamic compaction, using an 8 ton pounder that was dropped from 10 m height, and verified the performance using the pressuremeter test.
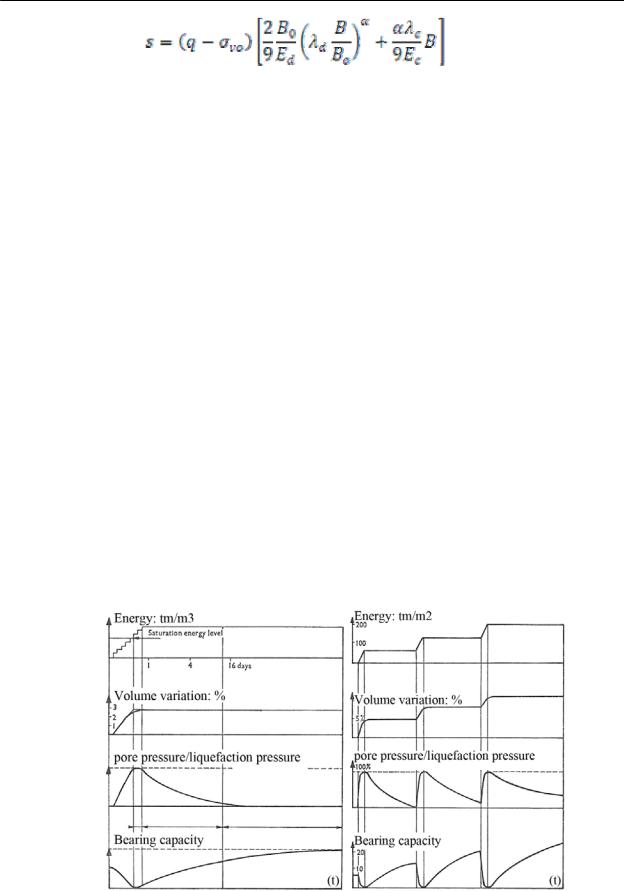
Once of the first experiences of dynamic compaction were obtained, Menard and Broise (1975) developed the curves of Figure 1, which show the variation of ground behavior during the different stages of dynamic compaction and at rest periods.
Fig. 1: (a) changes in the soil after consolidation phase, (b) Variation to a soil subjected to a series of dynamic consolidation passes (Menard, 1975)
552

Раздел 3. Аналитические и численные методы исследований оснований и фундаментов
4. The Pressuremeter and Ground Improvement
Chu et al (2009) define ground improvement methods as (A) without admixtures in non-cohesive soils, (B) without admixtures in cohesive soils, (C) with admixtures or inclusions and (D) with grouting type admixtures.
The pressuremeter has gained a major role in quality assurance and design verification further to ground improvement methods Categories A and C. For Category A, CPT is frequently used as a quick test to determine the thickness and broad nature of the soil, and SPT is used to determine the liquefaction potential as a function of blow counts and grain size. However, the pressuremeter remains the test that is capable of directly measuring shear parameters for bearing capacity and deformation moduli for settlement calculations. One of the advantages of utilizing the pressuremeter test and that the associated calculations do not resort to potentially misleading correlations that are often overextended to conditions that do not similar to the conditions in which the correlations were developed in the first place.
Furthermore, the pressuremeter seems to be the only valuable tool for measuring self-bearing level or under consolidation of fills (Varaksin and Liausu, 1989; Varaksin et al., 2005). Menard (1975) proposed that, as a rule of thumb, PLM has to be equal to or greater than 600kPa to reach self-bearing in sands of less than 10 m thickness. As a first approximation, he also proposed to estimate the one-year creep of any soil by Equation 3. In this equation w is creep settlement in cm, h is fill thickness in cm and α is the rheological factor. The unit for PLM in Equation 3 is bars (=100 kPa). PMT can also be used to predict required strains in the soil to meet predefined criteria (Hamidi et al., 2010a; Hamidi et al., 2011).
(3)
Frequently, in large scale projects ground conditions necessitate a combination of Category A and C soil improvement methods. For example, at King Abdulla University of Science and Technology project in Saudi Arabia more than 2.6 million m2 of the construction area was to be built on heterogeneous soils consisting of up to 9 m of loose silty sand or soft sandy silt (Hamidi et al., 2010b). Dynamic compaction, dynamic replacement and dynamic surcharging were used in this project based on the soil type and thickness. Figure 2 shows the relationship between post compaction net limit pressure, fines content (from SPT split spoon samples) and compaction energy (from number of pounder blows and grid spacing), and it can be observed that the efficiency of dynamic compaction was relatively low in the sabkah areas. In those areas dynamic replacement was able to provide a homogeneous foundation platform the meet the footings’ design criteria.
Large diameter stone columns of 2 to 2.5 m diameter were created by the dynamic replacement process, and pressuremeter tests were performed inside the columns (sand and gravel) and between the columns in the silt and sabkah. Finite
553

Современные геотехнологии в строительстве и их научно-техническое сопровождение
element analysis was utilized to obtain the deformations of the soil-column foundation.
Fig. 2: The relationship between net limit pressure, fines content and improvement energy (Hamidi et al., 2010b)
The self-bored slotted tube or STAF method is used to test gravel sand columns (Arsonnet et al., 2005). The STAF technique was utilized recently from a jack up barge, to perform the pressuremeter tests down to a depth of more than 30 m in an offshore dynamic replacement project in Southeast Asia (Hamidi et al., 2010c). The technique consisted of sealing a casing to the sea floor and driving a BX size slotted casing with advanced drilling and by utilizing an eccentric bit. The slotted casing was advanced to the required depth, the bit was removed and the pressuremeter probe was inserted to depth. After the test, the slotted casing was jacked up one meter and the next test was performed. Figure 3 shows the STAF drag bits that can either have blades or buttons.
Fig. 3: STAF drag bit (Varaksin and Hamidi, 2013)
The application of the pressuremeter test is often less appropriate in Category B and D ground improvement methods as consolidation processes require ad-
554

Раздел 3. Аналитические и численные методы исследований оснований и фундаментов
ditional monitoring processes, and grout parameters can be obtained by in-situ sampling and lab testing. However, determination of shear strength increments (for techniques such as vertical drains and vacuum consolidation) can be investigated by PMT techniques, and linking cohesion and friction angle to PLM and EM (Menard 1967 and 1970). The same concept may be used for the implementation of PMT parameters in commercial finite element software.
5. Conclusion
The authors’ 40 years of experience of utilizing the pressuremter test for verification of Category A and C ground improvement projects has led to numerous soil improvement projects with successful results. In Category C techniques with columnar inclusions and in-situ soil bearing the loads together, the self-bored PMT STAF method has become very popular for determining the parameters to perform a two stage analysis using a single column and a homogenized model.
Numerical methods are a valuable tool for predicting deformations; however as the input parameters are frequently based on Mohr Coulomb, correlations must be used to relate the PMT parameters to the input parameters. Thus, an urgency appears to exist for developing numerical methods that directly implement the pressuremeter parameters.
References
1.Arsonnet, G., Baud, J. P. & Gambin, M. P. (2005) Pressuremeter Tests Inside a SelfBored Slotted Tube (STAF). ISP5Pressio 2005, Paris, 31-45.
2.ASTM (2007) Standard Methods for Prebored Pressuremeter Testing in Soils.
D4719-07.
3.Baguelin, F., Jezequel, J. F. & Shields, D. H. (1978) The Pressuremeter and Foundation Engineering, Aedermannsdorf, Trans Tech Publications, 617.
4.Bolton, M. D. & Lau, C. K. (1993) Vertical Bearing Capacity Factors for Circular and Strip Footings on Mohr-Coulomb Soil. Canadian Geotechnical Journal, 30, 1024-1033.
5.Chu, J., Varaksin, S., Klotz, U. & Mengé, P. (2009) State of the Art Report: Construction Processes. 17th International Conference on Soil Mechanics & Geotechnical Engineering: TC17 meeting ground improvement, Alexandria, Egypt, 7 October 2009, 130.
6.Communication Department of Menard (2007) Menard – Half a Century of History – Un Demi Siècle d'Histoire, Mame à Tours, 176.
7.Hamidi, B., Varaksin, S. & Nikraz, H. (2010a) Predicting Soil Parameters by Modelling Dynamic Compaction Induced Subsidence. 6th Australasian Congress on Applied Mechanics (ACAM6), Perth, Australia, 12-15 December, Paper 1150.
8.Hamidi, B., Varaksin, S. & Nikraz, H. (2010b) Implementation of Optimized Ground Improvement Techniques for a Giga Project. GeoShanghai 2010 Conference, ASCE Geotechnical Special Publication No 207: Ground Improvement and Geosynthetics, Shanghai, 3-5 June, 87-92.
9.Hamidi, B., Yee, K., Varaksin, S., Nikraz, H. & Wong, L. T. (2010c) Ground Improvement in Deep Waters Using Dynamic Replacement. 20th International Offshore and Polar Engineering Conference, Beijing, 20-26 June, 848-853.
555

Современные геотехнологии в строительстве и их научно-техническое сопровождение
10.Hamidi, B., Varaksin, S. & Nikraz, H. (2011) Predicting Menard Modulus using Dynamic Compaction Induced Subsidence. International Conference on Advances in Geotechnical Engineering (ICAGE), Perth, 7-11 November, 221-226.
11.Menard (1967) Interpretation d'un Essai Pressiometrique. D31/67. Sols Soils.
12.Menard, L. (1970) Détermination de la Poussée Exercée par un Sol sur une Paroi de Soutènement. Publication D/38/70.
13.Menard, L. (1975) Sols Soils No. 26 – D60 The Menard Pressuremeter
14.Menard, L. & Broise, Y. (1975) Theoretical and Practical Aspects of Dynamic Compaction. Geotechnique, 25, 1, 3-18.
15.Menard, L. & Rousseau, J. (1962) L'évaluation des tassements – Tendances nouvelles. Sols Soils, 1, 1, 13-29.
16.Prandtl, L. (1920) Uber die Harte Plastischer Korper Nachrichten von der Koniglichen Gesellscharf der Wissenschaften, Gottingen, Math.- phys. Klasse, 74-85.
17.Terzaghi, K. (1943) Theoretical Soil Mechanics, New York, John Wiley & Sons, 510.
18.Varaksin, S., Hamidi, B. & D'hiver, E. (2005) Pressuremeter Techniques to Determine Self Bearing Level and Surface Strain for Granular Fills after Dynamic Compaction. International Symposium 50 Years of Pressuremeters (ISP5Pressio 2005), Paris, 22-24 August, 687.
19.Varaksin, S. & Hamidi, B. (2013) Pressuremeter for Design and Acceptance of Challenging Ground Improvement Works. 18th International Conference on Soil Mechanics and Geotechnical Engineering (18th ICSMGE), Parallel session: ISP6 – Pressio 2013, Paris, 2-6 September.
20.Varaksin, S. & Liausu, P. (1989) Coefficient d'autoportance des remblais grossiers récents. 12th International Conference on Soil Mechanics and Foundation Engineering, Rio de Janeiro, 13-18 August, 763-764.
УДК 624.15
Н.Ю. Киселев, Я.А. Пронозин
(ФГБОУ ВПО ТюмГАСУ, Тюмень)
К ВОПРОСУ О ЦЕЛЕСООБРАЗНОСТИ СОЗДАНИЯ ЗАДАННОГО РАСПРЕДЕЛЕНИЯ ДАВЛЕНИЙ ПО ПОДОШВЕ ФУНДАМЕНТА
Внекоторых литературных источниках и исследовательских работах [3, 4, 5, 7, 8] указывается на возможность существенного изменения НДС системы "фундамент-основание" путем управления распределением контактных давлений по подошве фундамента.
Так, например в [7] указывается, что вводя эластичные вкладыши или неравнопрочную подготовку, возможно перераспределить контактные напряжения под подошвой таким образом, чтобы добиться уменьшения изгибающих моментов в теле фундамента, тем самым снижая расход строительных материалов.
Висточниках [3, 4, 5] в свою очередь предлагается "концентрировать" давления на основание на узких лентах, расположенных вдоль силовых осей, догружая основание в пролетной части некоторой гибкой конструкцией, например криволинейной оболочкой. В данном случае позитивный эффект достигается за счет уменьшения глубины активной зоны под узкими ребрами
556
Раздел 3. Аналитические и численные методы исследований оснований и фундаментов
относительно сплошного фундамента, а также повышения прочностных свойств грунта при догружении пролетной части. Строго говоря, данная статья есть результат развития идей изложенных в указанных выше источниках.
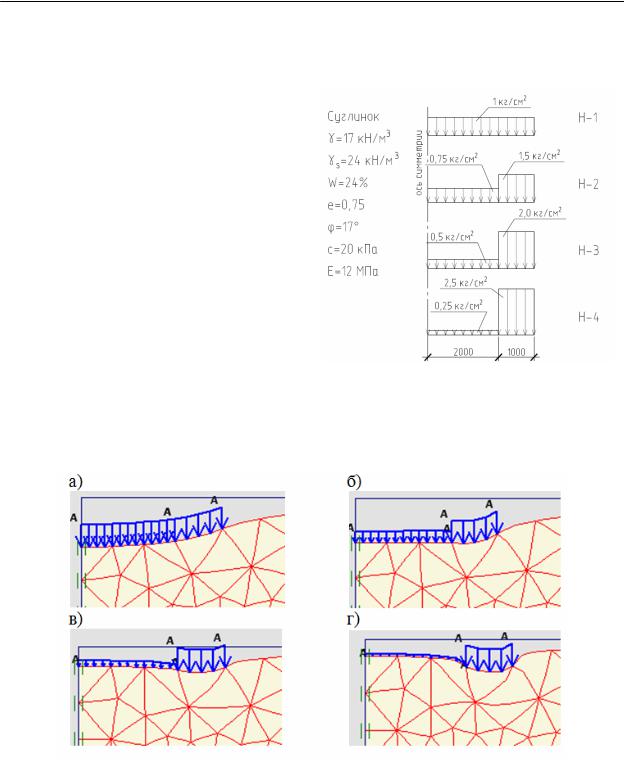
Рассмотрим следующую пло- |
|
скую задачу. Однородное грунтовое |
|
основание, сложенное глинистым |
|
грунтом загружено равномерной на- |
|
грузкой. Сравним НДС основания |
|
при различных вариантах перерас- |
|
пределения нагрузки между ребрами |
|
и пролетной частью. При этом сум- |
|
марная нагрузка на основание остает- |
|
ся величиной постоянной. Расчетная |
|
схема и характеристики грунтов ос- |
|
нования приведены на рис. 1. На ос- |
|
новании исходных данных в ПК |
|
Plaxis 8.2 была составлена конечно- |
Рис. 1. Расчетная схема задачи |
элементная модель и выполнено ее |
решение. На рис. 2. приведены результаты расчета в виде деформированных схем основания для каждого варианта загружения
Рис. 2. Характер деформаций основания при нагружении:
а) Н-1; б) Н-2; б) Н-3; г) Н-4
Очевидно, что при распределении нагрузки по варианту Н-2 осадка под подошвой штампа носит практически прямолинейный характер, что несомненно является положительной характеристикой работы фундамента. Некоторые другие результаты расчета приведены в табл. 1.
557
Современные геотехнологии в строительстве и их научно-техническое сопровождение
|
Результаты расчета задачи |
|
Таблица 1 |
|||
|
|
|
|
|||
|
|
|
|
|
|
|
|
Н-1 |
Н-2 |
|
Н-3 |
Н-4 |
|
Осадка максимальная, |
50 |
44 |
|
51 |
65 |
|
Smax, мм |
|
|
|
|
|
|
Осадка центра, Sц, мм |
50 |
44 |
|
39 |
33 |
|
Осадка ребра, Sр, мм |
39 |
44 |
|
51 |
65 |
|
|
|
|
|
|
|
|
Относительная разность |
0,22 |
0 |
|
0,24 |
0,49 |
|
осадок, |
|
|
|
|
|
|
|
|
|
|
|
|
|
Глубина зон пластиче- |
0 |
1,4 |
|
2,2 |
2,6 |
|
ских деформаций, z, м |
|
|
|
|
|
|
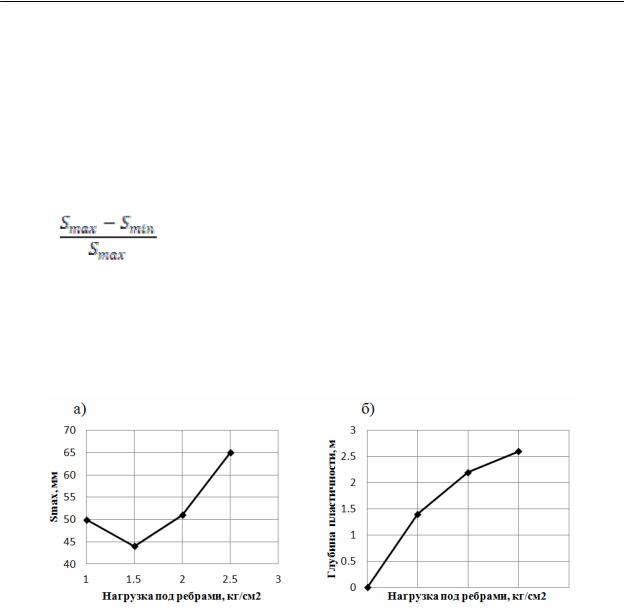
На рис. 3 изображены графики зависимости максимальных деформаций и глубины распространения зон пластичности от величины нагрузки под ребрами штампа.
Рис. 3. Графики зависимости от нагрузки под ребрами: а) максимальных деформаций; б) глубины развития зон пластических деформаций
Анализируя приведенные выше данные, можно сделать вывод, что минимальные значения осадок, а также наибольшая их равномерность соответствует такому давлению на грунт под ребрами, при котором глубина распространения зон пластичности составляет примерно ¼ ширины штампа, т. е. внешняя нагрузка равняется расчетному сопротивлению грунта R. Это позволяет использовать для решения подобных задач математический аппарат теории упругости.
По графикам можно судить о том, что зависимость S и Hсж от перераспределения внешних нагрузок по подошве носит очевидный функциональный характер. Таким образом, с достаточно высокой точностью можно управлять НДС основания в зависимости от геометрических размеров фундамента, его жесткости, параметров нагружения, механических характери-
558
Раздел 3. Аналитические и численные методы исследований оснований и фундаментов
стик грунта, т. е. получить аналитическое решение для общей задачи. Как следствие возможно математическое исследование этих функций и решение оптимизационной задачи для частных условий.
Распределяя давление по подошве гибкого фундамента подобно эпюре контактных давлений жесткого штампа, можно добиться большей равномерности осадок по ширине фундамента [1].
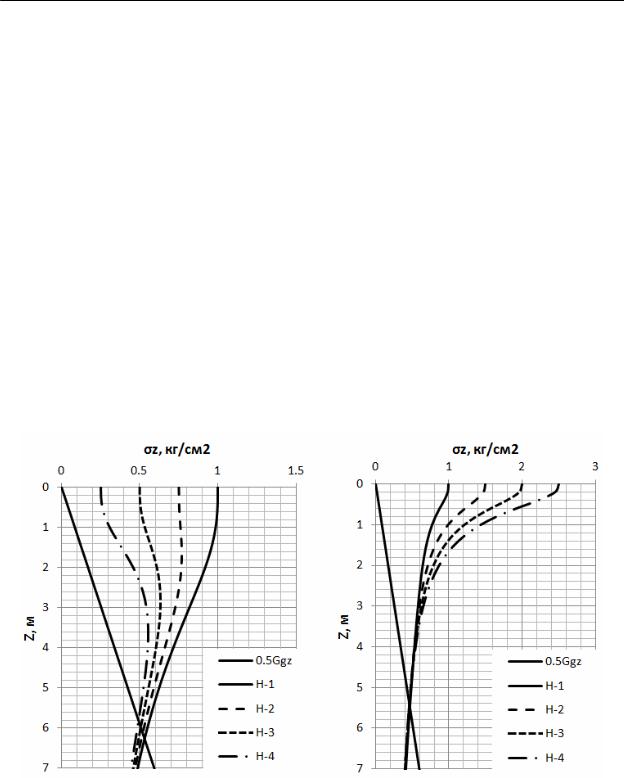
Для юга Тюменской области одной из характерных схем грунтовых условий является наличие в зоне близкой к дневной поверхности твердых и полутвердых глинистых грунтов, обладающих достаточно высокими механическими характеристиками, и подстилающих их слабых текучих и текучепластичных глин и суглинков. При таком напластовании грунтов основания желательно придерживаться конструкции фундамента, обеспечивающей локализацию дополнительных напряжений в более плотных слоях. В качестве иллюстрации к этому тезису приведем графики распределения нормальных вертикальных напряжений по глубине для центральной оси штампа и для оси ребра при различных вариантах загружения представленной выше задачи
(рис. 4).
а) |
б) |
Рис. 4. Распределение вертикальных нормальных напряжений: а) под центром фундамента; б) под ребром фундамента
Как видно их графиков напряжения под узким ребром практически совпадают при глубине более трех метров. В то же время площадь эпюры напряжений по центральной оси пролетной части существенно уменьшается для различных нагружений, а от ее значения зависит величина конечной осадки. Таким образом целесообразно сосредотачивать нагрузку по узким
559

Современные геотехнологии в строительстве и их научно-техническое сопровождение
полосам, что приведет к концентрации напряжений в более прочных верхних слоях и разгружению слабых подстилающих слоев.
Практическим доказательством объективности выводов, основанных на анализе рассмотренного выше примера, могут служить результаты опубликованных экспериментальных исследований. В ходе натурного эксперимента, представленного в [2], исследовались ленточные фундаменты, объединенные цилиндрической оболочкой, а также плоские штампы, схема которых представлена на рис. 5. Основание представляет собой напластование ПГГ с модулем деформации от 3 до 7 МПа
На рис.6 представлены график "осадка-нагрузка" отдельно для ребер и центра оболочки, а также график для плоского штампа аналогичных геометрических размеров.
Рис. 5. Схема экспериментальных штампов |
Рис. 6. Графики "осадка-нагрузка" для |
|
фундамента постоянной и переменной |
|
жесткости |
Как видно, при нагрузке до 90 кПа графики осадок плоского штампа и ребер ленточного фундамента практически совпадают. При давлениях до 120 кПа, ввиду развития пластических деформаций основания, осадка плоского штампа носит выраженный нелинейный характер. В тоже время график осадок ребристого остается прямолинейным, и лишь при большем давлении происходит увеличение приращения деформаций. При нагрузке 140 кПа осадка плоского штампа превышает осадку ребристого на 33 %, что свидетельствует о целесообразности неравномерного нагружения. В то же время осадка центра цилиндрической оболочки меньше осадки ребер на 22 %, значит можно судить о достаточной ее податливости при работе на грунтовом основании.
Относительно приведенных экспериментальных данных о работе фундаментов переменной жесткости, подробно рассмотренных в работах [2, 3, 4, 5], можно сделать следующие выводы:
1. Функция распределения контактных давлений существенно влияет на НДС основания. Заданным неравномерным нагружением основания можно добиться уменьшения абсолютных значений максимальных осадок до
560