

Сборник трудов конференции СПбГАСУ 2014 ч
.1.pdfРаздел 2. Проектирование и строительство оснований и фундаментов с применением…
12. Wehnert, M., Vermeer, P. A., Numerical analyses of load tests on bored piles. In: Numerical models in geomechanics, NUMOG IX: Proceedings of the 9th Symposium on Numerical Models in Geotechnics. Ottawa, Canada, 2004, p. 505–516.
P. Turček, E. Ladicsová (Slovakia, STU in Bratislava)
SOIL NAIL WALL DEFORMATIONS ANALYSIS BY FINITE
ELEMENT METHOD
Abstract
The paper deals with a numerical analysis of soil nail wall of deep excavation in Slovakia. The horizontal displacements of this wall were monitored using inclinometer during the excavation. In this article, results of numerical analysis are presented. The influence of two constitutive models of soil, permeability of rock layer and boundary distances of model for the horizontal wall displacements are analysed. The evaluation of calculated horizontal deformations of studied wall is based on the comparison with inclinometric measurements.
1. Introduction
Soil nailing is one of frequently used technologies for retaining structures. This technology has a lot of advantages in comparison with other technologies in suitable geological conditions (Turček, Hulla, 2004). The height of soil nail walls (slopes) can reach several tens of meters. Soil nailing technology can be limited by high groundwater level.
The deformations of soil nail walls are relatively small in comparison to other retaining systems for excavation pits. Stress strain relationship is significantly changed due to the ground excavation. It causes deformations of surrounding soils and neighbouring structures, which need to be considered in the design.
The content of this paper is the numerical analysis of soil nail wall of excavation pit in Ružomberok. Horizontal deformations of the wall were monitored during the construction. The results of measurements were used for verification of the design and slope stability during excavation. In addition, the results of measurements were used for back analysis focused on the course of soil nail wall deformations.
2. Input data of the geotechnical construction
The excavation pit in Ružomberok, built with technology of soil nailing, was located and constructed in the cut, where the slope height reached 13,85 meters.
281

Современные геотехнологии в строительстве и их научно-техническое сопровождение
Soil nailing are used in two levels and height of analysed vertical wall, originally designed as a pile wall, was 9,25 m (Fig. 1).
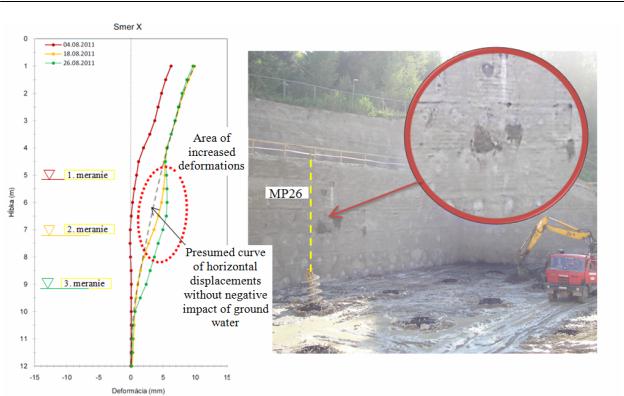
The vertical inclinometer was installed in the micropile MP 26. Measurement of the bottom wall of slope began after the ending of the first stage.
Fig. 1. View on the soil nail wall during the excavation with marked place of inclinometer
3. Design and assessment of soil nail walls
Geotechnical software GEO5 from Czech company FINE is the commonly used software for retaining structures design and assessment in Slovakia as well as in surrounding European countries. The module “Soil Nailing” is useful only for ultimate limit state (ULS) analysis, while other software and method have to be used for calculations of displacements of the wall.
Academic articles of soil nailing design are often focused on calculation of slope stability, design and resistance of nails and wall facing, rather than on their movements.
Soil nail wall behaviour is different in comparison with other types of retaining structures, such as bracing or strutting wall, diaphragm wall, pile or sheet pile wall. Mechanical behaviour and stiffness of soils reinforced by nails is similar to rigid structural elements.
282

Раздел 2. Проектирование и строительство оснований и фундаментов с применением…
4. Numerical model of soil nail wall in Ružomberok
Numerical methods, e. g. FEM, allow to consider difficult boundary conditions and local ground inhomogeneity. Geotechnical software Plaxis was used for numerical analysis.
4.1. Modelling of soil nails
The program Plaxis offers to simulate nails as:
geogrid structural element only with axial stiffness EA/m´
or plate (beam) elements with bending stiffness EI/m´ and axial stiffness
EA/m´.
The nails are usually modelled as a geogrid and concrete face wall as a plate in practice. However, it is recommended to take into account the real rigid connection of the concrete wall and nails by the using beam (plate) elements with bending stiffness (Sivakumar, Singh, 2009).
4.2.Geological conditions
The ground conditions consist of quaternary and tertiary layers (Fig. 2). The groundwater table was located approximately 2 m above the bottom of excavation. The quaternary sediments are represented primarily with silty or clayey gravel and they are also collectors of groundwater.
Fig. 2. Geological and hydrogeological conditions in analysed cross section of soil nail wall (green / orange – quaternary sediments (GM, G-F), violet – rock (R6))
Weak rock is located under the quaternary layers. The upper layer of the rock is weathered with mechanical properties similar to fine grained soils (gravelly clay or clayey gravel). This layer is less permeable; the calculations were carried out firstly for impermeable, later for less permeable rock layer. Properties of weak (weathered) rock used in calculation models are summarized in table 1.
283
Современные геотехнологии в строительстве и их научно-техническое сопровождение
Table 1 hear strength and deformation parameters of quaternary and tertiary ground layers
used in calculations (Rybáriková, 2008), (Turček, 2011)
|
φ´ |
c´ |
Edef |
Eoed |
|
(°) |
(kPa) |
(MPa) |
(MPa) |
GM (silty gravel) |
33 |
8 |
70 |
95 |
|
|
|
|
|
CG (R6 – rock) |
26 |
18 (40) |
80 |
108 |
|
|
|
|
|
4.3. Dimensions and boundary conditions of the model
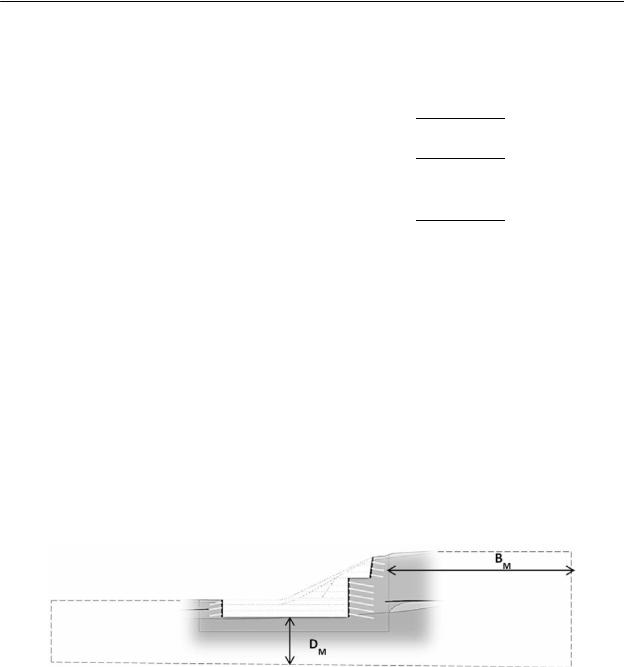
The dimensions of model have a significant impact on deformation analysis. Recommended minimal values of model boundary are defined with distances between last construction element (nail) and the boundary or the bottom of excavation, in horizontal (BM) and vertical direction (DM), identified in fig. 3.
The minimum values of dimensions BM and DM, due to recommendations and based on experiences, generally for retaining construction, are equal two to three times the maximum dimension of the excavation pit (width, depth) in both directions. Model dimensions of soil nail wall should be based on the height of soil nail wall. The recommended dimension below the bottom of excavation DM is two to three times of wall height, and size BM is three to four times of model dimension DM.
Fig. 3. Model dimensions; BM – distance between the last construction element (nail) and model boundary, DM – distance (depth) between the bottom of excavation and boundary
The change of horizontal displacements with different dimensions of the modelled area was studied. Distance in horizontal direction BM varied from 150 to 400 m and distance in vertical direction DM varied from 50 to 250 m.
4.4. Material models
For geotechnical construction analyses, it is important to simulate the character and behaviour of the ground. Results for two different material models, Mohr-Coulomb (MC) and Hardening Soil (HS) model were compared for this pur-
284

Раздел 2. Проектирование и строительство оснований и фундаментов с применением…
pose. The advanced HS model was used due to its advantages for more realistic simulation of soil stress-strain behaviour (e.g. Sivakumar, Singh, 2009).
5. Results of numerical modelling calculations and discussion
The first phase of analysis is focused on the influence of the model size, material model, and permeability modelling of ground layer on maximum horizontal deformation, in order to verify the numerical model. All numerical models were calculated for drained conditions.
The models include combinations of the above mentioned factors (sizes, constitutive model of soil, geotechnical properties of ground). Significant effect of model size was observed: with the increase of BM and DM values, calculated maximum deflection at the top of the wall decreased. With the increasing dimensions of the model, modest decrease was observed. From a practical point of view it is useful to use a model of appropriate size. Results of numerical analyses using Mohr – Coulomb constitutive model were compared to the results of the inclinometer measurements, which is described in more detail in the next chapter. Positive effect of the HS calculation model was shown only in the case of modelling the rock as less permeable.
5.1. Inclinometer measurements
The evaluated measurements of horizontal displacements in place of micropile No. 26 are presented in Fig. 4a left. The horizontal deformations after the excavation to level – 6,1 m from the top of wall are represented by red line, the yellow curve shows the increase of deformations by the following excavation step to the level approximately -7,6 m.
Final deformation represented by green line (after excavation to the base level -9.25 m), which is at the top of the wall and is almost the same as the yellow line. The increase in deformation was observed only in lower part of the wall. During excavation, bulging walls (yellow and green line) occurred, which was probably caused by groundwater inflow through boreholes for nails (fig. 4b).
The maximum value of horizontal displacement in the top of the wall after the last excavation phase reached 10,5 mm.
285
Современные геотехнологии в строительстве и их научно-техническое сопровождение
Fig. 4. a) Results of inclinometer measurements in direction x – horizontal displacements f soil nail wall in mm (Gróf, 2011);b) Places with local outflow of ground water,
detail near micropile No. 26
5.2. Comparison of calculated and measured deformations of soil nail wall
The deformations of wall only for those models where the maximum deflection of the wall at the appropriate length and width of the model differed from the measured deformations up to 20-25 % are presented in this paper.
All the selected maximum deflection values in numerical models are higher than measured values. It is due to the already mentioned limitations of modelling areas. The dimension BM = 400 m and the dimension DM = 150 m were selected for numerical modelling. The horizontal displacements distribution during the height of the walls and under the bottom of the pit to a depth of 12 m (the level of ± 0,000) is shown in the fig. 5. From the calculated deformations (curves a, b, c, d, e, f) it is shown, that the maximum displacement of the top wall is not connected with the maximum displacements of the wall (indicated by a solid line) and in the subsoil (broken lines).
Calculated deformations (also for small scale model DM) are larger than those measured by inclinometer. Curves representing the horizontal displacements of the five different models can be evaluated in two separate parts: deformation nailing wall (above the bottom of the pit) and subgrade deformation under the bottom of the pit.
If dotted thick line (curve g) showing the decisive real deformations without local buckling, then the development of the shape of the deflection lines is the
286

Раздел 2. Проектирование и строительство оснований и фундаментов с применением…
most accurate with the dark-blue curve d (with considering of impermeable bedrock for the using MC model. It other cases, there are shown deformations of convex shape ( curves a, b, c, e), while real deformations have concave shape.
Progress of horizontal displacements in ground, under the bottom, better reflect the excavation when the HS model was used to characterize the soil, however the displacements are different from the measured value. For these three cases (curves a, b, c) the differences of deformations in the bottom of the soil nail wall have minimum values. Deformations under the bottom could lead to decreasing with extension of the model. Their maximal value decrease with increasing of sizes
BM and DM.
The change of deformations during the last phases of excavation in analysed wall represents the curve f. Comparison of the f and a curves has shown a typically increase of deformations with the depth of excavation. The maximal value of calculated deformation in this phase is approximately equal to the measured displacements of the top of wall before at the end of excavation.
6. Conclusion
This paper presents the results of the deformation analysis of soil nail wall. At the beginning of geotechnical design, determination of the dimensions of the model area is very important step.
In terms of horizontal deformation (parallel to the influence of the size of the model), the effects of the material models and the influence of the nature of the subsoil in terms of its permeability were also studied.
The models include combinations of the above mentioned factors (dimensions of the computational model, the ground conditions). The significant effect of the model size to a maximum horizontal deformation of the wall is presented in the paper.
Dimensions of the numerical model BM = 400 m and DM = 150 m were selected according to the inclinometer measurements. The aim of study was to investigate the effect of a combination of material models and considered the nature of the subsoil on the course of horizontal deformation. The HS model is suitable for simulation of the behaviour of impermeable ground layer. In terms of maximum horizontal deformations of the wall, MC model can be used.
Reduction of horizontal deformation of nailing walls can be achieved by extending of the modelled area. Another way for reducing of displacements of walls is calculation of nailing walls with nails modelled as beams. In further analysis, it is also recommended to evaluate the effects of groundwater for deformation on the bottom of nailing wall.
287

Современные геотехнологии в строительстве и их научно-техническое сопровождение
Fig. 5 Comparison of calculated and measured horizontal displacements
Acknowledgement
The paper is one of the outcomes of the Grant VEGA agency No. 1/0241/13.
References
1.GRÓF, V. Report from the inclinometric measurements of subsurface deformations to construction of the „University Library of Catholic University in Ružomberok. Žilina, GEOEXPERTS spol. s.r.o., 2011 (in Slovak)
2.TURČEK, P. – HULLA, J. Foundation – Second edition. Bratislava, Jaga, 2004, 359 p. ISBN 80-88905-99-0
3.RYBÁRIKOVÁ, R. Final report of geological project „R61/2008 Ružomberok – CU, library“. Žilina, 2008. 7 p. (in Slovak)
4.SIVAKUMAR BABU, G.L., SINGH V. P. Simulation of Soil Nail Structures using PLAXIS 2D. Plaxis Bulletin, 2009.[downl.29.9.2013] available on the internet: www.plaxis.nl
5.TURČEK, P., SÚĽOVSKÁ, M. MINÁRIK, M. Design of the excavation pit for the library of Catholic University in Ružomberok. Bratislava, 2011. 18 p. (in Slovak)
288

Раздел 3. Аналитические и численные методы исследований оснований и фундаментов
Раздел 3. АНАЛИТИЧЕСКИЕ И ЧИСЛЕННЫЕ МЕТОДЫ ИССЛЕДОВАНИЙ ОСНОВАНИЙ И ФУНДАМЕНТОВ
УДК 624.139
И.И. Сахаров (СПбГАСУ), М.В. Парамонов (СПбГУПС)
ЧИСЛЕННОЕ РЕШЕНИЕ ПРОСТРАНСТВЕННЫХ ЗАДАЧ ФУНДАМЕНТОСТРОЕНИЯ, УЧИТЫВАЮЩИХ ПРОМЕРЗАНИЕ ГРУНТОВ ОСНОВАНИЯ
Задачи совместных расчетов системы «основание – сооружение» при промерзании грунтов являются, как правило, трехмерными и предполагают только численную реализацию, особенно при неодномерных температурных полях. Достаточно эффективным средством решения таких задач является программа «Termoground» [1]. Для оценки напряженно-деформированного состояния промерзающего грунта (после решения температурной задачи) в формульный аппарат программы включен коэффициент анизотропии мо-
розного пучения, обозначаемый символом , представляющий собой отношение горизонтальных деформаций пучения к вертикальным. Вместе с тем,
ввиду отсутствия определенности в значениях , при численной реализации решаемых программой «Termoground» задач, коэффициент анизотропии до настоящего времени принимался равным нулю. В связи с этим, возникает вопрос, насколько на точность расчетов НДС системы «основание – сооруже-
ние» влияет пренебрежение значениями .
Заметим, что коэффициент анизотропии морозного пучения является некоторым аналогом коэффициента Пуассона . Последний, как известно, представляет собой одну из двух характеристик упругого тела (наряду с модулем упругости). Несмотря на то, что исследования многих авторов показывают, что коэффициент Пуассона зависим от целого ряда факторов, в расчетах его для характерных грунтов часто принимают постоянным. Очевидное объяснение этому – относительно малая вариация для дисперсных грунтов – от 0,3 до 0,42, то есть изменения не превышают 30 %. Величина коэффициента анизотропии морозного пучения, по некоторым экспериментальным данным, может варьироваться от –1 до +1 (и даже более), то есть пределы изменения могут превышать 200 %. В связи с этим, исследование закономерностей изменения и их влияния на НДС при морозном пучении грунтов основания представляется весьма важной задачей.
Очевидно, должен зависеть от НДС, а также условий промерзания (по закрытой или открытой системе) и режима крионагружения, а также количества фронтов. Вместе с тем, для промерзающих и пучащихся грунтов ко-
289

Современные геотехнологии в строительстве и их научно-техническое сопровождение
эффициент анизотропии в первом приближении должен, прежде всего, зависеть от основных факторов, определяющих пучение – то есть от наименования грунта (супесь, суглинок, глина), его влажности и значений отрицательных температур. В связи с этим, целью предварительных исследований было влияние на величину перечисленных факторов.
Для установления изменений в лаборатории холода СПбГАСУ были проведены опыты. Эксперименты проводились на цилиндрических образцах диаметром 36 и высотой 72 мм, то есть при соотношении 1 : 2, что является общепринятым для исследований морозного пучения. Опыты проводились на пастах, с целью исключения влияния структурных особенностей, присущих образцам природного сложения. Всего было проведено 50 опытов при всестороннем промерзании образцов. Все испытания проводились по закрытой системе. Некоторые результаты лабораторных опытов представлены на графиках рис. 1–3. Более подробные подробные результаты лабораторных исследований приведены в работе [2].
Рис. 1. Зависимость коэффициента анизотропии пучения от температуры (супесь)
Рис. 2. Зависимость коэффициента анизотропии пучения от влажности (глина)
290