

Параллельные Процессы и Параллельное Программирование / SNNSv4.2.Manual
.pdf4.3. WINDOWS OF XGUI |
59 |
Figure 4.18: A typical Hinton diagram
These settings may be changed by the user by pressing the ZOOM IN and ZOOM OUT
buttons in the upper part of the window. ZOOM IN enlarges the weight square by one
pixel on each side, while ZOOM OUT shrinks it.
The setup panel lets the user change the look of the display further. Here the width of the underlying grid can be changed. If the grid size is bigger than the number of connections in the network, no grid will be displayed. Also the color scale (resp. size scale for B/W) can be changed here. The initial settings correspond to the SNNS variables max weight and min weight.
In a Hinton diagram, the size of a square corresponds to the absolute size of the correlated link. A lled square represents positive, an square frame negative links. The maximum size of the squares is computed automatically, to allow an optimal use of the display. In a WV diagram color is used to code the value of a link. Here, a bright red is used for large negative values and a bright green is used for positive values. Intermediate numbers have a lighter color and the value zero is represented by white. A reference color scale is displayed in the top part of the window. The user also has the possibility to display the numerical value of the link by clicking any mouse button while the mouse pointer is on the square. A popup window then gives source and target unit of the current link as well as its weight.
For a better overall orientation the numbers of the units are printed all around the display and a grid with user de nable size is used. In this numbering the units on top of the screen represent source units, while numbers to the left and right represent target units.
60 |
CHAPTER 4. USING THE GRAPHICAL USER INTERFACE |
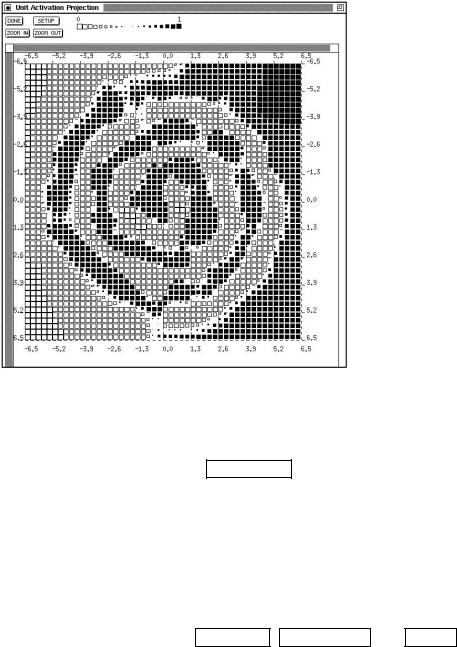
4.3.8Projection Panel
Figure 4.19: PROJECTION panel for the 2-spirals problem. Note that the input range of the X and Y units must be speci ed, not the output range. In contrast, the output range of the third unit speci ed determines the color. Here the following values have been used: X-axis: unit 1 value range -6.5 to 6.5 Y- axis: unit 2 value range -6.5 to 6.5 activation pattern: unit 38 (the only output unit of the network) value range 0 to 1
The projection analysis tool allows to display how the output of one unit (e.g. a hidden or an output unit) depends on two input units. It thus realizes a projection to two input vector axes.
It can be called by clicking the PROJECTION button in the manager panel or by typing Alt-p in any SNNS window. The display of the projection panel is similar to the weights display, from which it is derived.
in the setup panel, two units must be speci ed, whose inputs are varied over the given input value range to give the X resp. Y coordinate of the projection display. The third unit to be speci ed is the one whose output value determines the color of the points with the given X and Y coordinate values. The range for the color coding can be speci ed as output range. For the most common logistic activation function this range is [0 1].
The use of the other buttons, ZOOM IN , ZOOM OUT and DONE are analogous to the weight display and should be obvious.
The projection tool is very instructive with the 2-spirals problem, the XOR problem or similar problems with two-dimensional input. Each hidden unit or output unit can be inspected and it can be determined, to which part of the input space the neuron is sensitive. Comparing di erent networks trained for such a problem by visualizing to which part of the input space they are sensitive gives insights about the internal representation of the networks and sometimes also about characteristics of the training algorithms used for training. A display of the projection panel is given in gure 4.19.
4.3. WINDOWS OF XGUI |
61 |
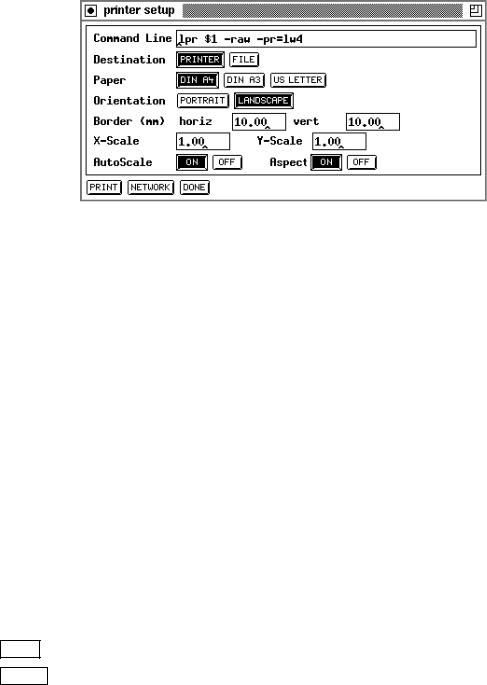
4.3.9Print Panel
The print panel handles the Postscript output. A 2D-display can be associated with the printer. All setup options and values of this display will be printed. Color and encapsulated Postscript are also supported. The output device is either a printer or a le. If the output device is a printer, a '.ps'- le is generated and spooled in the /tmp directory. It has a unique name starting with the pre x `snns'. The directory must be writable. When xgui terminates normally, all SNNS spool les are deleted.
Figure 4.20: Printer panel
The following elds can be set in the Printer Panel, which is shown in gure 4.20.
1.File Name resp. Command Line:
If the output device is a le: the lename.
If the output device is a printer: the command line to start the printer. The lename in the command line has to be '$1'.
2.Destination: Selects the output device. Toggles the above input line between File Name and Command Line.
3.Paper: Selects the paper format.
4.Orientation: Sets the orientation of the display on the paper. Can be 'portrait' or 'landscape'.
5.Border (mm): Sets the size of the horizontal and vertical borders on the sheet in millimeters.
6.AutoScale: Scales the network to the largest size possible on the paper.
7.Aspect: If on, scaling in X and Y direction is done uniformly.
8.X-Scale: Scale factor in X direction. Valid only if AutoScale is 'OFF'.
9.Y-Scale: Scale factor in Y direction. Valid only if AutoScale is 'OFF'.
DONE : Cancels the printing and closes the panel.
PRINT : Starts printing.
62 |
CHAPTER 4. USING THE GRAPHICAL USER INTERFACE |
NETWORK : Opens the network setup panel. This panel allows the speci cation of several options to control the way the network is printed.
The variables that can be set here include:
1.x-min, y-min, x-max and y-max describe the section to be printed.
2.Unit size: FIXED : All units have the same size.
VALUE : The size of a unit depends on its value.
3.Shape: Sets the shape of the units.
4.Text: SOLID : The box around text overwrites the background color and the links. TRANSPARENT : No box around the text.
5.Border: A border is drawn around the network, if set to 'ON'.
6.Color: If set, the value is printed color coded.
7.Fill Intens: The ll intensity for units on monochrome printers.
8.Display: Selects the display to be printed.
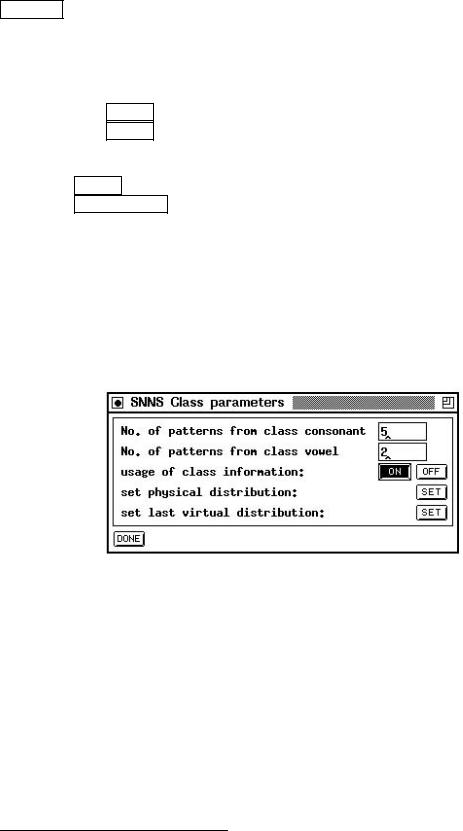
4.3.10Class Panel
Figure 4.21: The panel for class information
The class panel gives you control over the composition of the patterns used for training. Although it might be opened at any time, its values are used only when dealing with a pattern set that contains class information.
The upper part of the panel displays the names of the classes in the pattern set as well as the number of patterns from each class to be included in one training epoch (virtual pattern set4). When loading a new pattern set these numbers are either the actual numbers of patterns in the pattern le, or read from the pattern distribution directive in the patternle header if present. The lines are printed in ascending alpha-numerical class name order, and do not re ect the position of the patterns in the pattern le.
Note, that these numbers specify a relative distribution! This means, that for a patternle that contains two classes consonant and vowel with 21 consonant-patterns and 5
4See chapter 5.4 for a detailed description of virtual versus physical pattern sets
4.3. WINDOWS OF XGUI |
63 |
vowel-patterns, a given distribution of consonant = 5 and vowel = 2 means that for each ve consonant-pattern two vowel-patterns are included in the virtual pattern set for a total of 35 patterns5. Each pattern is included at least once. If there are not enough physical patterns from a class in the set for the speci ed distribution, some or all patterns are included multiple times until the number of patterns per class match. If training is performed with chunkwise update, it might be a good idea to match the chunk size with the sum of the class distribution values. Try various distributions to nd an optimum for training and/or recall performance of your network.
In the next line of the panel \usage of class distribution", the usage of virtual patterns can be toggled. If set to \OFF" only the physical patterns of the pattern le are used. All information entered in the lines above is ignored. If set to \ON" training takes place on the virtual pattern set as de ned by the preceding distribution values.
The set button for the physical distribution enters the numbers into the class rows that correspond to the numbers of patterns present in the pattern le.
The set button for the last virtual distribution re-enters the numbers given by the user or speci ed as distribution in the pattern le. Only the last con guration used before the current (virtual or physical) can be retrieved.
The last two buttons allow for a convenient test of the training performance of the physical distribution versus a user speci ed arti cial distribution without the need for the construction of various pattern les.
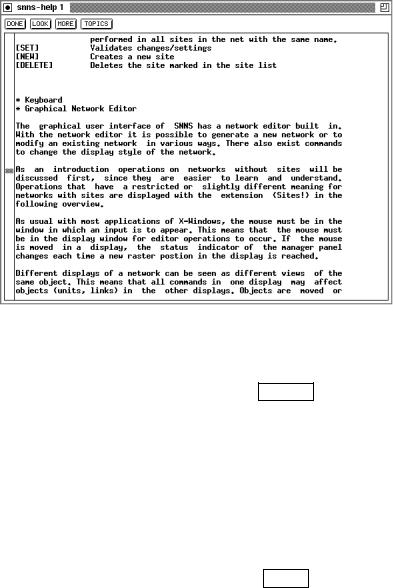
4.3.11Help Windows
An arbitrary number of help windows may be opened, each displaying a di erent part of the text. For a display of context sensitive help about the editor commands, the mouse must be in a display and the key h must be pressed. Then the last open help window appears with a short description.
A special feature is the possibility of searching a given string in the help text. For this, the search string is selected in the text window (e.g. by a double click).
1.LOOK : After clicking this button, SNNS looks for the rst appearance of the marked string, starting at the beginning of the help document. If the string is found, the corresponding paragraph is displayed.
2.MORE : After clicking this button, SNNS looks for the rst appearance of the marked string, starting at the position last visited by a call to the help function. If the text was scrolled afterwards, this position might not be on the display anymore.
Note: All help calls look for the rst appearance of a certain string. These strings start with the sequence ASTERISK-BLANK (* ), to assure the discovery of the appropriate text position. With this knowledge it is easy to modify the le help.hdoc to adapt it to special demands, like storing information about unit types or patterns. The best approach
5see the pattern le letters with classes.pat in the examples directory
64 |
CHAPTER 4. USING THE GRAPHICAL USER INTERFACE |
Figure 4.22: Help Window
would be to list all relevant keywords at the end of the le under the headline \* TOPICS", so that the user can select this directory by a click to TOPICS .
4.3.12Shell window
The window of the shell from which SNNS is invoked is used for the output of protocol messages.
These protocols include:
Messages about the success or failure of the loading or saving of a le.
Information about the settings of SNNS when the INFO button in the control panel is pressed.
Error messages of the pattern le parser when the pattern le does not correspond to the required grammar.
Learning error values (see below)
Validation set error values
When learning is started, the error of the output units is reported on this window after each epoch, i.e. after the presentation of all patterns.
To save the window from being ooded on longer training runs, the maximum number of reported errors is limited to 10. Therefore, when 20 learning cycles are speci ed, the error gets printed only after every other cycle. This error report has the following form:
Learning all patterns:
4.3. WINDOWS OF XGUI |
|
65 |
||
epochs |
: 100 |
|
|
|
parameter: 0.80000 |
|
|
||
#o-units : 26 |
|
|
||
#patterns: 26 |
|
|
||
epoch: |
SSE |
MSE |
SSE/o-units |
|
Train |
100: |
57.78724 |
2.22259 |
2.22259 |
Train |
90: |
24.67467 |
0.94903 |
0.94903 |
Train |
80: |
23.73399 |
0.91285 |
0.91285 |
Train |
70: |
22.40005 |
0.86154 |
0.86154 |
Train |
60: |
20.42843 |
0.78571 |
0.78571 |
Train |
50: |
18.30172 |
0.70391 |
0.70391 |
Test |
50: |
25.34673 |
0.97487 |
0.97487 |
Train |
40: |
16.57888 |
0.63765 |
0.63765 |
Train |
30: |
14.84296 |
0.57088 |
0.57088 |
Train |
20: |
12.97301 |
0.49896 |
0.49896 |
Train |
10: |
11.22209 |
0.43162 |
0.43162 |
Train |
1: |
10.03500 |
0.38596 |
0.38596 |
Test |
1: |
11.13500 |
0.42696 |
0.42696 |
The rst line reports whether all or only a single pattern is trained. The next lines give the number of speci ed cycles and the given learning parameters, followed by a brief setup description.
Then the 10-row-table of the learning progress is given. If validation is turned on this table is intermixed with the output of the validation. The rst column speci es whether the displayed error is computed on the training or validation pattern set, \Test" is printed for the latter case. The second column gives the number of epochs still to be processed. The third column is the Sum Squared Error (SSE) of the learning function. It is computed with the following formula:
SSE = |
X |
2X |
(tpj ; opj)2 |
2 |
|
||
p |
patterns j output |
|
|
where tpj is the teaching output (desired output) of output neuron j on pattern p and opj is the actual output. The forth column is the Mean Squared Error (MSE), which is the SSE divided by the number of patterns. The fth value nally gives the SSE divided by the number of output units.
The second and third values are equal if there are as many patterns as there are output units (e.g. the letters network), the rst and third values are identical, if the network has only one output unit (e.g. the xor network).
If the training of the network is interrupted by pressing the STOP button in the control panel, the values for the last completed training cycle are reported.
The shell window also displays output when the INFO button in the control button is pressed such an output may look like the following:
66 |
|
CHAPTER 4. USING THE GRAPHICAL USER INTERFACE |
|
SNNS 3D-Kernel V4.20 |
: |
||
#input units: |
35 |
||
#output units: |
26 |
||
#patterns |
: |
63 |
|
#subpatterns : |
63 |
||
#sites |
: |
0 |
|
#links |
: |
610 |
|
#STable entr.: |
0 |
||
#FTable-Entr.: |
0 |
||
sizes in bytes: |
|
|
|
units |
: |
208000 |
|
sites |
: |
|
0 |
links |
: |
160000 |
|
NTable |
: |
8000 |
|
STable |
: |
|
0 |
FTable |
: |
|
0 |
learning function : Std_Backpropagation |
|||
update function |
: Topological_Order |
||
init function |
: Randomize_Weights |
||
remap function |
: None |
||
network file |
|
: letters.net |
|
learn pattern file : letters.pat test pattern file : letters.pat
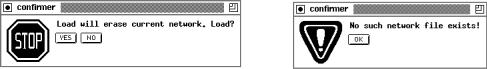
4.3.13Con rmer
Figure 4.23: A normal con rmer and a message con rmer.
The con rmer is a window where the graphical user interface displays important information or requires the user to con rm destructive operations. The con rmer always appears in the middle of the screen and blocks XGUI until a button of the con rmer is clicked (seegure 4.23).

4.4. PARAMETERS OF THE LEARNING FUNCTIONS |
67 |
4.4Parameters of the Learning Functions
The following learning parameters (from left to right) are used by the learning functions that are already built into SNNS:
ART1
1.: vigilance parameter. If the quotient of active F1 units divided by the number of active F0 units is below , an ART reset is performed.
ART2
1.: vigilance parameter. Speci es the minimal length of the error vector r (units ri).
2.a: Strength of the in uence of the lower level in F1 by the middle level.
3.b: Strength of the in uence of the middle level in F1 by the upper level.
4.c: Part of the length of vector p (units pi) used to compute the error.
5.: Threshold for output function f of units xi and qi.
ARTMAP
1. a: vigilance parameter for ART a subnet. (quotient jFa1 j )
jFa0 j
2. b: vigilance parameter for ART b subnet. (quotient jFb1j )
jFb0j
3. : vigilance parameter for inter ART reset control. (quotient jFabj )
jFb2j
Backpercolation 1:
1.: global error magni cation. This is the factor in the formula = (t ; o), where is the internal activation error of a unit, t is the teaching input and o the output of a unit.
Typical values of are 1. Bigger values (up to 10) may also be used here.
2.: If the error value drops below this threshold value, the adaption according to the Backpercolation algorithm begins. is de ned as:
1 |
p N |
|
|
= pN XX j o ; j |
|
3.dmax: the maximum di erence dj = tj ; oj between a teaching value tj and an output oj of an output unit which is tolerated, i.e. which is propagated back as dj = 0. See above.

68 |
CHAPTER 4. USING THE GRAPHICAL USER INTERFACE |
Std Backpropagation ("Vanilla\ Backpropagation),
BackpropBatch and TimeDelayBackprop
1.: learning parameter, speci es the step width of the gradient descent.
Typical values of are 0:1 : : : 1:0. Some small examples actually train even faster with values above 1, like 2.0.
Note, that for BackpropBatch this value will now be divided by the number of patterns in the current pattern set.
2.dmax: the maximum di erence dj = tj ; oj between a teaching value tj and an output oj of an output unit which is tolerated, i.e. which is propagated back as dj = 0. If values above 0.9 should be regarded as 1 and values below 0.1 as 0, then dmax should be set to 0:1. This prevents overtraining of the network.
Typical values of dmax are 0, 0.1 or 0.2.
BackpropChunk
1.: learning parameter, speci es the step width of the gradient descent as with Std Backpropagation.
Note, that this value will be divided by the actual number of link weight and bias changes during one chunk before any changes to the weights will take place. This ensures that learning rate values will be comparable with those in Std Backpropagation.
2.dmax: the maximum training output di erences as with Std Backpropagation. Ususally set to 0.0.
3.N: chunk size. The number of patterns to be presented during training before an update of the weights with the accumulated error will take place.
Based on N, this learning function implements a mixture between Std Backprop (N = 1) and BackpropBatch (N = <pattern set size>).
4.lowerlimit: Lower limit for the range of random noise to be added for each chunk.
5.upperlimit: Upper limit for the range of random noise to be added for each chunk. If both upper and lower limit are 0.0, no weights jogging takes place.
To apply some random noise, automatic weights jogging takes place before each chunk (group of N patterns), if the given parameters are di erent from 0.0. Random weights jogging should be used very carefully (absolute values smaller than 0:05 should be used). Since the jogging takes place very often, the weights may diverge very quickly to in nity or shrink to 0 within a few epochs.