

corruption_in_ukraine_2007-2009_2011_engl
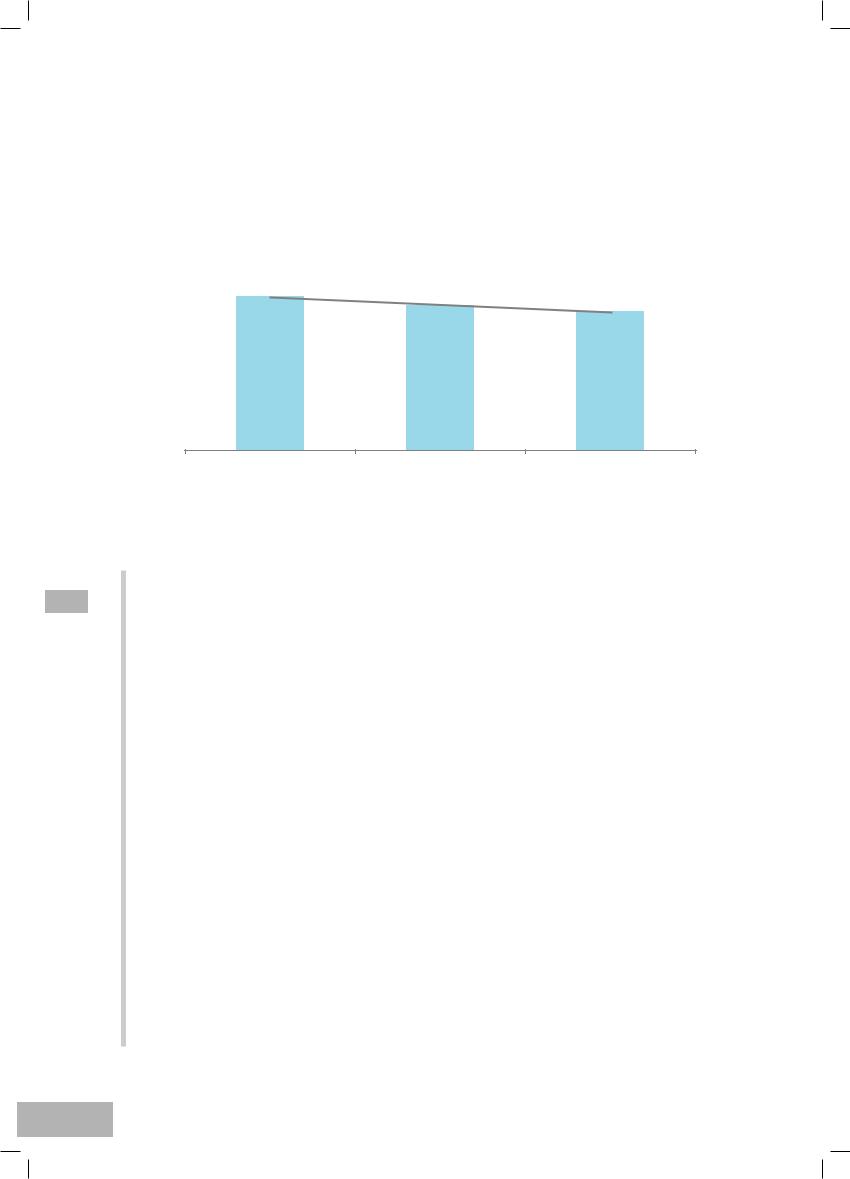
.pdfChart 4.4
Believe that Corruption is Never Justified
|
|
42,5% |
48,0% |
|
38,6% |
44,6% |
|
34,8% |
39,3% |
43,9% |
|
34,2% |
37,9% |
|
|
30,3% |
|
||
34,0% |
|
|
|
29,7% |
|
|
2007 |
|
|
|
|
|
|
|
2009 |
|
|
|
2011 |
18-29 |
30-44 |
45-59 |
60+ |
Age groups |
Findings of the qualitative survey show that citizens are well aware of the negative consequences of corruption. Corrupt behavior is perceived as widely spread legalized racket affecting primarily the quality of life of average citizens.
“Another negative factor is that even if you pay for a university diploma, you’ve got to work with it and you don’t have the necessary qualifications. Let’s assume a person bought a diploma of a medical doctor and somebody turns to them for medical treatment. This is absolutely horrific.”
“A similar situation is when a person applies for a job as a chef in a restaurant or café, which requires a medical examination certificate. And they are told, “No worries. Come to work and we will take care of it”. Then, some clients fall ill from food poisoning.”
“This may be good for me personally, if I have more money than everybody else sitting at this table and I can resolve my problems quicker. For me personally this is good, but generally speaking it is not good and it’s unfair.”
“Or they sell a gun to a sick person for money. The man goes and shoots himself one day. He was a drug addict.Hewenttoseeatherapistandgavehimmoney.Thenhewenttoseeapsychiatristandalsogavehim money. And both of specialists issued him a certificate.
“It also may be due to the lobbying of somebody’s interests. In order to get rich through criminal channels, one may be forced to lobby somebody else’s interests”.
“I recall the beginning of perestroika, when the word “racket» could be heard everywhere. I’ve got a feeling that we are sliding back into that era. But this time it is more legal and on a government level.”
On the other hand, the participants of the discussions claimed that corruption may have some positive effects,providedthatbribesareextortedin“reasonable”amounts.Inthiscase,corruptioncouldbejustified:
“When applying to obtain any official document, applicants are told they will be ready by a certain date. If they need it sooner, a bribe or a gratuity is demanded and the document will be ready in a matter of a few hours”
“This fuels competition and allows people to climb the career ladder not based on their professional qualifications, rather on the amount of a bribe they pay some civil servant.”
“100hryvniaisnotenough.1,000oraminimumof500willbesufficient.So,wheredoessomebodyfindsuch big money?”
Changes in the level of corruption since 2004
As noted earlier, there is a reverse correlation between the level of trust in the government and the population’s perception of corruption. Findings of the 2011 survey show differences in perception of corruption according to political preferences of the respondents. Results of the survey demonstrate that over a half of the surveyed supporters of the current administration (the Party of Regions, which is the party of the current president and government,andthepoliticalforceoftheSpeakeroftheUkrainianParliamentVolodymyrLytvyn,believethelevel of corruption either has not changed or has fallen compared to 2004.
4. PERCEPTIONS OF CORRUPTION
21
All MS World ENG.indd 21 |
09.08.2011 23:29:34 |

4. PERCEPTIONS OF CORRUPTION
22
Chart 4.5
Perceived Change in Level of Corruption in Ukraine since 2004 Depending on the Respondents’ Political
Preferences
|
|
|
|
|
|
|
|
|
|
|
|
|
|
|
|
|
|
|
|
|
|
|
|
|
Party of regions (V.Yanukovych) |
|
14% |
|
|
|
|
40% |
|
|
|
|
17% |
|
29% |
|
|
|
|||||||
|
|
|
|
|
|
|
|
|
|
|
|
|
|
|
|
|
|
|
|
|
|
|
|
|
Political force of Volodymyr Lytvyn |
|
11% |
|
|
|
|
49% |
|
|
|
|
11% |
|
29% |
|
|
|
|||||||
|
|
|
|
|
|
|
|
|
|
|
|
|
|
|
|
|
|
|
|
|
|
|
|
|
Party 'Strong Ukraine' (S.Tigipko) |
|
7% |
|
|
|
36% |
|
|
|
|
|
15% |
|
|
|
42% |
|
|
|
|||||
|
|
|
|
|
|
|
|
|
|
|
|
|
|
|
|
|
|
|
|
|
|
|
|
|
Communist party of Ukraine (P.Symonenko) |
|
6% |
|
|
|
35% |
|
|
|
|
|
10% |
|
|
49% |
|
|
Decreased |
||||||
|
|
|
|
|
|
|
|
|
|
|
|
|
|
|||||||||||
|
|
|
|
|
|
|
|
|
|
|
|
|
|
|
|
|
|
|
|
|
|
|
|
|
|
|
|
|
|
|
|
|
|
|
|
|
|
|
|
|
|
|
|
|
|
|
|
|
Not changed |
Political force of Vitaliy Klychko |
|
4% |
|
|
27% |
|
|
|
9% |
|
|
|
|
60% |
|
|
|
|||||||
|
|
|
|
|
|
|
|
|
|
|
|
|
||||||||||||
|
|
|
|
|
|
|
|
|
|
|
|
|
Hard to say |
|||||||||||
|
|
|
|
|
|
|
|
|
|
|
|
|
|
|
|
|
|
|
|
|
|
|
|
|
|
|
|
|
|
|
|
|
|
|
|
|
|
|
|
|
|
|
|
|
|
|
|
|
|
|
|
|
|
|
|
|
|
|
|
|
|
|
|
|
|
|
|
|
|
|
|
|
|
|
Political force of Arseniy Yatsenyuk 'Front for change' |
|
4% |
|
|
30% |
|
|
|
|
9% |
|
|
|
58% |
|
|
|
Increased |
||||||
|
|
|
|
|
|
|
|
|
|
|
|
|
||||||||||||
|
|
|
|
|
|
|
|
|
|
|
|
|
||||||||||||
|
|
|
|
|
|
|
|
|
|
|
|
|
|
|
|
|
|
|
|
|
|
|
|
|
Political force of Yulia Tymoshenko |
|
4% |
|
|
24% |
|
|
11% |
|
|
|
|
62% |
|
|
|
|
|||||||
|
|
|
|
|
|
|
|
|
|
|
|
|
|
|
|
|
|
|
|
|
|
|
|
|
Political force of Anatoliy Hrytsenko 'Civic position' |
1% |
|
|
24% |
|
4% |
|
|
|
|
|
|
|
|
70% |
|
|
|
|
|
||||
|
|
|
|
|
|
|
|
|
|
|
|
|
|
|
|
|
|
|
|
|
|
|
|
|
All-Ukrainian union 'Liberty' (O.Tyagnybok) |
1% |
|
|
27% |
|
|
7% |
|
|
|
|
|
65% |
|
|
|
|
|||||||
Question: In your opinion, has the level of corruption changed in Ukraine compared to 2004 and how?
The situation is slightly more complicated when it comes to followers of Serhiy Tihipko’s Strong Ukraine and the Communist Party of Ukraine led by Petro Symonenko. Here, less than half of the respondents believe that corruption is worse today than it was before the Orange Revolution. As for the supporters of the “orange” forces, more than 60% are convinced that the level of corruption has increased compared to 2004.
For a more precise assessment of the effectiveness of the MCC Threshold anti-corruption programs, we asked respondents in this survey about their perceptions of changes in corruption over the last two years after the previous survey in 2009.
Overall, the assessment of such changes is not as flat as two years ago: almost 40% of respondents are convinced that the situation has not changed, although 41.7% said the level of corruption has increased. Another 5% of the respondents said the level of corruption is lower than in 2009. Noteworthy is that 55.8% of respondents of the 2009 survey said the level of corruption has increased over the past two years.
Chart 4.6
Perceived Change in Level of Corruption in Ukraine Two Years Prior to the Survey
|
|
|
55,8% |
2009 |
|
|
|
|
|
|
|
39,0% |
41,7% |
2011 |
|
|
|
||
|
|
|
|
|
|
|
29,0% |
|
|
2,2% |
5,0% |
|
|
|
|
|
|
|
|
Decreased |
Remained the Same |
Increased |
|
|
Question: How has the level of corruption in Ukraine changed to-date compared to early 2009 (2007)?
All MS World ENG.indd 22 |
09.08.2011 23:29:34 |

Spread of corruption and the effectiveness of preventative measures
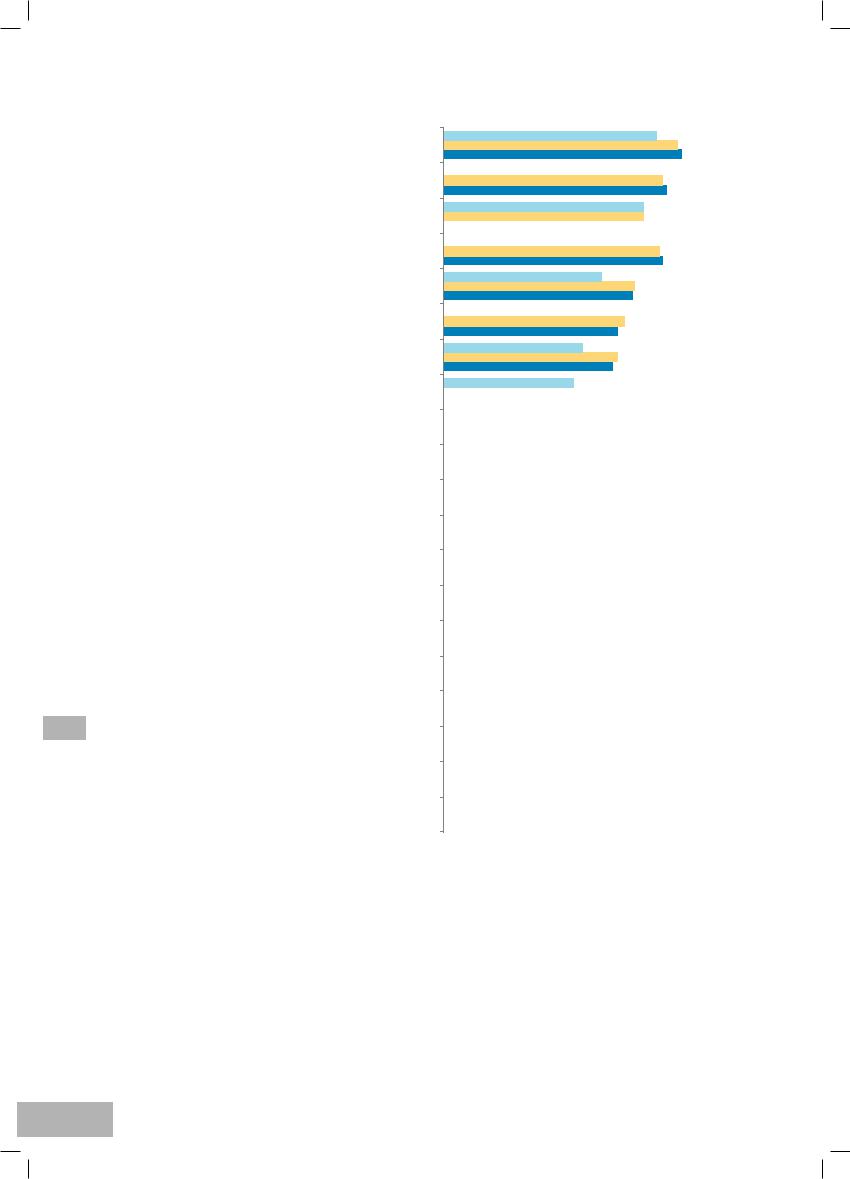
Theresultsofthesurveyshowthatpublicperceptionsofcorruptionatalllevelsofgovernmenthavedecreasedover thispastyearandarealmostthesameasin2007.54.5%ofrespondentsbelievethatthehighestlevelcorruptionis in the Verkhovna Rada of Ukraine. Slightly less than half of the respondents perceive the President, his Secretariat and the Cabinet of Ministers of Ukraine as highly corrupt entities.
Theincumbentpresidentapparentlymanagedtoconvincehisvotersofhiscommitmenttoeradicatingcorruption, which gives him a better image than the current government as to the level of perceived corruption. As earlier, respondents believe that the lowest level of corruption is among local authorities (32.7%).
.
Chart 4.7
Spread of Corruption by Level of Government
Verkhovna Rada |
|
|
|
|
|
|
|
|
54,2% |
|
|
65,0% |
||
|
|
|
|
|
|
|
|
|||||||
of Ukraine |
|
|
|
|
|
|
|
|
|
|
|
|||
|
|
|
|
|
|
|
|
54,6% |
|
|
|
|||
|
|
|
|
|
|
|
|
|
|
|
|
|||
Cabinet of Ministers |
|
44,9% |
|
57,1% |
|
|||||||||
|
|
|
||||||||||||
of Ukraine |
|
|
|
|
|
|
|
|
|
|
||||
|
|
|
|
|
|
|
46,8% |
|
|
|
|
|
|
|
|
|
|
|
|
|
|
|
|
|
|
|
|
||
President and His |
|
36,8% |
|
|
|
|
58,8% |
|||||||
|
|
|
|
|||||||||||
Administration |
|
|
|
|
|
|
|
|
|
|
||||
|
|
|
|
|
40,7% |
|
|
|
|
|
|
|||
|
|
|
|
|
|
|
|
|
|
|
|
|||
Oblast |
|
|
37,5% |
46,5% |
|
|
|
|
|
|
||||
|
|
|
|
|
|
|
|
|||||||
Government |
|
|
|
|
|
|
|
|
|
2007 |
||||
|
|
|
|
39,0% |
|
|
|
|||||||
|
|
|
|
|
|
|||||||||
City / Village |
|
32,4% |
|
|
|
|
|
2009 |
||||||
|
|
|
|
|
||||||||||
|
|
|
|
|
|
|
|
|
|
|||||
Government |
|
|
|
|
38,7% |
|
|
|
|
|
2011 |
|||
|
32,7% |
|
|
|
|
|
||||||||
|
|
|
|
|
|
|
|
|
|
|
||||
|
|
|
|
|
|
|
|
|
|
|
|
|
|
|
Question: in your opinion, to what extent is corruption rampant among government authorities at various levels?
Justasinthepreviousyears,respondentswereaskedtoevaluatethespreadofcorruptionin20sectors.Asearlier, there are increased perceptions of corruption in the State Auto Inspection agency (64.4%) and the judicial system (60.3%). It is important to note that this year the state healthcare system has caught up with the judicial system (60.3%) and the [p;oce (59.1%), which earlier ranked third in this anti-rating list.
Amidst all proposed sectors, only three demonstrated a slight decrease in the level of corruption compared to 2009: university management and faculty (from 49% to 47.1%), obtaining government subsidized housing (from 40.2% to 38.3%) and registration or privatization of real estate (from 35.4% to 33.5%) – all changes are statistically significant at the level of p=0.01.
In the majority of sectors, perceptions of corruption have increased.
The most tangible increase in the public perceptions of corruption was revealed in such sectors as healthcare services (from 54.2% to 60.3%), passing through customs control and obtaining customs documents (from 38.6% to 42.1%), being hired for a government job (from 31% to 36.2%), regulation of business activity (from 29.3% to 34%) and applying for and obtaining unemployment and other social assistance (from 16.3% to 20.4%).
In the opinion of respondents, corruption also increased in the sphere of public utility services, specifically state subsidized installation and repair of equipment in schools and among tax inspectors.
Perceived corruption in the other eight sectors remained at the level of two years ago.
4. PERCEPTIONS OF CORRUPTION
23
All MS World ENG.indd 23 |
09.08.2011 23:29:34 |
4. PERCEPTIONS OF CORRUPTION
24
Chart 4.8
Spread of Corruption
State Auto Inspection (DAI)
Court System
To Get Health Care (Including Doctors and
Sta at Hospitals and Clinics, Pharmacies)
Militzia (Without DAI)
Prosecutors’ O ce
Universities and
Their Educators
Land Privatization, Ownership, and Use
To Request Di erent Governmental Permits
(Including Building Permit)
Bringing Goods Through Customs or
Obtaining Customs Permission to Bring Goods
Tax Authorities
To Get Government Subsidized Housing
To Get a Job at a State or Government Institution
Business Regulations
and Inspections
To Register or Privatize
Real Estate (House, Apartment)
Drafting into Army Bodies
State Notaries
To Have Utilities Installed or Repaired
(Phone, Gas, Electricity or Water)
To Obtain Unemployment Aid and Other Social Aid (Pensions, etc.)
Schools Administration and Teachers
To Apply for a Loan to the State Institution
57,5%
63,3%
64,4%
 49,0%
49,0%
59,3%
60,3%
54,0%
54,2%
 60,3%
60,3%
 54,2%
54,2%
58,4%
59,1%
42,9%
51,6%
51,1%
 46,3%
46,3%
49,0%
47,1%
37,6%
47,1%
45,9%
35,0%
|
|
|
|
|
|
|
|
|
42,2% |
|
|
|||||||||||||
|
|
|
|
|
|
|
|
|
|
|
|
|
|
|
|
|
|
|
|
|
42,1% |
|
|
|
|
42,8% |
|
|
|||||||||||||||||||||
|
|
|
||||||||||||||||||||||
|
|
|
|
|
|
|
|
|
38,6% |
|
|
|||||||||||||
|
|
|
|
|
|
|
|
|
|
|
|
|
|
|
|
42,1% |
|
|
||||||
|
40,3% |
|
|
|||||||||||||||||||||
|
|
|
||||||||||||||||||||||
|
|
|
|
|
|
|
|
|
|
|
|
|
|
|
|
|
|
|
|
40,4% |
|
|
||
|
|
|
|
|
|
|
|
|
|
|
|
|
|
|
|
42,0% |
|
|
||||||
|
38,6% |
|
|
|||||||||||||||||||||
|
|
|
||||||||||||||||||||||
|
|
|
|
|
|
|
|
|
|
40,2% |
|
|
||||||||||||
|
|
|
|
|
|
|
|
|
|
|
|
|
|
|
38,3% |
|
|
|||||||
|
29,3% |
|
|
|
|
|
|
|||||||||||||||||
|
|
|
|
|
|
|
||||||||||||||||||
|
|
|
|
|
|
|
|
31,0% |
|
|
|
|
|
|
||||||||||
|
|
|
|
|
|
|
|
|
|
|
|
|
36,2% |
|
|
|||||||||
|
27,6% |
|
|
|
|
|
|
|
||||||||||||||||
|
|
|
|
|
|
|
|
|||||||||||||||||
|
|
|
|
|
|
|
|
29,3% |
|
|
|
|
|
|
||||||||||
|
|
|
|
|
|
|
|
|
|
|
|
|
34,0% |
|
|
|
|
|||||||
|
|
29,1% |
|
|
|
|
|
|
||||||||||||||||
|
|
|
|
|
|
|
|
|||||||||||||||||
|
|
|
|
|
|
|
|
|
|
35,4% |
|
|
|
|||||||||||
|
|
|
|
|
|
|
|
|
|
|
|
|
|
33,5% |
|
|
|
|
||||||
|
|
|
30,2% |
|
|
|
|
|
|
|||||||||||||||
|
|
|
|
|
|
|
|
|
||||||||||||||||
|
|
|
|
|
|
26,1% |
|
|
|
|
|
|
|
|
|
|||||||||
|
|
|
|
|
|
|
|
|
27,2% |
|
|
|
|
|
|
|
||||||||
|
22,8% |
|
|
|
|
|
|
|
|
|
|
|||||||||||||
|
|
|
|
|
|
|
|
|
|
|
||||||||||||||
|
|
|
|
|
|
26,2% |
|
|
|
|
|
|
|
|
||||||||||
|
|
|
|
|
|
|
|
26,8% |
|
|
|
|
|
|
|
|||||||||
|
|
23,8% |
|
|
|
|
|
|
|
|
|
|||||||||||||
|
|
|
|
|
|
|
|
|
|
|
||||||||||||||
|
|
|
|
19,4% |
|
|
|
|
|
|
|
|
|
|
|
|
|
|
|
|||||
|
|
|
|
|
|
21,4% |
|
|
|
|
|
|
|
|
|
|
|
|
||||||
|
14,4% |
|
|
|
|
|
|
|
|
|
|
|
|
|
|
|
|
|
||||||
|
|
|
|
|
|
|
|
|
|
|
|
|
|
|
|
|||||||||
|
|
16,3% |
|
|
|
|
|
|
|
|
|
|
|
|
|
|
|
|
||||||
|
|
|
|
|
|
20,4% |
|
|
|
|
|
|
|
|
|
|
|
|
||||||
|
|
17,6% |
|
|
|
|
|
|
|
|
|
|
|
|
|
|
|
|||||||
|
|
|
|
|
|
|
|
|
|
|
|
|
|
|
|
|
||||||||
|
|
|
|
|
16,8% |
|
|
|
|
|
|
|
|
|
|
|
|
|
|
2007 |
||||
|
|
|
|
|
|
|
|
|
|
|
|
|
|
|
|
|
|
|
||||||
|
|
|
|
|
18,7% |
|
|
|
|
|
|
|
|
|
|
|
|
|
|
2009 |
||||
|
|
15,5% |
|
|
|
|
|
|
|
|
|
|
|
|
|
|
|
|||||||
|
|
|
|
|
|
|
|
|
|
|
|
|
|
|
|
|
||||||||
|
|
|
|
|
|
|
|
|
|
|
|
|
|
|
|
|
||||||||
|
|
|
16,6% |
|
|
|
|
|
|
|
|
|
|
|
|
|
|
2011 |
||||||
|
|
|
|
18,1% |
|
|
|
|
|
|
|
|
|
|
|
|
|
|
||||||
Question: in your opinion, to what extent corruption is spread in [Sectors of life]?
A comparative analysis of the results of the survey shows a certain correlation between the growing perceptions of the spread of corruption in certain spheres and a reduced level of the government’s countermeasures and their ineffectiveness. The most recent survey demonstrates an even higher level of the public perception of the government’s anti-corruption measures.
As in previous years, a rather low number of respondents are aware of any anti-corruption measures applied by the government in various sectors: according to the findings of the 2011 survey, the share of these (depending on sector) varied between 6.6% and 28% (7.4% and 29.1% in 2009, and 8.8% and 27.3% in 2007, respectively). Changes in the levels of awareness observed in certain areas are insignificant: from 2.7 p.p. decrease to a 3.5 p.p. increase. Mostofthosewhoheardaboutsuchmeasures(from49%to76,9%in2011),believetheyaresomewhat effective, which corresponds to the findings of surveys conducted in 2009 and 2007, though the maximum index in the previous surveys even exceeded 80%.
All MS World ENG.indd 24 |
09.08.2011 23:29:34 |
Table 4.1
Dynamics of the perceived spread of corruption
and the effectiveness of preventive measures5
|
Spread of |
Government |
Countermeasures are |
|
Sphere |
application of anti- |
|||
corruption |
effective6 |
|||
|
|
corruption measures |
|
|
Militsiya (not including the SAI) |
(+ 0,7) |
(– 0,3) |
(+ 3,5) |
|
|
|
|
|
|
Healthcare |
(+ 6,1) |
(– 1,3) |
(+ 0,1) |
|
|
|
|
|
|
Universities |
(– 1,9) |
(– 2,3) |
(– 4,8) |
|
|
|
|
|
|
State Tax Administration |
(+ 1,6) |
(+ 2,3) |
(– 4,7) |
|
|
|
|
|
|
Customs inspection and obtaining |
(+ 3,5) |
(+ 2,4) |
(– 2,5) |
|
customs documents |
||||
|
|
|
||
Getting a government job |
(+ 5,2) |
(– 1,2) |
(– 7,0) |
|
|
|
|
|
|
Business regulation and inspection |
(+ 4,7) |
(+ 3,5) |
(– 8,6) |
|
|
|
|
|
|
State notaries |
(+ 0,6) |
(– 2,0) |
(– 10,4) |
|
|
|
|
|
|
Army draft |
(+ 1,1) |
(– 2,7) |
(– 11,7) |
|
|
|
|
|
|
Installation or repair of communal |
(+ 2,0) |
(– 1,8) |
(– 9,0) |
|
services |
||||
|
|
|
||
Schools |
(+ 1,9) |
(– 2,3) |
(– 4,3) |
|
|
|
|
|
|
Applying for a loan from a state |
(+ 1,5) |
(– 0,8) |
(– 10,1) |
|
institution |
||||
|
|
|
||
Unemployment and other social aid |
(+ 4,1) |
(– 0,1) |
(– 8,9) |
|
|
|
|
|
Respondents of the last survey more critically assess the effectiveness of the new governments’ anti-corruption measures in certain spheres. The only sector in which the effectiveness of countermeasures was perceived as being slightly more effective was the police (without SAI), where 53.6% of the respondents said they were somewhateffectivevis-à-vis 50.1%in 2009(astatistically significantdifferenceatthelevelof p=0.05). Meanwhile, the significant reduction in effectiveness of counter measures is perceived in as many as 10 sectors (in the range from 4.3 to 11.9 p.p.).
Thus, although the respondents do not believe that the government has curtailed its anti-corruption activities compared to 2009, they do perceive them as less effective.
It is interesting that regulation of business activity is the only sector where significant changes are noted in all three indices: the respondents note increased corruption in this sphere (from 29.3% to 34%) simultaneously with the growth of public awareness of the government’s anti-corruption measures (from 8.7% to 12.2%) and reduced effectivenessofsuchmeasures(from65.3%to56.7%).Thecloseattentiontothisspherewasclearlyevidentinthe events following the adoption and implementation of the new Tax Code.
Therefore, it cannot be said that the spread of corruption is definitely perceived to be the result of government’s inactivity, but more the lack of active government reforms in fighting corruption within various sectors that influence public perception of the spread of corruption.
5The table shows changes (— increase, — decrease) in corresponding indices for 2011 in comparison to 2009 (changes over 3 percentage points (p.p.) are shown with double simbolsor . All of these changes are statistically significant at a level of р=0.05). The list of sectors is sorted according to decreases in the perceptions of the level of corruption.
6Percentage of those who feel that the government applies measures within the corresponding sector.
4. PERCEPTIONS OF CORRUPTION
25
All MS World ENG.indd 25 |
09.08.2011 23:29:35 |
4. PERCEPTIONS OF CORRUPTION
26
Overall corruption perceptions index by region
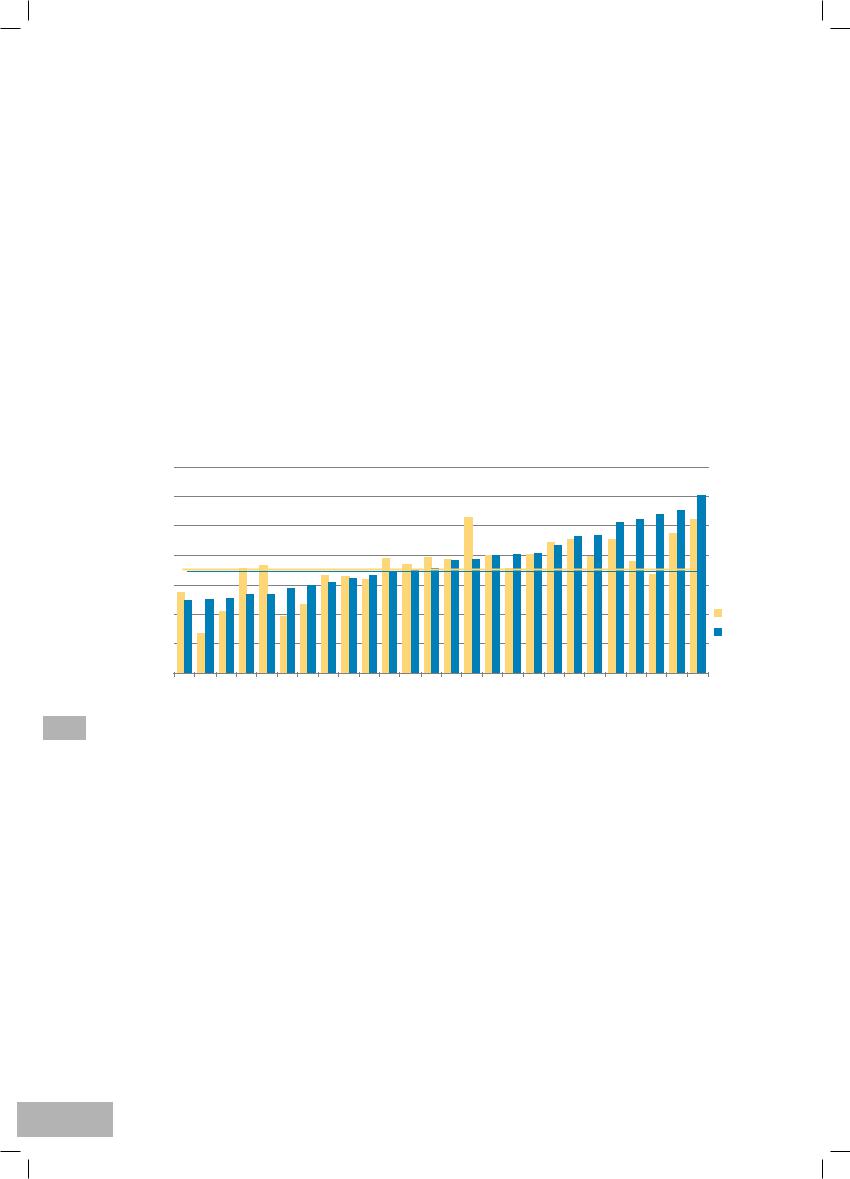
The Corruption Perceptions Index (CPI) is calculated based on respondents’ answers to the question of how widespread they believe corruption to be within Ukraine’s governing bodies and among public officials. The more respondents believe that corruption is widespread across the 20 different functions and sectors, the higher the CPI value (which ranges from 100 – the highest perceived corruption to 0 – the least perceived corruption). The median value for the CPI in Ukraine increased from 33 in 2007 to 37 in 2008 and has remained at this level to date.
Therefore, respondents perceive that the spread of corruption within the country has not changed over the last two years. Currently, on average, Ukrainians perceive that more than one-third of all of the country’s major sectors and institutions are highly corrupted.
In terms of regional distribution, the worst situations have appeared in the Kirovohrad oblast, joined now by the Sumy, Volyn and Donetsk oblasts, as well as Crimea, where the population considers more than half the sectors of the economy to be corrupt and believes that the corruption situation has significantly worsened over the last two years.
Overall, in eleven Ukraine’s oblasts (districts), the CPI has grown, while growing more than five points in ten of them. A significant decline in the corresponding index (by more than 5 points) has been witnessed in only five oblasts: Kharkiv (-14.1), Chernihiv (-9.9), Zaporizhzhia (-9.0), Kherson (-4.5) and Luhansk (-3.9). The remaining 10 oblasts did not show any change in the level of perceived corruption.
Chart 4.9
Corruption Perception Index
70 |
|
60 |
|
50 |
|
40 |
Median 2009 = 37,1 |
|
|
30 |
Median 2011 = 37,0 |
|
|
20 |
2009 |
10 |
2011 |
|
|
0 |
|
Zhytomyrska |
Chernihivska |
|
Mykolayivska |
|
Khersonska |
|
Chernivetska |
|
(city) |
|
OdeskaKyivska |
Crimea |
|
|||||
|
|
|
Khmelnitska |
|
|
|
|
|
|
|||||||||
|
|
Ternopilska |
|
|
Rivnenska |
|
|
Kharkivska |
-Frankivska |
|
|
|
|
|
||||
|
Zaporizka |
|
Zakarpatska |
Cherkaska |
|
Luhanska |
|
|
|
Donetska |
Volynska |
|||||||
PoltavskaVinnytska |
|
|
|
|
|
|
Ivano |
|
|
|
|
|
Kirovogradska |
|||||
|
|
|
|
|
|
|
Dnipropetrovska |
|
|
Kyiv |
Lvivska |
|
|
|
||||
|
|
|
|
|
|
|
|
|
|
|
|
|
|
|
Sumska |
|||
Overall, an analysis of correlations in previous surveys is corroborated by the findings of the last survey. They indicated that the perception of corruption (as measured by the CPI) is strongly related to a number of factors:
•The perception of the spread of corruption is strongly related to the lack of trust in government at all levels.
•The greater the Corruption Perception Index, the less one believes that authorities are doing as much as they can to reduce corruption.
•Societyseemsmorecorrupttocitizenswhoareabletoprofitfromcorruptionforpersonalgains,asopposedto those who are less inclined to justify corruption.
•The higher the CPI, the more citizens feel that the level of corruption has grown over the last two years.
•The more respondents see the state sector as being corrupt, the more they express their readiness to defend their rights against dishonest officials.
•Perceptions of the level of corruption are strongly related to past corruption experience. Those who have personal experience with corrupt transactions are more convinced of its spread within government.
•Middle-agedpeople,educatedcitizens,higherincomegroups,andthosewholiveincitiestendtoperceivethat there is a wider spread of corruption than the average respondent. This may be explained, in part, by the fact that these socio-demographic groups experience corruption more often than the average respondent.
All MS World ENG.indd 26 |
09.08.2011 23:29:35 |
5.CITIZENS’EXPERIENCES WITH CORRUPTION
Contrary to the perception of corruption, the actual spread of this phenomenon is evaluated based on specific cases of bribery and abuse of power reported by citizens. Therefore, reports of actual first-hand experiences of citizens with corruption are quite telling about the nature, level and trends in this phenomenon and are more reliable than perceptions.
Citizens’ transactions with government agencies and functions
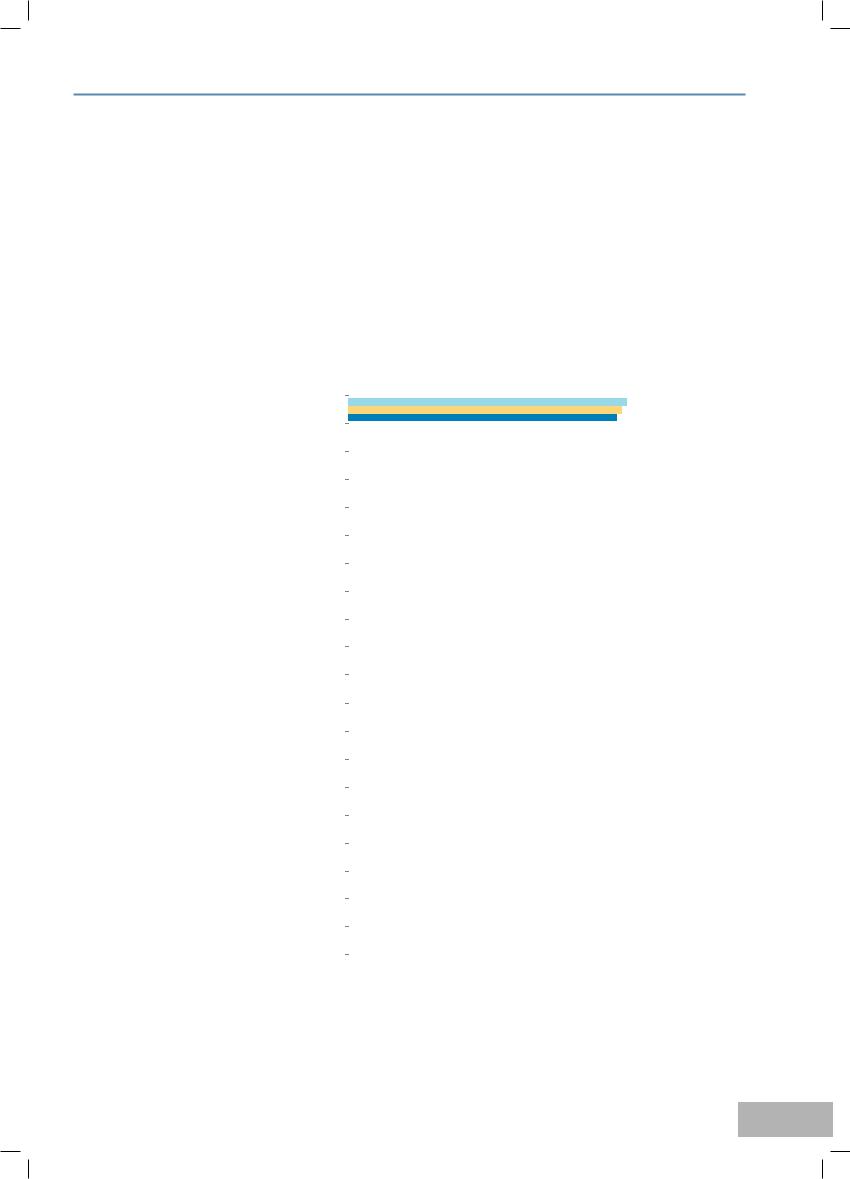
Over the entire period of monitoring of the status of corruption in Ukraine, there have been no significant changes in citizens’ transactions with government agencies or state institutions. Traditionally, the largest share of respondents have dealings with state medical institutions (66.2%), the SAI (23.7%), schools (22.2%), installation or repair of municipal utilities services (20.7%) and applying for or receiving state social assistance (18.4%). Only less than 10% of the respondents contacted any of the remaining agencies. The portion of families reporting that they
did not have any transactions with state institutions remained unchanged at 15%.
Chart 5.1
Citizen Interaction with Government Agencies and Functions
Healthcare |
|
|
|
|
|
|
|
|
|
|
|
|
|
|
|
|
|
|
|
|
|
|
State auto inspection (DAI) |
|
19,7% |
||||||||||||||||||||
|
||||||||||||||||||||||
|
|
|
|
|
|
|
|
|
|
|
|
|
|
|
|
|
|
|
|
|
23,2% |
|
|
|
|
|
|
|
|
|
|
|
|
|
|
|
|
23,7% |
|||||||
Schools |
|
23,6% |
||||||||||||||||||||
|
||||||||||||||||||||||
|
|
|
|
|
|
|
|
|
|
|
|
|
|
|
|
|
|
|
|
|
22,7% |
|
|
|
|
|
|
|
|
|
|
|
|
|
|
|
22,2% |
||||||||
Utilities installed and repaired |
|
22,6% |
||||||||||||||||||||
|
||||||||||||||||||||||
|
|
|
|
|
|
|
|
|
|
|
|
|
|
|
|
|
|
19,6% |
||||
|
|
|
|
|
|
|
|
|
|
|
|
|
20,7% |
|||||||||
Unemployment and other social aid |
|
18,6% |
||||||||||||||||||||
|
||||||||||||||||||||||
|
|
|
|
|
|
|
|
|
|
|
|
|
|
|
|
|
16,7% |
|
||||
|
|
|
|
|
|
|
|
|
|
|
|
18,4% |
||||||||||
Land privatization and ownership |
|
8,0% |
|
|
|
|
|
|
|
|||||||||||||
|
|
|
|
|
|
|
|
|||||||||||||||
|
|
|
|
|
|
|
|
|
|
|
|
|
8,2% |
|
|
|
|
|
|
|
||
|
|
|
|
|
|
|
|
|
9,7% |
|
|
|
|
|
|
|
||||||
Register and privatize real estate |
|
10,2% |
|
|
|
|
|
|
||||||||||||||
|
|
|
|
|
|
|
||||||||||||||||
|
|
|
|
|
|
|
|
|
|
|
|
|
8,9% |
|
|
|
|
|
|
|
||
|
|
|
|
|
|
|
|
8,6% |
|
|
|
|
|
|
|
|||||||
Universities |
|
9,5% |
|
|
|
|
|
|
|
|||||||||||||
|
|
|
|
|
|
|
|
|||||||||||||||
|
|
|
|
|
|
|
|
|
|
|
|
|
8,8% |
|
|
|
|
|
|
|
||
|
|
|
|
|
|
|
|
8,6% |
|
|
|
|
|
|
|
|||||||
Militzia (without DAI) |
|
8,1% |
|
|
|
|
|
|
|
|||||||||||||
|
|
|
|
|
|
|
|
|||||||||||||||
|
|
|
|
|
|
|
|
|
|
|
8,2% |
|
|
|
|
|
|
|
||||
|
|
|
|
|
|
|
|
8,2% |
|
|
|
|
|
|
|
|||||||
State notaries |
|
8,6% |
|
|
|
|
|
|
|
|||||||||||||
|
|
|
|
|
|
|
|
|||||||||||||||
|
|
|
|
|
|
|
|
|
|
|
8,8% |
|
|
|
|
|
|
|
||||
|
|
|
|
|
|
|
6,4% |
|
|
|
|
|
|
|
||||||||
|
|
4,9% |
|
|
|
|
|
|
|
|||||||||||||
|
|
|
|
|
|
|
|
|
||||||||||||||
Court system |
|
|
|
|
|
|
|
|
|
|
4,6% |
|
|
|
|
|
|
|
|
|||
|
|
|
|
|
|
|
5,6% |
|
|
|
|
|
|
|
||||||||
Government permits |
|
4,7% |
|
|
|
|
|
|
|
|
||||||||||||
|
|
|
|
|
|
|
|
|||||||||||||||
|
|
|
|
|
|
|
|
|
5,0% |
|
|
|
|
|
|
|
||||||
|
|
|
|
|
|
|
5,1% |
|
|
|
|
|
|
|
||||||||
Getting government job |
|
5,3% |
|
|
|
|
|
|
|
|||||||||||||
|
|
|
|
|
|
|
|
|||||||||||||||
|
|
|
|
|
|
|
4,3% |
|
|
|
|
|
|
|
|
|||||||
|
|
|
|
4,5% |
|
|
|
|
|
|
|
|
||||||||||
Tax authorities |
|
5,1% |
|
|
|
|
|
|
|
|||||||||||||
|
|
|
|
|
|
|
|
|||||||||||||||
|
|
|
|
|
|
|
|
|
5,0% |
|
|
|
|
|
|
|
||||||
|
|
|
|
4,3% |
|
|
|
|
|
|
|
|
||||||||||
Army draft |
|
3,6% |
|
|
|
|
|
|
|
|
|
|||||||||||
|
|
|
|
|
|
|
|
|
|
|||||||||||||
|
|
|
|
|
2,9% |
|
|
|
|
|
|
|
|
|
|
|||||||
|
|
2,7% |
|
|
|
|
|
|
|
|
|
|
||||||||||
Business regulation and inspection |
|
2,3% |
|
|
|
|
|
|
|
|
|
|
|
|||||||||
|
|
|
|
|
|
|
|
|
|
|
|
|||||||||||
|
|
|
|
2,8% |
|
|
|
|
|
|
|
|
|
|
||||||||
|
|
2,6% |
|
|
|
|
|
|
|
|
|
|
||||||||||
Applyingforloanfromstateinstitution |
|
|
5,2% |
|
|
|
|
|
|
|
||||||||||||
|
|
|
|
|
|
|
|
|
||||||||||||||
|
|
|
|
|
|
|
3,9% |
|
|
|
|
|
|
|
|
|
||||||
|
|
2,2% |
|
|
|
|
|
|
|
|
|
|
|
|||||||||
Customs |
|
3,3% |
|
|
|
|
|
|
|
|
|
|
||||||||||
|
|
|
|
|
|
|
|
|
|
|
||||||||||||
|
|
|
|
|
2,6% |
|
|
|
|
|
|
|
|
|
|
|||||||
|
|
1,9% |
|
|
|
|
|
|
|
|
|
|
|
|||||||||
Prosecutors’ o ce |
|
1,9% |
|
|
|
|
|
|
|
|
|
|
|
|||||||||
|
|
|
|
|
|
|
|
|
|
|
|
|||||||||||
|
|
|
1,9% |
|
|
|
|
|
|
|
|
|
|
|
||||||||
|
|
1,8% |
|
|
|
|
|
|
|
|
|
|
|
|||||||||
Government subsidized housing |
|
1,7% |
|
|
|
|
|
|
|
|
|
|
|
|||||||||
|
|
|
|
|
|
|
|
|
|
|
|
|||||||||||
|
|
1,3% |
|
|
|
|
|
|
|
|
|
|
|
|||||||||
|
|
1,3% |
|
|
|
|
|
|
|
|
|
|
|
|||||||||
|
|
|
|
|
|
|
|
|
|
|
|
|
|
|
|
|
|
|
|
|
|
|
68,7%
67,4%
66,2%
 2007
2007
 2009
2009  2011
2011
Question: Over the last 12 months, have you or anyone in your family dealt with government authorities or with any of the state institutions to get the following services?
There was a noticeable decline in the share of applicants for government loans. Interaction with other institutions remained unchanged.
27
All MS World ENG.indd 27 |
09.08.2011 23:29:35 |
5.CITIZENS’EXPERIENCES WITH CORRUPTION
28
Extortion, voluntary bribes and use of personal connections (by sector)
Despite the fact that Ukrainian perceptions of the spread of corruption within various sectors and institutions has not changed, the level of real corruption experiences is decreasing. Overall, compared to 2009, the share of those who encountered any form of corruption over the last year decreased by more than 2.4 p.p (a statistically significant difference at the level of p=0.001). Over the last 12 months, 60.1% of respondents or their family members were involved in some form of corrupt transactions when dealing with state officials (in comparison to 62.5% in 2009 and 67% in 2007).
Chart 5.2
Involved in Corruption over the Past 12 Months
67,0% |
|
|
|
62,5% |
60,1% |
2007 |
2009 |
2011 |
|
|
N(2007)=10528; N(2009)=10511; N(2011)=10600 |
Question: Over the last 12 months have you or members of your family had to deal with any corrupt behavior of representatives of
government authorities, including educational, healthcare and other organizations?
Aqualitativesurveycomplements the pictureof quantitativedata with real lifeexamples of encounters with corruption. Participants of the discussions are convinced that there is hardly any sector in which corruption does not exist:
“Healthcare,education, judges, militsiya. Corruption is everywhereand all theway through. It’s everywhere, wherethereisroomforrent-seeking.Ifthereisnoroom,thereisnocorruption.Inastore,acheapergoodmay beheldbackandlateronsoldatahigherprice.Therearesectorswherecorruptionisimpossiblealtogether.”
“Ifinuniversitywehadtopassanexaminanotsoimportantdiscipline,wejustagreedtohowmucheveryone will chip in.”
“He says to me: Dad, let’s pass a motor vehicle inspection honestly. I say, let’s do it son. And we went there and tried to pass the inspection honestly. We were passing it for a whole week and we did not manage to complete it. Eventually we were forced to get it done the dishonest way”.
“WeareplanningatriptoCrimeawithmyfriends.Iapproachaticketboothattherailwaystationandaskthe clerk if there are tickets to Simferopol. No tickets. To Sevastopol? No tickets. I said I will pay double the price. Shegivesmehertelephonenumberandaskstocallherin10minutes.Icallherin10minutes.Sheasks,“How manyofyouaregoing?”Irespond,“Sixpersons”.Shesays,“Ihavefoundticketsforyou,comepickthemup”.
“He paid money to work as a deputy judge for a meager salary and a long tenure. He was forced to pay a hugeamountofmoneytogetthisjob,becauseadeputyjudgeisjustonestepawayfrombecomingajudge”.
“Or get in line for government subsidized housing. Your number in the line does not matter. For example, you may be 120th, then they dole out apartments, and after that you find out that your number is now 130th. ThisiswhatIcallcorruption:somebodyhaspaidtoskipaheadoftheline.Ipersonallyencounteredthat.This is my own experience”.
“And when you cross the country’s border you have to pay. Otherwise you will stand in line for two days and your goods will spoil. And you need money to get into a hospital and have contact with any government institution”.
All MS World ENG.indd 28 |
09.08.2011 23:29:35 |
Corruption by types of bribery
Amoredetailedreviewofcorruptionexperiencesbysectorsthatprovideservicewithfundingfromthebudgetsof all levels shows some variation. Some sectors show decreases in extortion, while others show increases. In Chart 5.3,thesectorsaresortedbychangesinextortionexperiences(fromthehighestdecreasetothehighestincrease).
55.2% of respondents encountered extortion at least in one sector and this value does not differ from the 2009 findings. No statistically significant decrease was recorded in any of the sectors. Quite to the contrary, a notable increaseinbriberywasreportedbyusersofsuchservicesasregistrationorprivatizationofrealestate(from22.6% to 32.2%), SAI (from 39.7% to 45.1%), state tax administration (from 19.6% to 28.7%) and the militsiya (from 46.1 to 53.1%).
Chart 5.3
Bribes Extorted
(percent of respondents who had contacted respective state institutions)
|
|
|
|
|
|
|
|
|
|
|
|
|
|
|
|
|
|
31,8% |
|
|
|
|
|
|
|
|
|
|
|
|
|
|
|
|
|
||||||||||
|
|
|
|
|
|
|
|
|
|
|
|
|
|
|
|
|
|
|
|
|
|
|
|
|
|
|
|
|
|
|
|
|
|
|
|||||||||||
Court system |
|
|
|
|
|
|
|
|
|
|
|
|
|
|
|
|
30,2% |
|
|
|
|
|
|
|
|
|
|
|
|
|
|
|
|
|
|
|
|
||||||||
|
|
|
|
|
|
|
|
|
|
|
26,3% |
|
|
|
|
|
|
|
|
|
|
|
|
|
|
|
|
|
|
|
|
|
|
|
|
||||||||||
|
|
|
|
12,4% |
|
|
|
|
|
|
|
|
|
|
|
|
|
|
|
|
|
|
|
|
|
|
|
|
|
|
|
|
|||||||||||||
|
|
|
|
|
|
|
|
|
|
|
|
|
|
|
|
|
|
|
|
|
|
|
|
|
|
|
|
|
|
|
|
|
|
|
|
|
|
|
|
|
|
|
|||
State notaries |
|
|
|
|
12,7% |
|
|
|
|
|
|
|
|
|
|
|
|
|
|
|
|
|
|
|
|
|
|
|
|
|
|
|
|
|
|
|
|
|
|
|
|
|
|||
|
|
|
|
|
11,1% |
|
|
|
|
|
26,3% |
|
|
|
|
|
|
|
|
|
|
|
|
|
|
|
|
|
|
|
|
|
|
|
|
||||||||||
|
|
|
|
|
|
|
|
|
|
|
|
|
|
|
|
|
|
|
|
|
|
|
|
|
|
|
|
|
|
||||||||||||||||
|
|
|
|
|
|
|
|
|
|
|
|
|
|
|
|
|
|
|
|
|
|
|
|
|
|
|
|||||||||||||||||||
Prosecutors’ o ce |
|
|
|
|
|
|
|
|
|
|
|
|
|
|
|
|
30,3% |
|
|
|
|
|
|
|
|
|
|
|
|
|
|
|
|
|
|
|
|
||||||||
|
|
|
|
|
|
|
|
|
|
|
|
|
|
|
|
29,6% |
39,2% |
|
|
|
|
|
|
|
|
|
|
|
|
||||||||||||||||
|
|
|
|
|
|
|
|
|
|
|
|
|
|
|
|
|
|
|
|
|
|
|
|
|
|
|
|
|
|||||||||||||||||
|
|
|
|
|
|
|
|
|
|
|
|
|
|
|
|
|
|
|
|
|
|
|
|
|
|
|
|
|
|
|
|
|
|
|
|
|
|
||||||||
Governmentsubsidizedhousing |
|
|
|
|
|
|
|
|
|
|
|
|
|
|
|
|
|
|
|
|
|
|
38,6% |
|
|
Extortion reduced |
|
|
|||||||||||||||||
|
|
|
|
|
|
|
|
|
|
|
|
|
|
|
|
|
|
|
|
|
|
|
38,4% |
|
|
|
|
||||||||||||||||||
|
|
9,0% |
|
|
|
|
|
|
|
|
|
|
|
|
|
|
|
|
|
|
|
|
|
|
|
|
|
|
|
|
|
above this line |
|
|
|||||||||||
Applyingforloanfromstateinstitution |
|
|
6,7% |
|
|
|
|
|
|
|
|
|
|
|
|
|
|
|
|
|
|
|
|
|
|
|
|
|
|
|
|
|
|
|
|
|
|
|
|
|
|
|
|||
|
|
6,7% |
|
|
|
|
|
|
|
|
|
|
|
|
|
|
|
|
|
|
|
|
|
|
|
|
|
|
|
|
|
|
|
|
|
|
|
|
|
|
|
||||
|
|
|
|
|
|
|
|
|
|
|
|
|
|
|
|
|
|
|
|
|
|
|
|
|
|
|
|
|
|
|
|
|
|
|
|
||||||||||
Schools |
|
|
|
|
|
|
|
|
|
|
|
|
|
|
|
|
|
|
|
|
|
|
|
|
|
|
|
|
|
|
|
|
|
|
|
|
59,5% |
|
|
|
|||||
|
|
|
|
|
|
|
|
|
|
|
|
|
|
|
|
|
|
|
|
|
|
|
|
|
|
|
|
|
|
|
|
|
|
|
|
||||||||||
|
|
|
|
|
|
|
|
|
|
|
|
|
|
|
|
|
|
|
|
|
|
|
|
|
|
|
|
|
|
|
|
|
|
|
|
59,7% |
|
|
|
||||||
|
|
|
|
|
|
|
|
|
|
|
|
|
|
|
|
|
|
|
|
|
|
|
|
|
|
|
|
|
|
|
|
|
|
|
|
|
|
61,1% |
|
|
|||||
Utilities installed and repaired |
|
|
|
|
|
|
|
|
|
|
|
|
|
|
|
|
|
|
|
|
|
|
|
36,6% |
|
|
|
|
|
|
|||||||||||||||
|
|
|
|
|
|
|
|
|
|
|
|
|
|
|
|
|
|
|
|
|
|
|
|||||||||||||||||||||||
|
|
|
|
|
|
|
|
|
|
|
|
|
26,4% |
|
|
|
|
|
|
|
|
|
|
|
|
|
|
||||||||||||||||||
|
|
|
|
|
|
|
|
|
|
|
|
|
|
28,2% |
|
|
|
|
|
|
|
|
|
|
|
|
|
|
|
|
|
|
|
|
|
||||||||||
Unemploymentandothersocialaid |
|
|
8,8% |
|
|
|
|
|
|
|
|
|
|
|
|
|
|
|
|
|
|
|
|
|
|
|
|
|
|
|
|||||||||||||||
|
|
|
|
|
|
|
|
|
|
|
|
|
|
|
|
|
|
|
|
|
|
|
|
|
|
|
|
|
|
|
|
|
|
|
|
|
|
|
|
|
|||||
|
6,8% |
|
|
|
|
|
|
|
|
|
|
|
|
|
|
|
|
|
|
|
|
|
|
|
|
|
|
|
|
|
|
|
|
|
|
|
|
|
|
|
|||||
Healthcare |
|
|
8,9% |
|
|
|
|
|
|
|
|
|
|
|
|
|
|
|
|
|
|
|
|
|
|
|
|
|
|
|
|
|
|
|
|
|
65,1% |
|
|
||||||
|
|
|
|
|
|
|
|
|
|
|
|
|
|
|
|
|
|
|
|
|
|
|
|
|
|
|
|
|
|
|
|
||||||||||||||
|
|
|
|
|
|
|
|
|
|
|
|
|
|
|
|
|
|
|
|
|
|
|
|
|
|
|
|
|
|
|
|
|
|
|
|
|
|
|
|
|
|||||
|
|
|
|
|
|
|
|
|
|
|
|
|
|
|
|
|
|
|
|
|
|
|
|
|
|
|
|
|
|
|
|
|
|
|
|
|
|
|
|
62,7% |
|
|
|||
|
|
|
|
|
|
|
|
|
|
|
|
|
|
|
|
|
|
|
|
|
|
|
|
|
|
|
|
|
|
|
|
|
|
|
|
|
|
|
|
|
66,0% |
|
|
||
Business regulation and inspection |
|
|
|
|
|
|
|
|
|
|
|
|
|
|
|
|
|
|
|
|
|
|
|
|
|
|
|
41,1% |
|
|
|
|
|
|
|||||||||||
|
|
|
|
|
|
|
|
|
|
|
|
|
|
|
|
|
|
|
|
|
|
|
|
|
|
|
|
|
|
|
|
||||||||||||||
|
|
|
|
|
|
|
|
|
|
|
|
|
|
|
|
|
|
|
35,4% |
|
|
|
|
|
|
|
|
|
|
|
|
|
|
|
|||||||||||
|
|
|
|
|
|
|
|
|
|
|
|
|
|
|
|
|
|
|
|
|
|
|
|
|
40,2% |
|
|
|
|
|
|
|
|
|
|
|
|
||||||||
|
|
|
|
|
|
|
|
|
|
|
|
|
|
|
|
|
|
|
|
|
|
|
|
|
|
|
|
|
|
|
|
|
|
|
|
|
|||||||||
|
|
|
|
|
|
|
|
|
|
|
|
|
|
|
|
|
|
|
|
|
|
|
|
|
|
41,3% |
|
|
|
|
|
|
|
|
|
|
|
||||||||
|
|
|
|
|
|
|
|
|
|
|
|
|
|
|
|
|
|
|
|
|
|
|
|
|
|
|
|
|
|
|
|
|
|
|
|
|
|
|
|||||||
State auto inspection (DAI) |
|
|
|
|
|
|
|
|
|
|
|
|
|
|
|
|
|
|
|
|
|
|
|
39,7% |
|
|
|
|
|
|
|
|
|
|
|
|
|||||||||
|
|
|
|
|
|
|
|
|
|
|
|
|
|
|
|
|
|
|
|
|
|
|
|
|
|
|
|
|
|
45,1% |
|
|
|
|
|
|
|
|
|
|
|||||
|
|
|
|
|
|
|
|
|
|
|
|
|
|
|
|
|
|
|
32,1% |
|
|
|
|
|
|
|
|
|
|
|
|
|
|
|
|
||||||||||
|
|
|
|
|
|
|
|
|
|
|
|
|
|
|
|
|
|
|
|
|
|
|
|
|
|
|
|
|
|
|
|
|
|
|
|||||||||||
Army draft |
|
|
|
|
20,2% |
|
|
|
|
|
|
|
|
|
|
|
|
|
|
|
|
|
|
|
|
|
|
|
|
|
|
|
|
|
|||||||||||
|
|
|
|
|
|
|
|
|
|
|
26,0% |
|
|
|
|
|
|
|
|
|
|
|
|
|
|
|
|
|
|
|
|
|
|
|
|
||||||||||
|
|
|
|
|
|
|
|
|
|
|
|
|
|
|
|
|
|
|
|
|
|
|
|
|
|
|
|
47,3% |
|
|
|
|
|
|
|
|
|
|
|||||||
|
|
|
|
|
|
|
|
|
|
|
|
|
|
|
|
|
|
|
|
|
|
|
|
|
|
|
|
|
|
|
|
|
|
|
|
|
|
|
|
|
|||||
Universities |
|
|
|
|
|
|
|
|
|
|
|
|
|
|
|
|
|
|
|
|
|
|
|
|
|
|
43,8% |
|
|
|
|
|
|
|
|
|
|
||||||||
|
|
|
|
|
|
|
|
|
|
|
|
|
|
|
|
|
|
|
|
|
|
|
|
|
|
|
|
|
|
|
49,7% |
|
|
|
|
|
|
|
|
||||||
|
|
|
|
|
|
|
|
|
|
|
|
|
|
|
|
|
|
|
32,1% |
|
|
|
|
|
|
|
|
|
|
|
|
|
|
|
|
||||||||||
|
|
|
|
|
|
|
|
|
|
|
|
|
|
|
|
|
|
|
|
|
|
|
|
|
|
|
|
|
|
|
|
|
|
|
|||||||||||
Getting government job |
|
|
|
|
|
|
|
|
|
|
|
|
|
|
|
|
29,5% |
|
|
|
|
|
|
|
|
|
|
|
|
|
|
|
|
|
|
|
|
||||||||
|
|
|
|
|
|
|
|
|
|
|
|
|
|
|
|
|
|
|
|
|
|
36,1% |
|
|
|
|
|
|
2007 |
|
|
||||||||||||||
|
|
|
|
|
|
|
|
|
|
|
|
|
|
|
|
|
|
|
|
|
|
|
|
36,5% |
|
|
|
|
|
|
|
|
|
|
|
2009 |
|
|
|||||||
|
|
|
|
|
|
|
|
|
|
|
|
|
|
|
|
|
|
|
|
|
|
|
|
|
|
|
|
|
|
|
|
|
|||||||||||||
Customs |
|
|
|
|
|
|
|
|
|
|
|
|
|
|
|
|
29,5% |
|
|
|
|
|
|
|
|
|
|
|
|
|
|
||||||||||||||
|
|
|
|
|
|
|
|
|
|
|
|
|
|
|
|
|
|
|
36,1% |
|
|
|
|
|
|
|
|
|
|
|
2011 |
|
|
||||||||||||
|
|
|
|
|
|
|
|
|
|
|
|
|
|
|
|
|
|
|
|
|
|
|
|
|
|
|
|
|
|
|
|
|
|||||||||||||
Land privatization and ownership |
|
|
|
|
|
|
|
|
|
|
|
24,9% |
|
|
|
|
|
|
|
|
|
|
|
|
|
|
|
|
|
|
|||||||||||||||
|
|
|
|
|
|
|
|
|
|
|
|
|
|
|
|
|
|
|
|
|
|
|
|
|
|
|
|
|
|
|
|||||||||||||||
|
|
|
|
|
|
|
25,3% |
|
|
|
|
|
|
|
|
|
|
|
|
|
|
|
|
|
|
|
|
|
|
|
|
||||||||||||||
Militzia (without DAI) |
|
|
|
|
|
|
|
|
|
|
|
|
|
|
|
|
|
32,0% |
|
|
|
42,8% |
|
|
|
|
|
|
|
|
|
|
|
||||||||||||
|
|
|
|
|
|
|
|
|
|
|
|
|
|
|
|
|
|
|
|
|
|
|
|
|
|
|
|
|
|
|
|
|
|
|
|
|
|
||||||||
|
|
|
|
|
|
|
|
|
|
|
|
|
|
|
|
|
|
|
|
|
|
|
|
|
|
|
|
|
|
|
|
|
|
|
|
|
|
|
|
|
|
||||
|
|
|
|
|
|
|
|
|
|
|
|
|
|
|
|
|
|
|
|
|
|
|
|
|
|
|
46,1% |
|
|
|
|
|
|
|
|
|
|
||||||||
|
|
|
|
|
|
|
|
|
|
|
|
|
|
|
|
|
|
|
|
|
|
|
|
|
|
|
|
|
|
|
|
|
|
53,1% |
|
|
|
|
|
|
|
||||
Government permits |
|
|
|
|
|
|
|
|
|
|
|
|
|
|
|
|
|
|
|
36,0% |
|
|
|
|
|
|
|
|
|
|
|
|
|
|
|||||||||||
|
|
|
|
|
|
|
|
|
|
|
|
|
|
|
|
|
|
|
|
|
|
|
|
|
|
|
|
|
|
|
|
|
|||||||||||||
|
|
|
|
|
|
|
|
|
|
|
|
|
|
|
|
|
|
|
|
|
|
|
40,1% |
|
|
|
|
|
|
|
|
|
|
|
|
||||||||||
|
|
|
|
|
|
|
|
|
|
|
|
|
|
|
|
|
|
|
|
|
|
|
|
|
|
|
|
|
|
|
47,1% |
|
|
|
|
|
|
|
|
|
|
||||
Tax authorities |
|
|
|
|
|
24,1% |
|
|
|
|
|
|
|
|
|
|
|
|
|
|
|
|
|
|
|
|
|
|
|
|
|||||||||||||||
|
|
|
|
|
|
|
|
|
|
|
|
|
|
|
|
|
|
|
|
|
|
|
|
|
|
|
|
|
|
|
|||||||||||||||
|
|
|
|
19,6% |
|
28,7% |
|
|
|
|
|
|
|
|
|
|
|
|
|
|
|
|
|
|
|
|
|
||||||||||||||||||
|
|
|
|
|
|
|
|
|
|
|
|
|
|
|
|
|
|
|
|
|
|
|
|
|
|||||||||||||||||||||
Register and privatize real estate |
|
|
|
|
|
|
|
|
24,4% |
|
|
|
|
|
|
|
|
|
|
|
|
|
|
|
|
|
|
|
|
|
|
|
|
||||||||||||
|
|
|
|
|
|
|
|
|
|
|
|
|
|
|
|
|
|
|
|
|
|
|
|
|
|
|
|
|
|
|
|
|
|
||||||||||||
|
|
|
|
|
|
22,6% |
32,2% |
|
|
|
|
|
|
|
|
|
|
|
|
|
|
|
|
||||||||||||||||||||||
|
|
|
|
|
|
|
|
|
|
|
|
|
|
|
|
|
|
|
|
|
|
|
|
|
|
|
|
|
|
|
|
|
|
||||||||||||
|
|
|
|
|
|
|
|
|
|
|
|
|
|
|
|
|
|
|
|
|
|
|
|
|
|
|
|
|
|
|
|
|
|
|
|
|
|
|
|
|
|
|
|
|
|
Question: Have you or members of your family been extorted a bribe (payment, gratuity, protection, service)?
5.CITIZENS’EXPERIENCES WITH CORRUPTION
29
All MS World ENG.indd 29 |
09.08.2011 23:29:36 |
5.CITIZENS’EXPERIENCES WITH CORRUPTION
30
It is important to remember that it takes two to generate corruption. Citizens can offer bribes if they help them resolve their personal matters. The share of those who offered voluntary bribes decreased by an average of 2 percentage points since 2009 (from 42.6% to 40.6%). In Chart 5.4, the sectors are also sorted by changes in experiences with voluntary bribery (from the highest decrease to the highest increase).
Chart 5.4
Bribes Given Voluntarily
(percent of respondents who had contacted respective state institutions)
|
|
|
|
|
|
|
|
18,1% |
|
|
|
|
|
|
|
|
|
|
|
|
|
|
||||||||||||||||||||
|
|
|
|
|
|
|
|
|
|
|
|
|
|
|
|
|
|
|
|
|
|
|||||||||||||||||||||
Customs |
|
|
|
|
|
|
|
|
|
|
|
16,6% |
|
|
|
|
|
|
|
|
|
|
|
|
|
|
|
|||||||||||||||
|
|
|
|
|
|
|
10,7% |
|
|
|
|
|
|
|
|
|
|
|
|
|
|
|
|
|
|
|||||||||||||||||
|
|
|
|
|
|
|
|
|
|
|
|
21,8% |
|
|
|
|
|
|
|
|
|
|
|
|
||||||||||||||||||
|
|
|
|
|
|
|
|
|
|
|
|
|
|
|
|
|
|
|
|
|
|
|
|
|
|
|
|
|
|
|
|
|
|
|
|
|
|
|||||
Business regulation and inspection |
|
|
|
|
|
|
|
|
|
|
|
|
|
|
|
|
|
|
19,9% |
|
|
|
|
|
|
|
|
|
|
|
|
|
||||||||||
|
|
|
|
|
|
|
|
|
|
|
|
|
14,5% |
|
|
|
|
|
|
|
|
|
|
|
|
|
|
|
||||||||||||||
|
|
|
|
14,9% |
|
|
|
|
|
|
|
|
|
|
|
|
|
|
|
|||||||||||||||||||||||
|
|
|
|
|
|
|
|
|
|
|
|
|
|
|
|
|
|
|
|
|
|
|
|
|
|
|
|
|||||||||||||||
Utilities installed and repaired |
|
|
|
|
|
11,1% |
|
|
|
|
|
|
|
|
|
|
|
|
|
|
|
|
|
|
||||||||||||||||||
|
|
|
|
|
7,5% |
|
|
|
|
|
|
|
|
|
|
|
|
|
|
|
|
|
|
|
|
|
|
|
|
|
|
|
||||||||||
|
|
|
9,9% |
|
|
|
|
|
|
|
|
|
|
|
|
|
|
|
|
|
|
|
|
|
|
|||||||||||||||||
|
|
|
|
|
|
|
|
|
|
|
|
|
|
|
|
|
|
|
|
|
|
|
|
|
|
|
|
|
|
|
|
|
||||||||||
Prosecutors’ o ce |
|
|
|
|
|
10,0% |
|
|
|
|
|
|
|
|
|
|
|
|
|
|
|
|
|
|
|
|
||||||||||||||||
|
|
|
|
|
6,9% |
|
|
|
|
|
|
|
|
|
|
|
|
|
|
|
|
|
|
|
|
|
|
|
|
|
|
|
|
|||||||||
|
|
|
4,3% |
|
|
|
|
|
|
|
|
|
|
|
|
|
|
|
|
|
|
|
|
|
|
|
|
|
|
|
|
|
|
|
||||||||
|
|
|
|
|
|
|
|
|
|
|
|
|
|
|
|
|
|
|
|
|
|
|
|
|
|
|
|
|
|
|
|
|
|
|
|
|||||||
Applyingforloanfromstateinstitution |
|
|
|
5,3% |
|
|
|
|
|
|
|
|
|
|
|
|
|
|
|
|
|
|
|
|
|
|
|
|
|
|
|
|
|
|||||||||
|
|
2,2% |
|
|
|
|
|
|
|
|
|
|
|
|
|
|
|
|
|
|
|
|
|
|
|
|
|
|
|
|
|
|
|
|
|
|
||||||
|
|
|
|
|
|
|
|
|
|
|
|
|
|
|
|
|
|
|
|
|
|
|
|
|
|
|
|
|
|
|
|
|
|
36,5% |
|
|
|
|
|
|
||
|
|
|
|
|
|
|
|
|
|
|
|
|
|
|
|
|
|
|
|
|
|
|
|
|
|
|
|
|
|
|
|
|
|
|
|
|
|
|
|
|||
Healthcare |
|
|
|
|
|
|
|
|
|
|
|
|
|
|
|
|
|
|
|
|
|
|
|
|
|
|
|
|
|
|
|
|
|
|
38,6% |
|
|
|
|
|
||
|
|
|
|
|
|
|
|
|
|
|
|
|
|
|
|
|
|
|
|
|
|
|
|
|
|
|
|
|
|
|
|
|
|
36,4% |
|
|
|
|
|
|
|
|
Schools |
|
|
|
|
|
|
|
|
|
|
|
|
|
|
|
|
|
|
|
|
|
|
|
|
|
|
|
|
|
|
|
|
|
|
|
|
|
|
60,8% |
|
|
|
|
|
|
|
|
|
|
|
|
|
|
|
|
|
|
|
|
|
|
|
|
|
|
|
|
|
|
|
|
|
|
|
|
|
|
|
|
|
|||||
|
|
|
|
|
|
|
|
|
|
|
|
|
|
|
|
|
|
|
|
|
|
|
|
|
|
|
|
|
|
|
|
|
|
|
|
|
|
|
63,8% |
|
|
|
|
|
|
|
|
|
|
|
|
|
|
|
|
|
|
|
|
|
|
|
|
|
|
|
|
|
|
|
|
|
|
|
|
|
|
|
|
|
|
61,6% |
|
|
|
|
|
|
|
|
|
|
|
|
|
|
|
|
|
|
|
|
|
|
|
|
|
|
|
|
|
|
|
|
|
|
29,0% |
|
|
|
|
|
|
|
|
|||
|
|
|
|
|
|
|
|
|
|
|
|
|
|
|
|
|
|
|
|
|
|
|
|
|
|
|
|
|
|
|
|
|
|
|
|
|
|
|
||||
Universities |
|
|
|
|
|
|
|
|
|
|
|
|
|
|
|
|
|
|
|
|
|
|
|
|
|
|
|
|
27,3% |
|
|
|
|
|
|
|
|
|
|
|||
|
|
|
|
|
|
|
|
|
|
|
|
|
|
|
|
|
|
|
|
|
|
|
|
|
25,5% |
|
|
|
|
|
|
|
|
|
|
|||||||
Militzia (without DAI) |
|
|
|
|
|
|
|
|
|
|
|
|
|
|
21,7% |
|
|
|
|
|
|
|
|
|
|
|
|
|||||||||||||||
|
|
|
|
|
|
|
|
|
|
|
|
|
|
|
|
|
|
|
|
|
|
|
|
|
|
|||||||||||||||||
|
|
|
|
|
|
|
|
|
|
|
|
|
|
|
|
|
|
|
|
|
|
21,7% |
|
|
|
|
|
|
|
|
|
|
|
|
||||||||
|
|
|
|
|
|
|
|
|
|
|
|
|
|
|
|
|
|
|
|
|
|
20,6% |
|
|
|
|
|
|
|
|
|
|
|
|
|
|||||||
|
|
|
|
|
|
|
|
|
|
|
|
|
|
|
|
|
|
|
|
|
|
|
|
|
|
|
|
|
|
|
|
|
35,4% |
|
|
|
|
|
|
|
||
|
|
|
|
|
|
|
|
|
|
|
|
|
|
|
|
|
|
|
|
|
|
|
|
|
|
|
|
|
|
|
|
|
|
|
|
|
|
|||||
State auto inspection (DAI) |
|
|
|
|
|
|
|
|
|
|
|
|
|
|
|
|
|
|
|
|
|
|
|
|
|
|
|
|
|
|
|
31,0% |
|
|
|
|
|
|
|
|||
|
|
|
|
|
|
|
|
|
|
|
|
|
|
|
|
|
|
|
|
|
|
|
|
|
|
|
|
|
|
|
|
30,4% |
|
|
|
|
|
Bribe-giving reduced |
|
|
||
|
|
|
|
|
|
|
|
|
|
|
|
|
|
|
|
|
|
|
|
|
|
|
|
|
|
|
|
|
|
|
|
|||||||||||
|
|
|
|
|
|
|
|
|
|
|
15,3% |
|
|
|
|
|
|
|
|
|
|
|
|
above this line |
|
|
||||||||||||||||
|
|
|
|
|
|
|
|
|
|
|
|
|
|
|
|
|
|
|
|
|
|
|
|
|
|
|
|
|
|
|
|
|||||||||||
Tax authorities |
|
|
|
|
|
|
|
|
|
|
|
|
|
14,2% |
|
|
|
|
|
|
|
|
|
|
|
|
|
|
|
|||||||||||||
|
|
|
|
|
|
|
|
|
|
|
|
|
14,0% |
|
|
|
|
|
|
|
|
|
|
|
|
|
|
|
||||||||||||||
|
|
|
|
|
|
|
|
|
|
|
|
|
|
|
|
|
|
|
|
|
|
|
|
|||||||||||||||||||
|
|
|
|
|
|
|
|
|
|
|
|
|
|
|
|
|
14,4% |
|
|
|
|
|
|
|
|
|
|
|
|
|
|
|
||||||||||
|
|
|
|
|
|
|
|
|
|
|
|
|
|
|
|
|
|
|
|
|
|
|
||||||||||||||||||||
Army draft |
|
|
|
|
|
|
|
|
|
|
|
12,5% |
|
|
|
|
|
|
|
|
|
|
|
|
|
|
|
|
|
|
||||||||||||
|
|
|
|
|
|
|
|
|
|
|
|
12,5% |
|
|
|
|
|
|
|
|
|
|
|
|
|
|
|
|
|
|
||||||||||||
|
|
|
|
6,6% |
|
|
|
|
|
|
|
|
|
|
|
|
|
|
|
|
|
|
|
|
|
|
|
|
|
|
|
|
||||||||||
|
|
|
|
|
|
|
|
|
|
|
|
|
|
|
|
|
|
|
|
|
|
|
|
|
|
|
|
|
|
|
|
|
||||||||||
Unemploymentandothersocialaid |
|
|
3,2% |
|
|
|
|
|
|
|
|
|
|
|
|
|
|
|
|
|
|
|
|
|
|
|
|
|
|
|
|
|
|
|
|
|
||||||
|
|
|
3,9% |
|
|
|
|
|
|
|
|
|
|
|
|
|
|
|
|
|
|
|
|
|
|
|
|
|
|
|
|
|
|
|
|
|||||||
|
|
|
|
|
|
|
|
|
|
|
|
|
|
18,5% |
|
|
|
|
|
|
|
|
|
|
|
|
|
|
||||||||||||||
|
|
|
|
|
|
|
|
|
|
|
|
|
|
|
|
|
|
|
|
|
|
|
|
|
|
|
|
|||||||||||||||
Government permits |
|
|
|
|
|
|
|
|
|
|
|
|
|
|
|
|
14,8% |
|
|
|
|
|
|
|
|
|
|
2007 |
|
|
|
|
||||||||||
|
|
|
|
|
|
|
|
|
|
|
|
|
|
|
|
|
16,1% |
|
|
|
|
|
|
|
|
|
|
|
|
|
|
|||||||||||
State notaries |
|
|
|
|
|
|
11,3% |
|
|
|
|
|
|
|
|
|
|
|
|
|
2009 |
|
|
|
|
|||||||||||||||||
|
|
|
|
|
|
|
|
|
|
|
|
|
|
|
|
|
|
|
|
|
|
|
|
|
|
|
|
|
||||||||||||||
|
|
|
|
|
5,1% |
|
|
|
|
|
|
|
|
|
|
|
|
|
|
|
|
|
|
|||||||||||||||||||
Court system |
|
|
|
|
|
6,7% |
13,7% |
|
|
|
|
|
|
|
|
|
|
|
2011 |
|
|
|
|
|||||||||||||||||||
|
|
|
|
|
|
|
|
|
|
|
|
|
|
|
|
|
|
|
|
|
|
|
|
|
|
|
|
|
||||||||||||||
|
|
|
|
|
|
|
|
|
|
|
|
|
|
|
|
|
|
|
|
|
|
|
|
|
|
|||||||||||||||||
|
|
|
|
8,6% |
|
|
|
|
|
|
|
|
|
|
|
|
|
|
|
|||||||||||||||||||||||
|
|
|
|
|
|
|
|
|
|
10,7% |
|
|
|
|
|
|
|
|
|
|
|
|
|
|
|
|
|
|
||||||||||||||
|
|
|
|
|
|
|
11,9% |
|
|
|
|
|
|
|
|
|
|
|
|
|
|
|
|
|
|
|||||||||||||||||
|
|
|
|
|
|
|
|
|
|
|
|
|
|
|
|
|
|
|
|
|
|
|
|
|
|
|
|
|
||||||||||||||
Register and privatize real estate |
|
|
|
|
8,8% |
|
|
|
|
|
|
|
|
|
|
|
|
|
|
|
|
|
|
|
|
|
|
|
||||||||||||||
|
|
|
|
|
|
|
|
|
|
|
11,6% |
|
|
|
|
|
|
|
|
|
|
|
|
|
|
|
|
|
|
|||||||||||||
Land privatization and ownership |
|
|
|
|
7,0% |
|
|
|
|
|
|
|
|
|
|
|
|
|
|
|
|
|
|
|
|
|
|
|
|
|
|
|
|
|||||||||
|
|
|
|
|
|
|
|
|
|
|
|
|
|
|
|
|
|
|
|
|
|
|
|
|
|
|
|
|
|
|
|
|
|
|
||||||||
|
|
|
|
7,1% |
|
|
|
|
|
|
|
|
|
|
|
|
|
|
|
|
|
|
|
|
|
|
|
|
|
|
|
|
||||||||||
|
|
|
|
|
|
|
|
|
|
9,9% |
|
|
|
|
|
|
|
|
|
|
|
|
|
|
|
|
|
|
|
|
|
|
||||||||||
|
|
|
|
|
|
|
|
|
|
|
|
|
|
|
|
|
|
|
|
|
|
|||||||||||||||||||||
|
|
|
|
|
|
|
|
|
|
|
14,2% |
|
|
|
|
|
|
|
|
|
|
|
|
|
|
|
||||||||||||||||
|
|
|
|
|
|
|
|
|
|
|
|
|
|
|
|
|
|
|
|
|
|
|
|
|
|
|
|
|
|
|||||||||||||
Getting government job |
|
|
|
|
|
|
10,4% |
|
|
|
|
|
|
|
|
|
|
|
|
|
|
|
|
|
|
|
||||||||||||||||
|
|
|
|
|
|
|
|
|
|
|
|
|
|
|
|
|
|
15,3% |
|
|
|
|
|
|
|
|
|
|
|
|
|
|
|
|||||||||
Government subsidized housing |
|
|
|
|
|
|
17,5% |
|
|
|
|
|
|
|
|
|
|
|
|
|
|
|
||||||||||||||||||||
|
|
|
|
|
|
|
|
|
|
|
|
|
|
|
|
|
|
|
|
|
||||||||||||||||||||||
|
|
|
|
|
|
|
|
|
|
|
|
|
|
|
16,0% |
|
|
|
29,5% |
|
|
|
|
|
|
|
|
|||||||||||||||
|
|
|
|
|
|
|
|
|
|
|
|
|
|
|
|
|
|
|
|
|
|
|
|
|
|
|
|
|
|
|
|
|
|
|
|
|
|
|
||||
|
|
|
|
|
|
|
|
|
|
|
|
|
|
|
|
|
|
|
|
|
|
|
|
|
|
|
|
|
|
|
|
|
|
|
|
|
|
|
|
|
|
|
Question: Have you or members of your family voluntarily offered a bribe (payment, gift, protection, services) to obtain
services?
Disregarding the fact that voluntary bribe-giving has overall become less frequent, statistically significant changes for the better were reported in the sector of public utility services (a decrease from 11.1% to 7.5%). Conversely, significant worsening of the situation was reported in such sectors as government subsidized housing (from 16% to 29.5%), getting a government job (from 10.4% to 15.3%), land privatization and ownership (from 7.1% to 9.9%) and registration of real estate (from 8.8% to 11.6%).
Changes in the remaining sectors are not statistically significant.
As earlier, voluntary bribe-giving now happens less often than incidences of extortion, therefore the correlation between the two has changed over the last two years from 1:2 to 1:2.5
.
All MS World ENG.indd 30 |
09.08.2011 23:29:36 |