

бекишева 2 семак / график
.docx
A graph
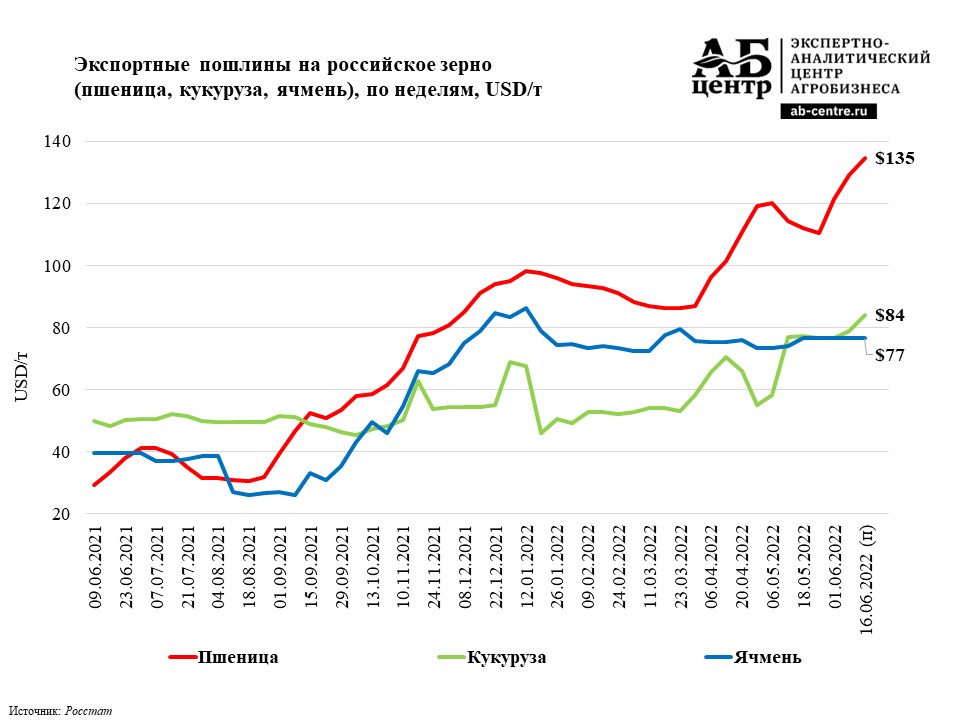
The graph represents data on the export of oil from Russia, including the value, volume, and purchase of oil, as well as the average price per ton per week in USD. A sample of oil exports was surveyed and the average price for each week was plotted on the chart. The x-axis shows the date from September 6, 2021 through September 6th, 2023 and the y-axis represents the price per ton in USD.
Three lines represent different types of oils: "Iskry" (red), Kubura (green) and Yatreba (blue). Iskry's price started at around $40/ton in June 2021 and rose sharply to $135/ton around March 22nd, 23rd, then fluctuated and ended at $125/ton in September 2033. Kubura's price remained relatively stable starting at $60/ton, dipped slightly and ended at 84/ton. Yatreba's price followed a similar trend starting at 45/ton and ending at 77/ton.
Charts are created by plotting points and connecting them with lines. If there were three lines on the chart - for example, Iskry, Kubura and Yatreby - they would probably intersect at some points. Parallel lines never intersect. Charts show how prices change - they rise, fall or stay the same. Prices rise when they increase, fall when they decrease and stay the same when they don't change. Verbs like "rise", "fall", "increase" and "decrease" are used to describe changes in prices. Other verbs like "double", "soar", "multiply", "appreciate" and "exceed" can also be used.
Iskra's price showed a dramatic increase, rising by more than 200 percent from its starting value. Kubur's and Yatreb's prices grew more slowly.