


KTEA™-3 55
administration, you should introduce the subtest with the instructions printed in the stimulus book. After you say “Begin,” immediately begin timing the examinee. After 15 seconds, say “Stop.” Administer the second trial in the same manner as the first. Examiners may find it useful to make a slash on the record form after the last word that the examinee read. If an examinee pauses or hesitates during the task, encourage them to keep going or move onto the next one. As the examinee is reading the words, circle zero for any of the words that are mispronounced or skipped.
HOW TO SCORE THE KTEA-3
The KTEA-3 yields several types of scores: raw scores, standard scores, grade equivalents, age equivalents, and percentile ranks. Raw scores reflect the number of points earned by the examinee on each subtest. These scores, by themselves, are meaningless because they are not norm-based. Converting raw scores to standard scores, which are norm-based, allows the examinee’s performance to be compared to that of others. The KTEA-3 standard scores have a mean of 100 and an SD of 15. The theoretical range of standard scores for the subtests and composites is 40 to 160. An important theoretical assumption is that achievement-test performance is distributed on a normal curve, with the majority of examinees scoring within +/– 1 SD of the mean. Thus, about two-thirds (68%) of students score in the range of 85 to 115. Less than 3% of
111111111
examinees score above 130 or below 70.
Types of Scores
Each type of score in the KTEA-3 is described next.
Raw Scores and Weighted Raw Scores
Subtest raw scores are calculated in a variety of ways.
•For hand scoring, methods for calculating raw scores and weighted raw scores are summarized in Table 2.5.
•Using Q-global, fewer steps are required for calculating raw scores. For subtests that use weighted raw scores, enter the raw scores only. Q-global converts raw scores into weighted raw scores when calculating derived scores, although weighted raw scores are not provided in the score report. Methods for calculating raw scores using Q-global are summarized in Table 2.6.
•Using Q-interactive, raw score calculation is automatic for every subtest once items are scored by the examiner. Refer to Chapter 7 for information about Q-interactive.

56 ESSENTIALS OF KTEA™-3 AND WIAT®-III ASSESSMENT
Table 2.5 Hand-Scoring Methods for Calculating Raw Scores
Subtest |
Method |
Subtest with Basal/Discontinue |
Rules |
Phonological Awareness |
Subtract the number of errors from the ceiling item. |
Letter & Word Recognition |
|
Math Concepts & Applications |
|
Math Computation |
|
Nonsense Word Decoding |
|
Spelling |
|
Reading Vocabulary |
|
Speeded Subtest |
|
Silent Reading Fluency |
Use the scoring keys provided on the flash drive to score |
|
student responses. Subtract the number of incorrect |
|
responses from the number of correct responses. |
Math Fluency |
Use the scoring keys provided on the flash drive to score |
|
student responses. Sum the number of correct responses |
|
within the time limit. |
Object Naming Facility |
Across each trial, sum the completion time (in seconds) |
Letter Naming Facility |
and sum the number of errors. Next, convert total time |
|
and total errors to a raw score. |
Writing Fluency |
Convert the number of words written within the time |
|
limit to a raw score. |
|
111111111 |
Associational Fluency |
Sum correct responses provided within the time limit |
Decoding Fluency |
across items (AF) or trials (DF). |
Subtest with Item Sets |
|
Reading Comprehension |
Sum the number of correct responses for items within |
Listening Comprehension |
the final level/set administered. Next, convert the raw |
Written Expression |
score to a weighted raw score. |
Oral Expression |
Sum the Task and Grammar scores for items within the |
|
final set administered. Next, convert the raw score to a |
|
weighted raw score. |
Word Recognition Fluency |
Sum correct responses provided within the time limit |
|
across trials. Next, convert the raw score to a weighted |
|
raw score. |
When scoring subtests with item sets (i.e., Reading Comprehension, Listening Comprehension, Written Expression, Oral Expression, Word Recognition Fluency), the raw score must be converted to a weighted raw score. This is not a new type of score, although the terminology di ered in the KTEA-II. For most of these subtests in the KTEA-II, the total number of points earned on the subtest (i.e., the raw score in the KTEA-3) was converted to a raw score (i.e., the weighted raw score in the KTEA-3), which was then converted to a derived score (e.g., standard score, growth scale value, etc.).

|
KTEA™-3 57 |
Table 2.6 Methods for Calculating Raw Scores Using Q-global |
|
|
|
Subtest |
Method |
Subtest with Basal/Discontinue |
Rules |
Phonological Awareness |
Subtract the number of errors from the ceiling item. Enter |
Letter & Word Recognition |
this raw score. |
Math Concepts & |
|
Applications |
|
Math Computation |
|
Nonsense Word Decoding |
|
Spelling |
|
Reading Vocabulary |
|
Speeded Subtest |
|
Silent Reading Fluency |
Option 1: Raw score entry. Use the scoring key provided on |
|
the flash drive to score responses. Subtract the number of |
|
incorrect responses from the number of correct responses. |
|
Option 2: Item entry. Enter the student’s (Y, N) responses. |
Math Fluency |
Option 1: Raw score entry. Use the scoring key provided |
|
on the flash drive to score responses. Sum the number of |
|
correct responses within the time limit. |
|
Option 2: Item entry. Enter the student’s numerical |
|
responses. |
Object Naming Facility |
Enter the completion time (in seconds) and number of |
|
111111111 |
Letter Naming Facility |
errors for each trial. |
Writing Fluency |
Enter the number of words written within the time limit. |
Associational Fluency |
Sum correct responses provided within the time limit across |
Decoding Fluency |
items (AF) or trials (DF). |
Subtest with Item Sets |
|
Reading Comprehension |
Select set/level administered. Sum the number of correct |
Listening Comprehension |
responses for items within the final level/set administered. |
Written Expression |
|
Oral Expression |
Select set administered. Sum the Task and Grammar scores |
|
for items within the final set administered. |
Word Recognition Fluency |
Select set administered. Sum correct responses provided |
|
within the time limit across trials. |
Don’t Forget
.....................................................................................................................
How does a raw score differ from a weighted raw score?
A raw score is the number of points earned on the subtest.
A weighted raw score is used only on subtests with item sets to estimate the raw score that would be obtained if the entire subtest (every item set) had
(continued)

58 ESSENTIALS OF KTEA™-3 AND WIAT®-III ASSESSMENT
(Continued)
been administered. Psychometric methods were used to put item sets on a common scale, which enables scores obtained on different item sets to be directly compared.
Are weighted raw scores really weighted?
No. Weights were not applied when norming the weighted raw scores. A more precise term for understanding weighted raw scores would be “adjusted” raw scores. However, it was desirable for the KTEA-3 and WIAT-III to use consistent terminology.
Don’t Forget
.....................................................................................................................
Hand Scoring
Appendix C from the KTEA-3 Technical & Interpretive Manual contains all the tables needed for score conversions. Use the hyperlinks in the Table of Contents or the search function (e.g., Ctrl+F on PC or Command+F on Mac) to go directly to Appendix C.
Two types of conversion tables are provided:22222222111111111 Raw score lookup tables and tables for converting raw scores to weighted raw scores.
Raw Score Lookup tables are used to obtain raw scores for the following subtests:
Writing Fluency, Object Naming Facility, and Letter Naming Facility. Convert the number of words written, for Writing Fluency, and the completion time and number of errors, for ONF and LNF, to the subtest raw score. These raw score conversion tables do not differ by form (A or B) because performance across forms is so similar.
Tables are used to convert raw scores to weighted raw scores for the following subtests: Reading Comprehension, Listening Comprehension, Written Expression, Oral Expression, Word Recognition Fluency. Each of these tables includes separate columns for converting scores from Form A or Form B.
Q-global Scoring
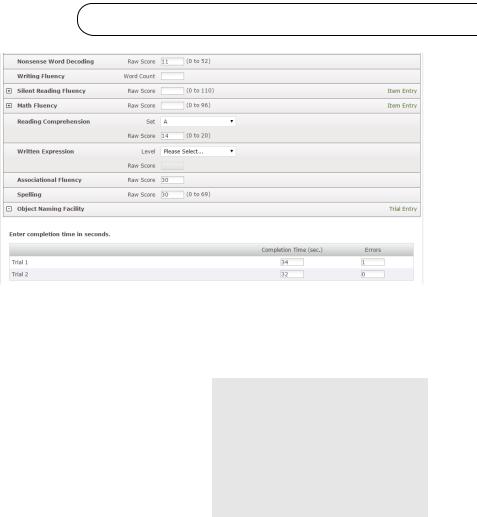
No score conversions or raw score look-ups are necessary when using Q-global. Enter raw scores, not weighted raw scores, for subtests with item sets. For subtests that convert raw data (i.e., completion time, number of errors, and number of words) to a raw score, simply enter the raw data. For Writing Fluency, enter the number of words written. For Object Naming Facility and Letter Naming Facility, enter the total completion time and total number of errors (summed across trials). Raw scores will calculate automatically for these three subtests. Figure 2.4 shows Q-global Raw
Score Entry.
KTEA™-3 59
Figure 2.4 Q-global Raw Score Entry
Source: Kaufman Test of Educational Achievement–Third Edition (KTEA-3). Copyright © 2014 NCS Pearson, Inc. Reproduced with permission. All rights reserved.
Standard Scores |
111111111 |
To be meaningfully interpreted, the raw scores or weighted raw scores of the KTEA-3 must be converted to standard scores. When converting from raw to standard scores, you must first decide whether to use age-based or grade-based norms. For examinees who have graduated high school, only age norms are provided. For all other examinees, the
decision to use age or grade norms depends on whether you want to compare the student’s test performance with that of same-age peers or same-grade peers. In most cases, the resulting standard scores will be similar. However, important di erences can occur if the student has been retained or has received an accelerated grade placement, or if the student began school earlier or later in the year than is typical. In these cases, the grade-based norms are probably more relevant. However, if you plan to compare performance on the KTEA-3 with performance on an ability measure such as the KABC-II or a language measure such as the CELF-5 (Clinical Evaluation of Language Fundamentals, Fifth Edition; Wiig, Semel, & Secord, 2013), always use

60 ESSENTIALS OF KTEA™-3 AND WIAT®-III ASSESSMENT
age-based norms because they are the basis for the standard scores on ability and language measures. The Caution and Don’t Forget boxes provide further information about selecting and reporting age-based and grade-based standard scores.
Don’t Forget
.....................................................................................................................
Grade Norms versus Age Norms
Question: I recently administered the KTEA-3 to a child age 8:11 who just completed third grade. I looked up her standard scores according to age norms (as is typically my practice), but then, out of curiosity, I also looked up her scores according to grade norms. The scores were quite different in some cases (e.g., both Reading Comprehension and Math Computation were 9 points lower when calculated according to the grade norms). Could you tell me why age and grade norms may yield different scores and give me your opinion about when each type of norm is most useful?
Answer: The explanation of the difference is pretty simple. Most children in the United States start kindergarten when they are 5 years old and start grade 3 when they are 8 years old. Therefore, virtually all children aged 8:11 are in grade 3. Children turn 8:11 at a steady rate throughout the grade 3 school year—about half of
22222222111111111
the students turn 8:11 in the fall, and about half in the spring. Thus, the norm sample for age 8:11 contains students from the beginning through the end of grade 3. This age norm sample performs lower, as a group, than the grade norm sample for the spring of grade 3.
Thus, for a student who turns 8:11 in the spring, the age norms will give higher standard scores than the grade norms. The reverse is true for a student who turns 8:11 in the fall. (The direction of the difference by time of year can’t be generalized: It depends on what the “month” of age is. For a student aged 8:3 in the fall, age-based scores are higher than grade-based scores, because some students who turn 8:3 in the fall are in grade 2.)
In principle, there is no good, practical solution for taking curriculum exposure into account in age norms, and all of the achievement batteries have this problem. The ideal might be to have age-by-grade norm tables (e.g., age 8:6 in the fall of grade 3, age 8:6 in the spring of grade 3, age 8:6 in the spring of grade 2), but that is too complex. Simply subdividing age norms into fall and spring is flawed because at most “months” of age a student could be in either of two grades, which would be an even greater distortion for some students.
The bottom line is that the situation is complicated—the deeper you look into it, the messier it becomes. In these days when grade retention is rare, there might
(continued)

KTEA™-3 61
(Continued)
be a good argument to be made for using grade norms rather than age norms for clinical evaluations. The concern used to be that grade norms would make a student who had repeated a grade or two look “too good.” These days, there would seem to be a better argument that age norms are problematic because they mix students with different amounts of curriculum exposure. However, examiners must follow requirements set forth by their state and school district based on IDEA. For some that will mean using age norms for special-ed classification and for others that will require using grade norms. Examiners should just be aware that occasionally differences do occur between them.
Using Q-global, selection of age or grade norms is simple. One of the report options is to select Norm Group: Age or Grade. The specific age or grade norm will be determined automatically based on the demographic/testing information you provided. If age is selected, the student’s chronological age will be calculated based on the date of birth and date of testing previously entered in order to determine which age norm to use. If grade is selected, Q-global will use the date of testing to determine which semester (Fall, Winter, Spring) grade norm to use.
For hand scoring, you must determine the specific age or grade norm table to use.
111111111
If testing occurred over multiple sessions, use the first test date to determine which age or grade norm to use. If using age norms, calculate the student’s chronological age using the space provided on the cover of the record form. Disregard the number of days in the student’s age. Age norms are based on years and months. If using grade norms, you must select from one of three norm groups: Fall (indicating that a student was assessed in August through November), Winter (indicating that a student was assessed in December through February), or Spring (indicating that a student was assessed in March through July). The cover of the record form has a box you can check to indicate whether the student is currently in the Fall, Winter, or Spring semester, and the corresponding months are provided next to each box for ease of reference.
In addition to separating each of the grade norms into Fall, Winter, and Spring, the KTEA-3 Technical & Interpretive Manual also has two columns for each subtest: one for Form A and one for Form B. Carefully select the correct column and the correct page of the norms book when you are determining the standard scores. The Don’t Forget box reminds examiners about which tables to use to find various standard scores.
Because scores have error associated with them, it is wise to report standard scores with a band of error or within a confidence interval. The KTEA-3 allows you to choose 85%, 90%, or 95% confidence levels.

62 ESSENTIALS OF KTEA™-3 AND WIAT®-III ASSESSMENT
Don’t Forget
.....................................................................................................................
Age Norm Bands
Age norms are provided in 3-month intervals for ages 4 and 5, 4-month intervals
for ages 6 through 13, 1-year intervals for ages 14 through 16, and 2-year intervals for ages 17 through 20. Norms for ages 21 through 25 were combined into one 5-year interval. Norms with shorter time intervals are used for younger children because learning progresses very rapidly at these ages. As a result, each month of development or schooling greatly impacts achievement levels. On average, the academic skills of students who just turned 5, for example, are considerably less developed than those of students who are 5 and a half. The rate of learning becomes less steep with age, so the time interval of the norms is increasingly lengthened.
Age |
4–5 |
6–13 |
14–16 |
17–20 |
21–25 |
Norm Band |
3 months |
4 months |
1 year |
2 years |
5 years |
Number of Age Norm Groups |
8 |
16 |
3 |
2 |
1 |
|
|
|
|
|
|
Don’t22222222Forget111111111
.....................................................................................................................
Tips for Navigating the Digital Technical & Interpretive Manual
Use the hypertext (text with hyperlinks). All of the text included in the Quick Links and Table of Contents pages at the front of the manual contain hyperlinks, which means you can click a line of text with your cursor and the document will immediately advance to the page that includes the selected content. These hyperlinks are the fastest way to find a specific chapter, section, table, or figure. For example, in the following image, clicking “Table 1.2” will advance the document to page 24.
List of Tables |
|
|
Table 1.1 |
Representation of the Grade Norm Sample by Sex ................................................ |
23 |
Table 1.2 |
Representation of the Age Norm Sample by Sex .................................................... |
24 |
Use the navigation bar. In the KTEA-3 Brief Technical & Interpretive Manual, three navigation buttons appear at the bottom of every page: a left arrow, a home button, and a right arrow. Clicking the left or right arrow will move the document one page down or up, respectively. Clicking the home button will display the Quick Links page at the front of the manual. The navigation bar is designed to help the reader move through the manual quickly and efficiently.
(continued)

KTEA™-3 63
(Continued)
Use the search function. All PDF readers include a search function that is enabled by typing Ctrl+F (the Ctrl key and the F key at the same time on a PC or Command+F on a Mac). This box allows you to search for a word or phrase that appears anywhere in the manual. This is the best way to find specific content that may not be called out in the Table of Contents. For example, in the following image, searching “DSM-5” and then selecting “Next” or the left or right arrow will show each instance that the DSM-5 is referenced in the manual.
Select a row of numbers. When reading data tables on screen, some people find it difficult to visually track across a row of 22222222numbers111111111 without losing their place. One helpful tip is to select the row of numbers with your mouse to highlight the data on screen.
Enlarge the font. Remember that you can zoom in and out by clicking the plus or minus sign at the top of the navigational menu, making the size of the font bigger or smaller, when viewing the digital manual. You can also enlarge the font (zoom in) by selecting a larger percentage in the size box. Zoom in with keyboard shortcuts on a PC by using the Ctrl+equal sign (for Mac use Command+equal sign) and zoom out using Ctrl+hyphen on a PC or Command+hyphen on a Mac.
Rotate the page. Some PDF readers will automatically rotate the page to a portrait or landscape orientation, as needed. However, you can do this manually as well by typing the following three keys at the same time: Shift, Ctrl, +.
Print. You have the option to print the pages or tables in the digital manual that you use most frequently.
Additional keyboard shortcuts. Adobe Acrobat provides additional help on their keyboard shortcuts online at helpx.adobe.com/acrobat/using/keyboard-shortcuts
.html.
Grade and Age Equivalents
Grade and age equivalents may be found in Tables F.4 and F.5, respectively, in the
KTEA-3 Technical & Interpretive Manual. However, we recommend that they be reported with caution, as they are frequently misunderstood. They are not precise
64 ESSENTIALS OF KTEA™-3 AND WIAT®-III ASSESSMENT
like standard scores or percentile ranks and often suggest large di erences in performance, when the di erences are insignificant. On Math Concepts & Applications, for example, a raw score of 68 yields an age equivalent of 13.10, yet a raw score of 71 (just three points higher) corresponds to an age equivalent of 15.10. Using these same raw scores, an examinee age 15 would earn age-based standard scores of 96 (for a raw score of 68) and 101 (for a raw score of 71). Thus, when comparing scores based on the same raw scores, a 4-point standard score di erence appears much smaller than the 2-year di erence in age-equivalents. Consider also that both standard scores are well within the average range, so the age equivalent of 13.10 should not be interpreted as indicating underachievement or a skill deficit.
Grade and age equivalents correspond to the average raw score obtained by students at a particular grade or age level on a particular subtest. Grade and age equivalents do not indicate the curriculum or developmental level at which the student is functioning, nor do they indicate how much progress a student has made over time (if comparing scores across two administrations). On Phonological Processing, for example, a raw score of 40 corresponds to a grade equivalent of 7.0. If obtained by a student in the Fall of grade 5, these results might seem quite impressive at first glance. Is this fifth grader’s phonological processing skills at a 7th grade level, 2 years more advanced than most fifth graders? Always refer to a standard score for this level of information. In this case, the student’s grade-based standard score of 102 (95–109 with 90% confidence) is within the average111111111 range. So what then does the grade equivalent of 7.0 tell us? Two things: (1) the average student in grade 7.0 (the first month of grade 7) obtained the same raw score as our fifth grade student, and (2) phonological processing has a ceiling e ect–the highest possible standard score is only 135 at grade 5. This ceiling e ect is expected because the development of phonological processing skills naturally plateaus after the early elementary years.
More than anything else, age and grade equivalents are influenced by the content (the specific items and skills) of the particular subtest and the degree to which that content di erentiates students at di erent grade levels. The slope of typical skill development will influence how well the KTEA-3 or any other test will be able to di erentiate students at di erent age or grade levels. Age and grade equivalents are most informative for describing the norms of a test and the average performance of students across ages and grades; they are least
informative (and often misleading) when used to describe an individual’s achievement level or skill proficiency.

KTEA™-3 65
C A U T I O N
........................................................................................................
Be careful when interpreting age equivalents and grade equivalents. Using age or grade equivalents to qualify a student for services, make educational placement decisions, select curricular or instructional materials, and/or describe the developmental level at which a student is functioning is considered a misuse of these scores.
Age/grade equivalents are not standard scores. Rather, equivalents indicate the average raw score obtained by students at a particular grade or age level on a particular subtest.
Percentile Ranks
Percentile ranks are an excellent metric to communicate results to parents, teachers, and other nonpsychologists. They are often readily understood and interpreted. Regardless of whether age-based or grade-based standard scores are used, the percentile rank has the same meaning: It is the percentage of individuals that the examinee outperformed at his or her age (age norms) or grade level (grade norms). For example, a 12-year-old who scored at the 75th percentile on Nonsense Word Decoding performed better than 75% of 12-year-olds on that subtest. A first grader who scored at the 5th percentile on Phonological111111111 Awareness scored better than only 5% of first graders. Use caution when explaining percentile ranks to parents to avoid confusion with percent correct, and remember that percentile ranks are not equal interval (see Caution box).
Each standard score can be converted to a percentile rank by using Table F.3 of the
KTEA-3 Technical & Interpretive Manual or Table F.9 in the KTEA-3 Brief Technical & Interpretive Manual.
C A U T I O N
........................................................................................................
Percentile Ranks Are Not Percent Correct
Clearly communicate to parents that a percentile rank is the percent of children that an examinee scored better than. A percentile rank is not the percentage of items answered correctly.
Percentile Ranks Are Not Equal Interval
Percentile ranks differentiate performance better in the middle of the distribution, but provide less differentiation toward the extreme ends of the distribution. For this reason, percentile ranks cannot be manipulated statistically to measure progress over time (never add, subtract, multiply, divide, or average them).

66 ESSENTIALS OF KTEA™-3 AND WIAT®-III ASSESSMENT
Descriptive Categories
Rapid Reference 2.5 presents the 10-point and 15-point classification systems that the test authors suggested for reporting KTEA-3 subtests and composites. Both systems divide the theoretical standard score range of 40 to 160 into seven categories, but one
uses 10-point ranges and the other uses 15-point ranges. The suggested qualitative descriptors, which are the same across both classification systems, are intended to reflect in words the approximate distance of each range of scores from the group mean—a verbal translation of the normal curve. The classification systems and qualitative descriptors suggested in the KTEA-3 di er from those in the previous KTEA editions and those provided in the WIAT-III. Currently there is little consistency in the descriptive categories used across clinical assessments.
The KTEA-3 is the first clinical assessment, to our knowledge, to o er a choice between the two most commonly used classification systems. Providing a choice was intended to encourage flexibility and thoughtful consideration in the use of descriptive categories and to promote greater consistency in reporting results across similar instruments. Your decision to use the 15-point or the 10-point classification system and the qualitative descriptors111111111 you choose may be influenced by the examinee’s score profile, the other tests you’ve administered, personal preference, and reporting requirements you’ve been given by outside agencies, among other things. When reporting similar standard scores across di erent instruments, consider using the classification system suggested by the cognitive measure. When reporting results from the KTEA-3 and the KABC-II, for example, it would be reasonable to use the 15-point scale described in the KABC-II manual to describe standard scores across both tests. However, when reporting results from the KTEA-3, WIAT-III, and WISC-V, for example, you might consider using the 10-point scale and qualitative descriptors described in the WISC-V manual to describe standard scores across all three tests.
When selecting qualitative descriptors, there is an increasing preference to avoid value-laden terms such as superior as well as vague or confusing terms such as borderline. Use of the term borderline, in particular, is not appropriate for describing low achievement scores. Whenever possible, use neutral terms that simply describe the score’s distance from the mean (such as low, average, high).
The 10-point and 15-point classification systems each have advantages and disadvantages. An advantage of the 15-point system is that it provides more di erentiation at the highest and lowest ends of the distribution. For this reason, some people prefer the 15-point scale for reporting very high or low scores. On the other hand,

KTEA™-3 67
the 10-point system provides more di erentiation within the middle of the distribution. The 10-point system defines the average range more narrowly as 90 to 109, which includes 50% of the sample, as compared to the 15-point system’s average range of 85 to 115, which includes 68% of the sample. A student who obtains a standard score of 85 scored better than only 16% of his or her peers, and some would argue that the 16th percentile seems too low to be considered average. However, one concern with 10-point categories is that, when confidence intervals are used to provide a reasonable band of error, it is common for the confidence interval to span three different categories. Such a broad span of ability levels can be confusing when explaining an examinee’s test performance to a parent, for example.
Don’t Forget
.....................................................................................................................
Avoid overwhelming readers of a case report by providing descriptive categories for each standard score. These labels serve best when they either summarize an individual’s performance on all scales via a composite score or highlight significant discrepancies among the scales. Generally, the use of descriptive labels with subtests should be reserved for standard scores that are significantly above or below the examinee’s own mean values or for standard scores that are high or low relative to
other examinees of the same age.
22222222111111111
Don’t Forget
.....................................................................................................................
Descriptive Category Systems
10-Point System
Range of Standard Scores |
Name of Category |
Percent of the Sample |
130–160 |
Very high |
2.2% |
120–129 |
High |
6.7% |
110–119 |
Above average |
16.1% |
90–109 |
Average range |
50% |
80–89 |
Below average |
16.1% |
70–79 |
Low |
6.7% |
40–69 |
Very low |
2.2% |
Provides more di erentiation in the middle of the distribution
(continued)
68 ESSENTIALS OF KTEA™-3 AND WIAT®-III ASSESSMENT
(Continued)
15-Point System
Range of Standard |
|
|
|
Scores |
Name of Category |
Percent of the Sample |
SDs from Mean |
|
|
|
|
146–160 |
Very high |
0.13% |
+3 to +4 |
131–145 |
High |
2.14% |
+2 to +3 |
116–130 |
Above average |
13.59% |
+1 to +2 |
85–115 |
Average range |
68.26% |
−1 to +1 |
70–84 |
Below average |
13.59% |
−1 to −2 |
55–69 |
Low |
2.14% |
−2 to −2 |
40–54 |
Very low |
0.13% |
−3 to −4 |
Provides more di erentiation at the extremes of the distribution
Growth Scale Values
Growth Scale Values (GSVs) are designed for measuring change and are based on the Item Response Theory (IRT) ability scale. In the same way that “inches” are an equal-interval scale of length, the GSV scale is an equal-interval scale of academic skill. Thus, GSVs can be used as a “yardstick” by which academic progress can be
111111111
measured throughout the school years. GSVs reflect absolute performance rather than performance relative to a normative sample; however, the examinee’s rate of progress may be compared to the typical growth rate in the normative sample using the GSV Chart Score Report in Q-global.
Key advantages of GSVs include the following:
•Sensitive to small increases and decreases in academic progress over time (see Don’t Forget box).
•Allow direct comparison of GSVs obtained on alternate forms of a subtest. GSVs obtained from the Brief Form/Comprehensive Form B and Comprehensive Form A may be compared over time.
Limitations of GSVs include the following:
•The degree to which GSVs are able to measure academic learning is limited to the content and skill coverage of the subtest. The KTEA-3 is not designed to measure all aspects of a student’s curriculum or provide in-depth coverage of all skill categories. Consider curriculum-based or criterion-referenced measures for more comprehensive content and skill coverage.
Example: the LWR subtest includes items for naming consonant letter sounds, but only for a subset of consonant letters. To track a child’s progress naming all consonant letters or letter sounds, consider administering the Letter Checklist (provided on the KTEA-3 flash drive) at regular intervals.

KTEA™-3 69
Don’t Forget
.....................................................................................................................
Interpreting Growth Scale Values
For each KTEA-3 subtest, GSVs from one form may be directly compared with GSVs from the other form for measuring growth.
Unlike standard scores, GSVs will reflect even small amounts of academic improvement over time. If an examinee’s skills are improving at a “typical” rate, the standard score will appear relatively unchanged over time but comparing the GSVs will indicate growth.
|
|
|
|
|
|
|
|
GSV shows |
|
||
|
|
|
|
|
|
|
|
growth |
|
||
|
|
Age |
Raw |
|
GSV |
|
Standard |
|
|
|
|
|
|
|
Score |
|
|
|
|
Score |
|
|
|
|
|
|
|
|
|
|
|
|
|
|
|
|
|
8:0 |
26 |
|
155 |
|
80 |
|
|
|
|
|
|
|
|
|
|
|
|
|
|
|
|
Over |
|
|
|
|
|
|
|
|
|
|
|
|
8:4 |
29 |
|
163 |
|
80 |
|
SS is |
|||
the |
|
|
|
|
|
|
|
|
|
the |
|
course |
|
|
|
|
|
|
|
|
|
same |
|
8:8 |
33 |
|
174 |
|
80 |
||||||
of one |
|
|
|
|
|
|
|||||
year |
|
|
|
|
|
|
|
|
|
|
|
|
|
9:0 |
36 |
|
182 |
|
80 |
|
|
|
|
|
|
|
22222222 |
|
|
|
|
|
|
|
|
|
|
|
111111111 |
|
|
|
|
|
|
|
|
|
|
|
|
|
|
|
|
|
|
|
|
Stanines
Stanines (standard nines) provide a scale ranging from 1 to 9 with a mean of 5:
•Stanines 1, 2, and 3 represent the lowest 23% of the distribution of scores.
•Stanines 4, 5, and 6 represent the middle 54% of the distribution of scores, which some consider the average range.
•Stanines 7, 8, and 9 represent the highest 23% of test scores.
A stanine is not a single score. Similar to quartiles and deciles, each stanine represents a band of scores. Only stanines 2 through 8 span equal distances, each extending 0.5 standard deviation units. Stanines 1 and 9 extend through the tails of the distribution, including the lowest and highest 4% of scores, respectively. Stanines o er limited precision for describing an individual’s performance and are not well suited for measuring change over time. Stanines are best suited to describing the performance of groups of students, such as categorizing schools or classrooms. Consider reporting stanines when exact scores are less important than identifying groups of students with similar performance.
Normal Curve Equivalents
Normal curve equivalents (NCEs) were developed for the United States Department of Education by the RMC Research Corporation with program evaluation in mind