

identified the following areas where alignment between engineering and procurement personnel is essential
to project success:
•Identifying critical scope that needs to be procured early in order to work with the supplier or subcontractor in their design that will have downstream affects
•Finding solutions to sourcing more domestic materials and scope instead of looking internationally, in order to cut down on logistics and supply issues, while also being aware of
the overall cost impact to the project.
Vendor Quality Management
Off-site supplier quality (OSSQ) assists the procurement team in achieving technical compliance of engineered equipment, pipe, and bulk materials with the quality requirements of the prime contract, technical specifications, industry and code standards. OSSQ monitors and enforces supplier compliance with QA/QC requirements through shop visits for the purposes of inspection, testing, examination, performance testing, expediting or to obtain seller production status.
Long-Lead Procurement
Long-lead items are procured during detailed design. Table 9 lists the long lead items that have been identified at this time; however, this list is preliminary.
Table 9. Identified OSBL Long Lead Items
Critical Procurement Item |
Delivery Lead Time |
Flue Gas Duct Work |
56 Weeks |
Auxiliary Boiler |
76 Weeks |
Switchgear and Enclosures |
64 Weeks |
Station Service Transformers |
70 Weeks |
ENGINEERING DESIGN PACKAGES
Process Engineering
The CO2 capture system will have capacity to treat 100% of the flue gas generated by Unit 2, as well as the flue gas from the auxiliary boilers supplying steam for the CO2 capture facility but will also have the capability to treat only a part of the plant’s or auxiliary boilers’ flue gas exhaust. The flue gas tie-in will be
Page 34 of 145
incorporated downstream to the Unit 2 wet electrostatic precipitator (WESP), upstream of the existing stack. To promote balanced flow, the new ductwork will tie-in to the Unit 2 duct and will transition to an FRP duct to the CO2 capture facility. A quick-acting modulating/control isolation damper with seal air will be used at the interface point upstream of the stack breaching to control (open up or close off) the flow to the CO2 capture trains or quickly open in case of a blower trip. The damper will allow some of the flue gas to bypass the CO2 capture system and exhaust through the existing stack in case of CO2 capture equipment is operating at part load. A separate isolation on/off damper with seal air will be installed in the new tie-in duct to supply the flow to the CO2 capture facility. There will be no return ductwork from the CO2 capture island back to the existing stack; all flue gas will pass through new stack pieces integral to and located at the top of the CO2 absorber columns. A similar arrangement will be employed for the auxiliary boilers’ flue gas tie-in to each train of the CO2 capture equipment. Auxiliary boiler flue gas duct will tie-in to the incoming flue gas duct of its respective train. MHI will provide new CEMS equipment in each new stack, as required. The flue gas ductwork tie-in and layout will minimize additional loading on existing steel to minimize re-enforcement of the existing steel. The new flue gas ductwork will be routed across existing roads while maintaining throughway access for the railroad loop and all trucks.
The cooling water system will be designed for the most cost-effective approach, considering that PSGC has limited water rights available for consumptive water use.
New steam generation equipment will be installed to provide a medium-pressure, superheated steam to the CO2 capture equipment. The generated steam will be utilized to drive MHI’s steam driven CO2 compressors using a back-pressure steam turbine. The low-pressure steam exhaust will be utilized in MHI’s reboilers for the CO2 capture process. Auxiliary power for the steam generation island and the CO2 capture system will be sourced from the electric grid and will require a tie-in to the grid. This tie-in is a new substation connecting to a 69kV overhead line that may be installed nearby as part of a separate project.
The maximum turndown of the CO2 capture facility will mirror the existing power plant operating range, 420 MW to full load 817 MW. To maximize carbon capture during partial outages of the carbon capture facility, the facility will be capable of partial operation including operation of one train.
Page 35 of 145
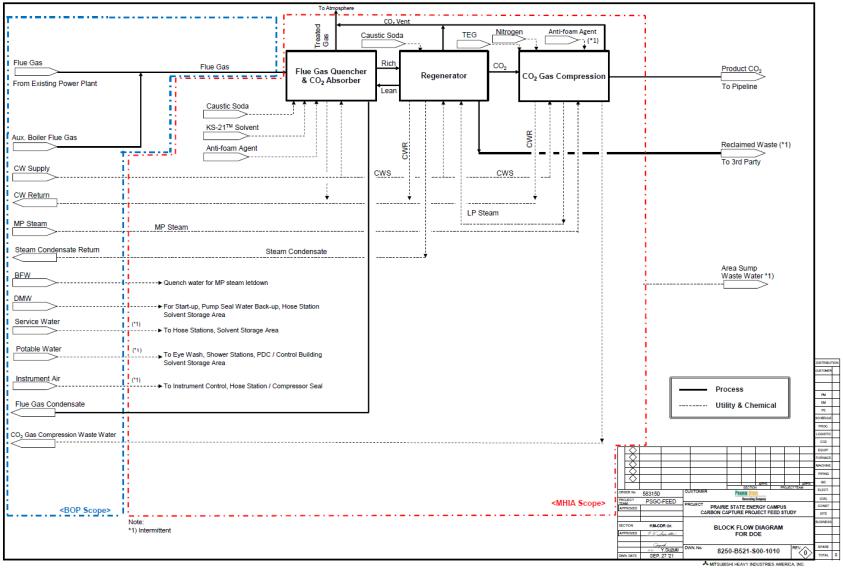
Process Flow Diagrams
Figure 8. Block Flow Diagram (BFD)
Page 36 of 145
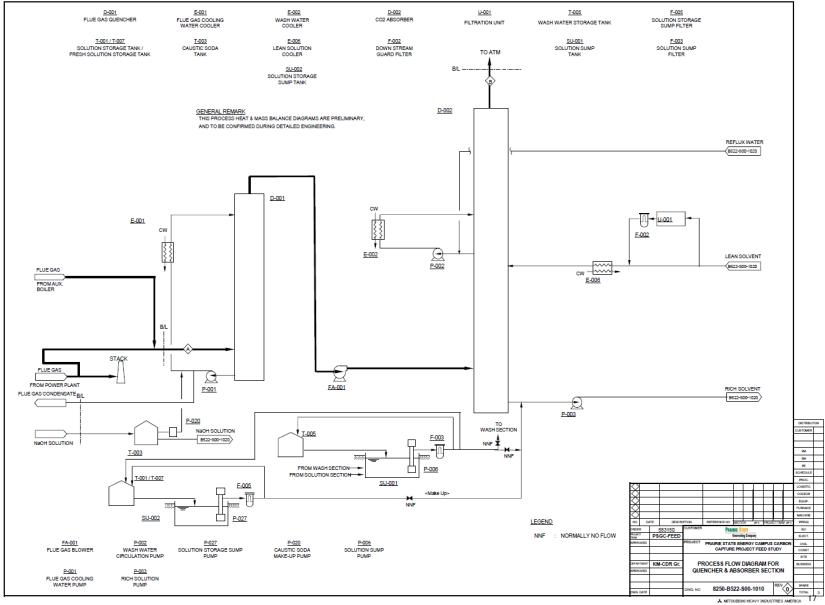
Figure 9. Process Flow Diagram for Quencher and Absorber Section
Page 37 of 145
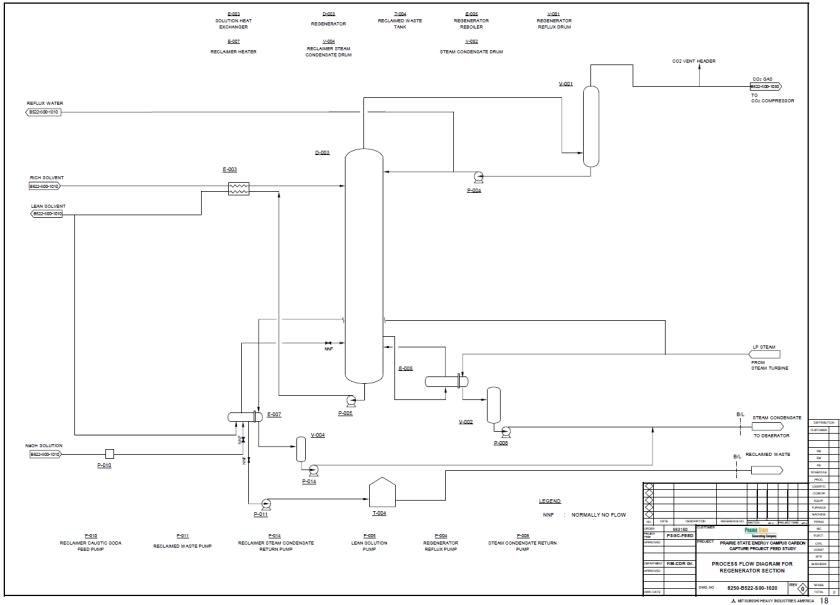
Figure 10. Process Flow Diagram for Regenerator Section
Page 38 of 145
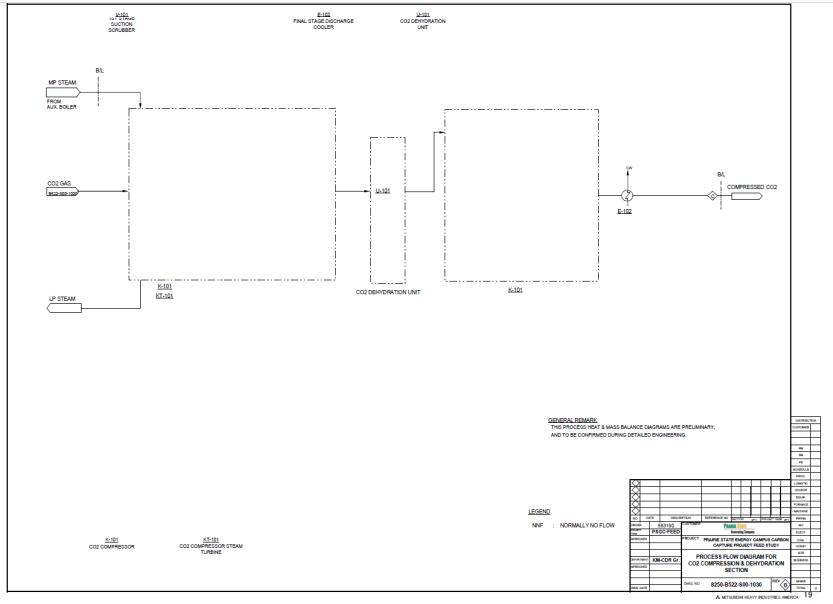
Figure 11. Process Flow Diagram for CO2 Compression and Dehydration Section
Page 39 of 145
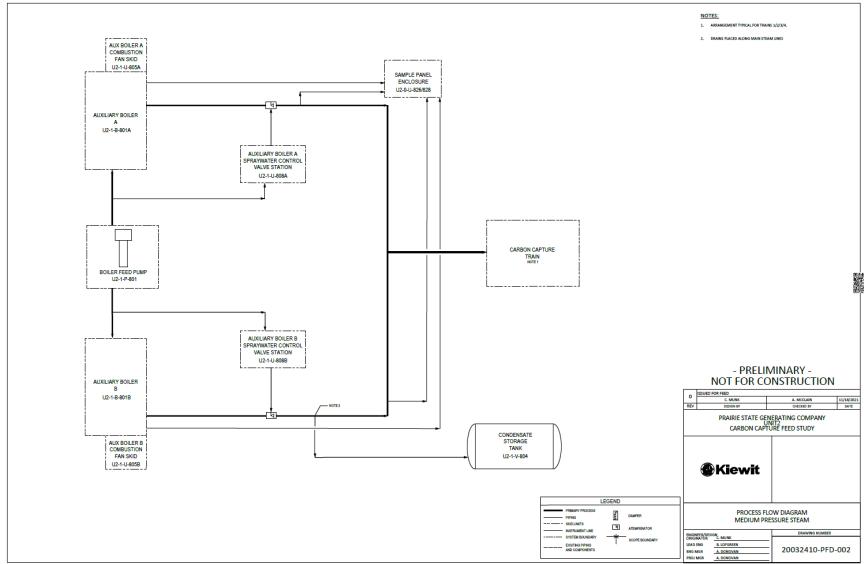
Figure 12. Process Flow Diagram Medium Pressure Steam
Page 40 of 145
Figure 13. Process Flow Diagram Steam Condensate and Boiler Feedwater
Page 41 of 145
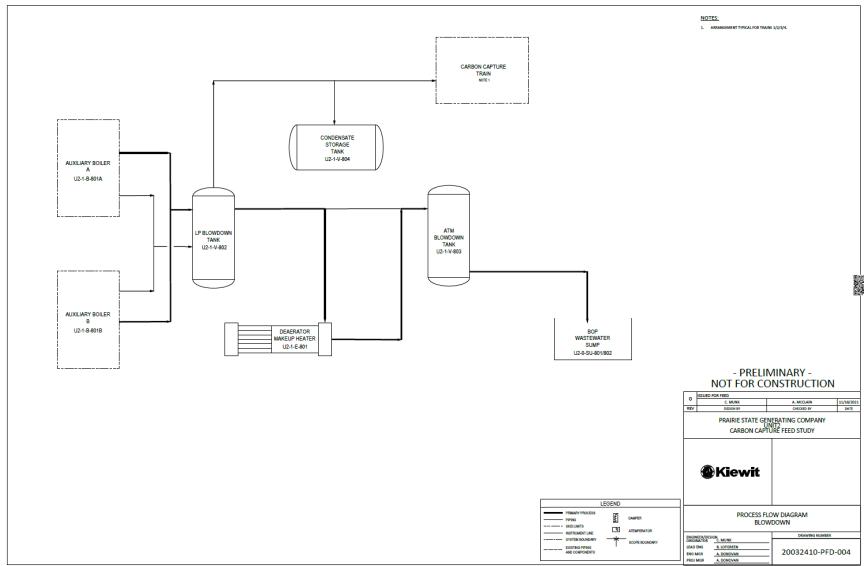
Figure 14. Process Flow Diagram Blowdown
Page 42 of 145
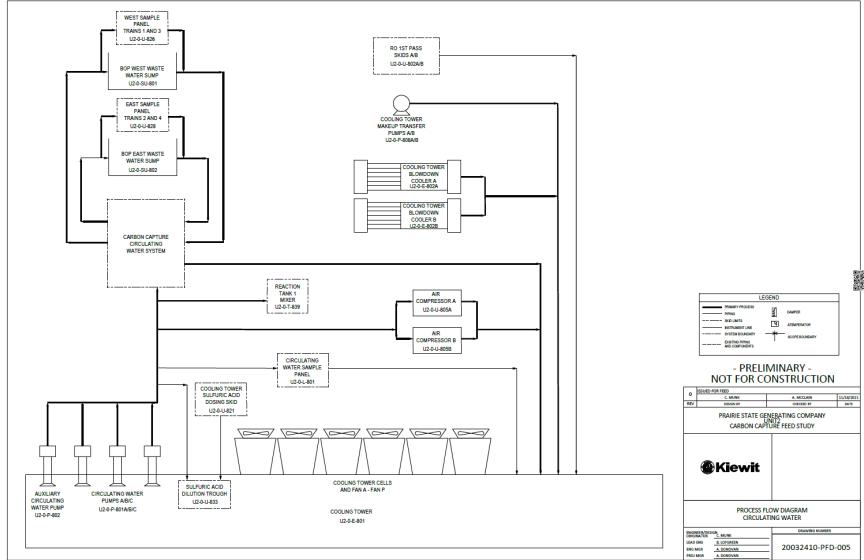
Figure 15. Process Flow Diagram Circulating water
Page 43 of 145
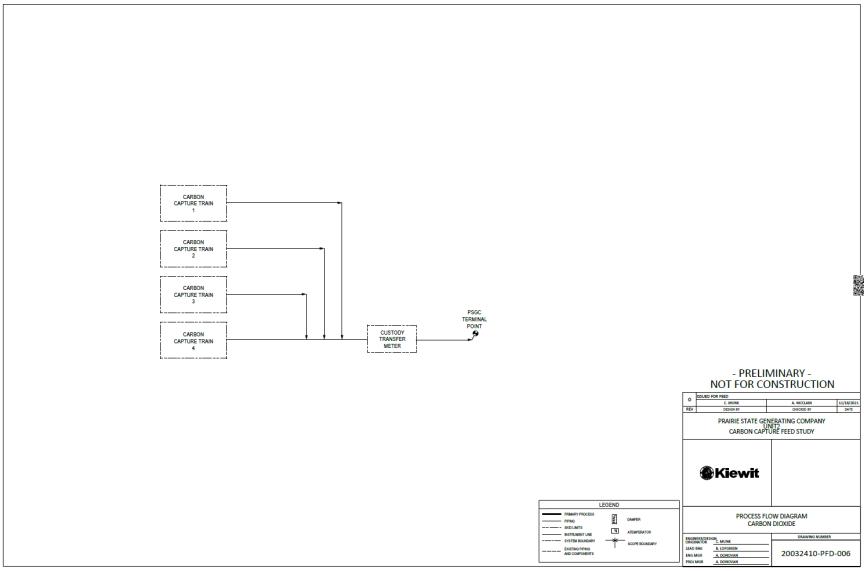
Figure 16. Process Flow Diagram Carbon Dioxide
Page 44 of 145
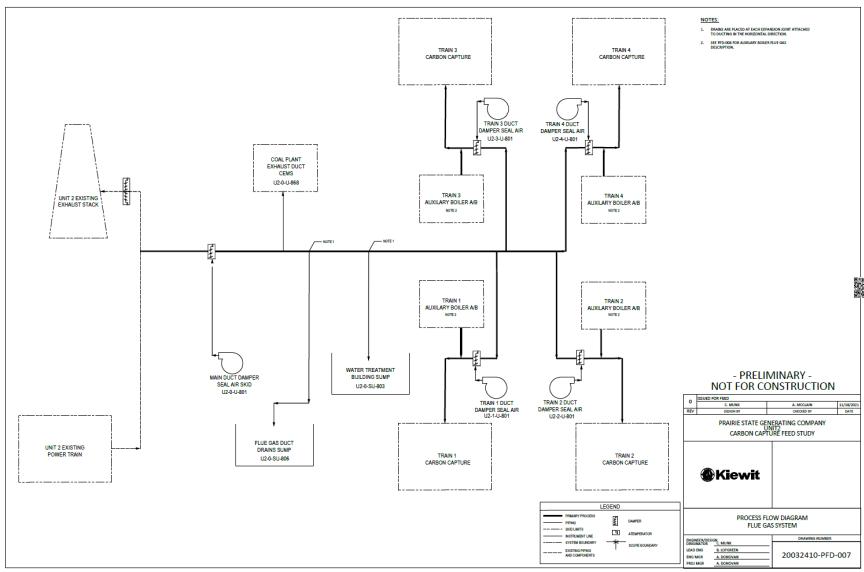
Figure 17. Process Flow Diagram Flue Gas System
Page 45 of 145
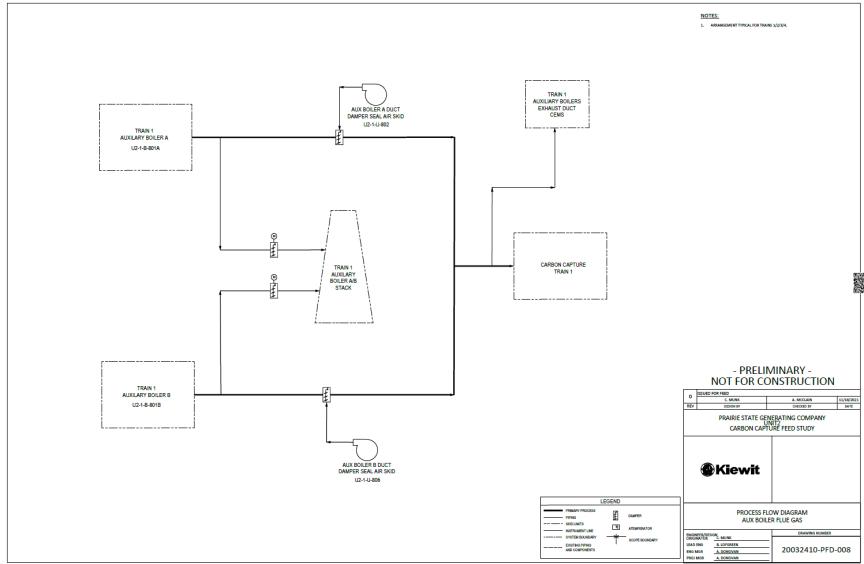
Figure 18. Process Flow Diagram Aux Boiler Gas
Page 46 of 145
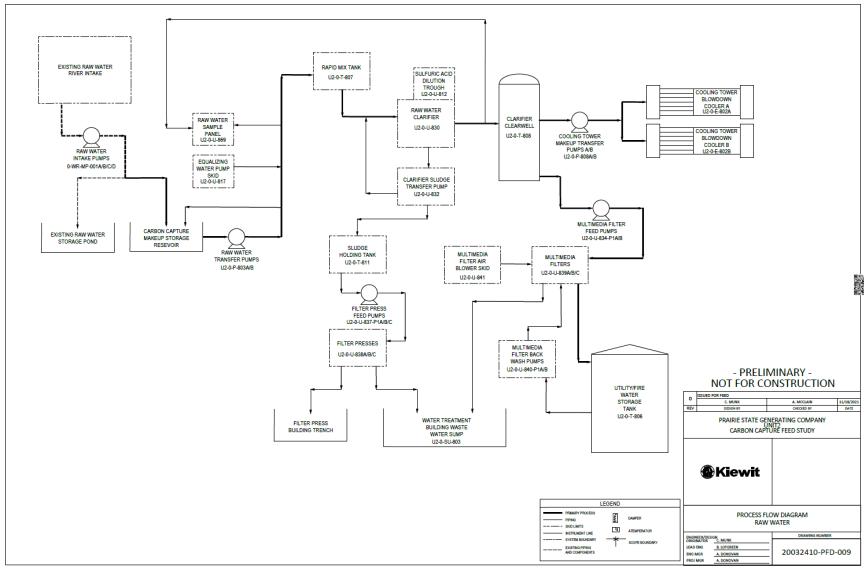
Figure 19. Process Flow Diagram Raw Water
Page 47 of 145
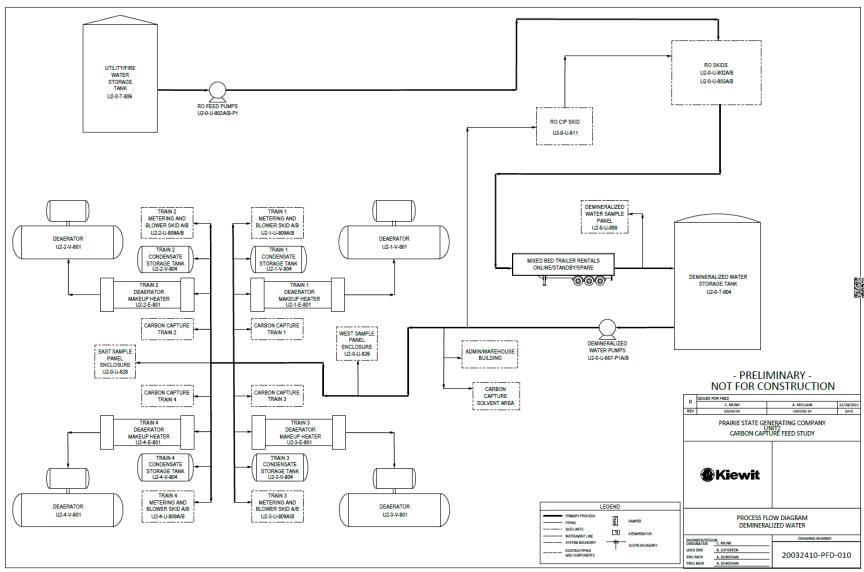
Figure 20. Process Flow Diagram Demineralized Water
Page 48 of 145
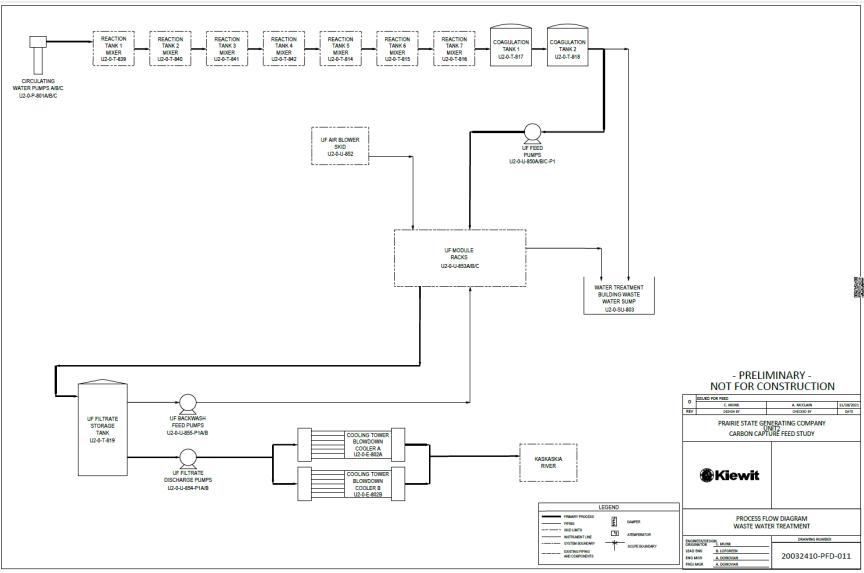
Figure 21. Process Flow Diagram Wastewater Treatment
Page 49 of 145
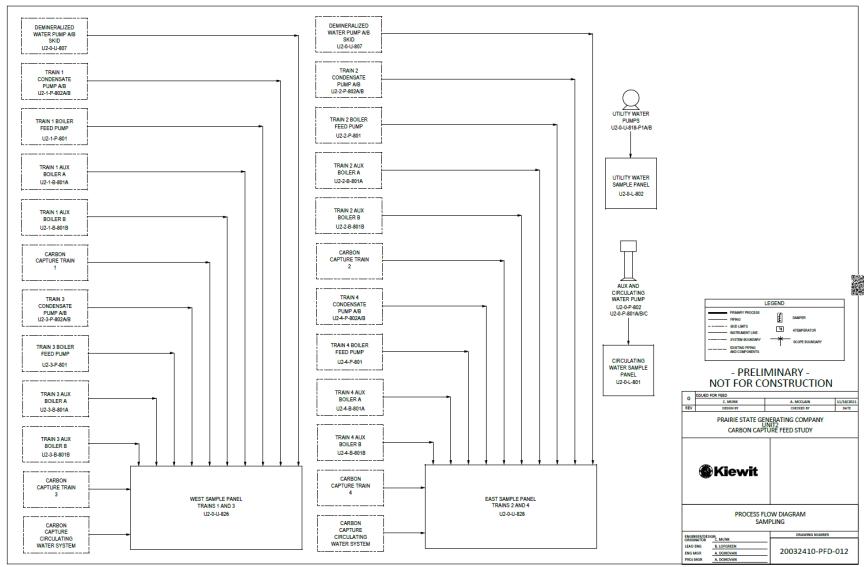
Figure 22. Process Flow Diagram Sampling
Page 50 of 145
Figure 23. Process Flow Diagram Steam Cycle Chemical Feed
Page 51 of 145
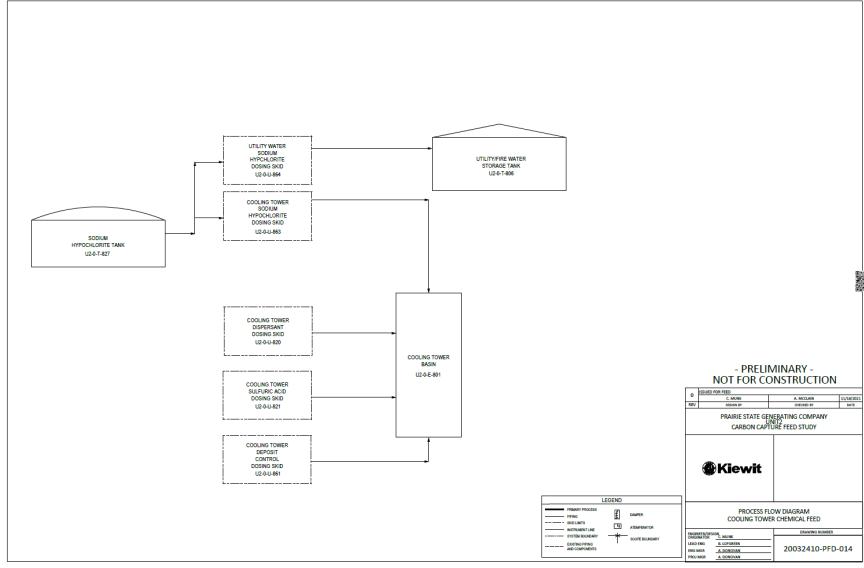
Figure 24. Process Flow Diagram Cooling Tower Chemical Feed
Page 52 of 145
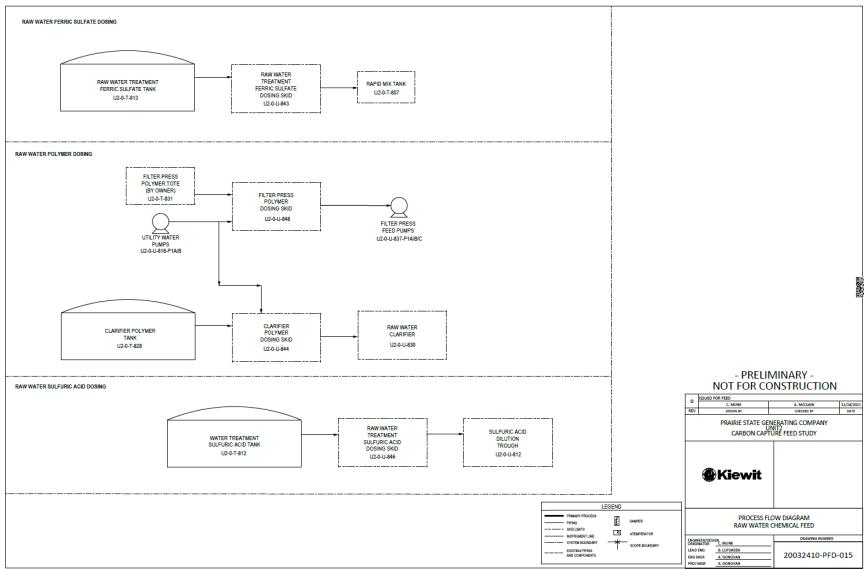
Figure 25. Process Flow Diagram Raw Water Chemical Feed
Page 53 of 145
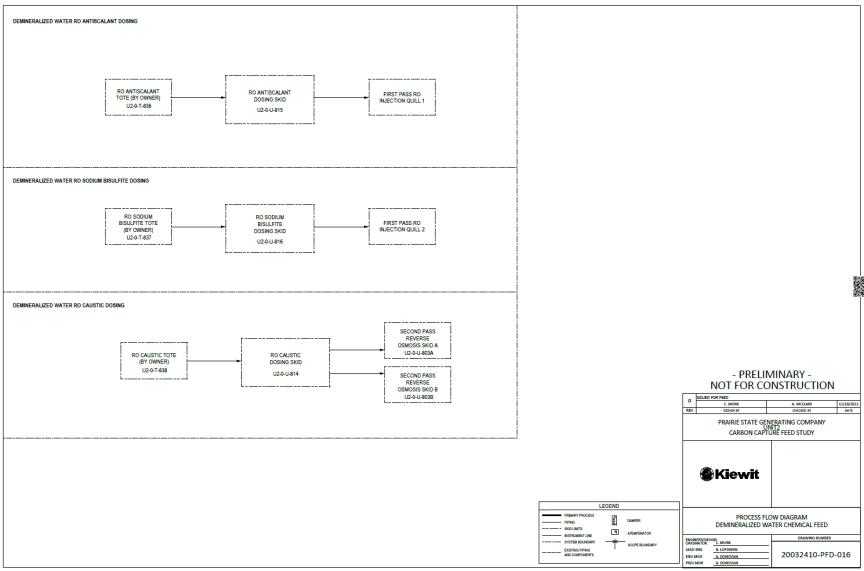
Figure 26. Process Flow Diagram Demineralized Water Chemical Feed
Page 54 of 145
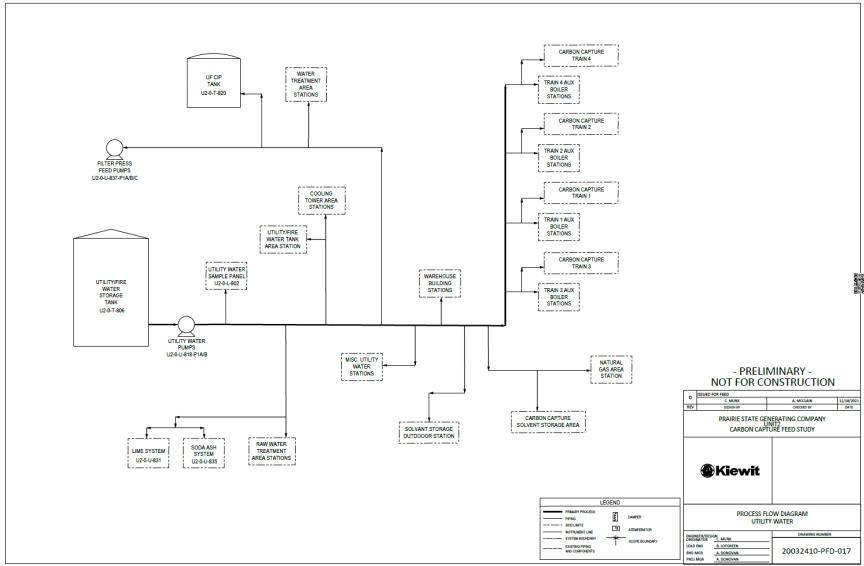
Figure 27. Process Flow Diagram Utility Water
Page 55 of 145
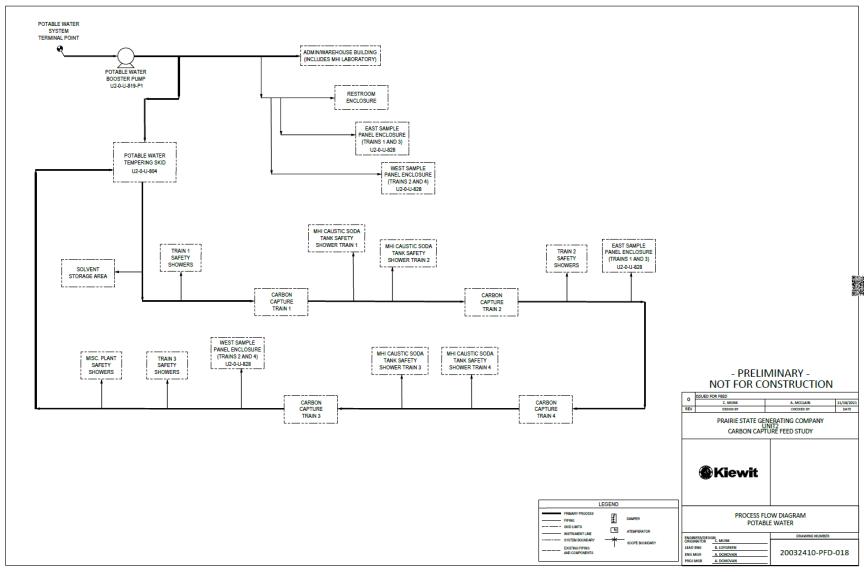
Figure 28. Process Flow Diagram Potable Water
Page 56 of 145
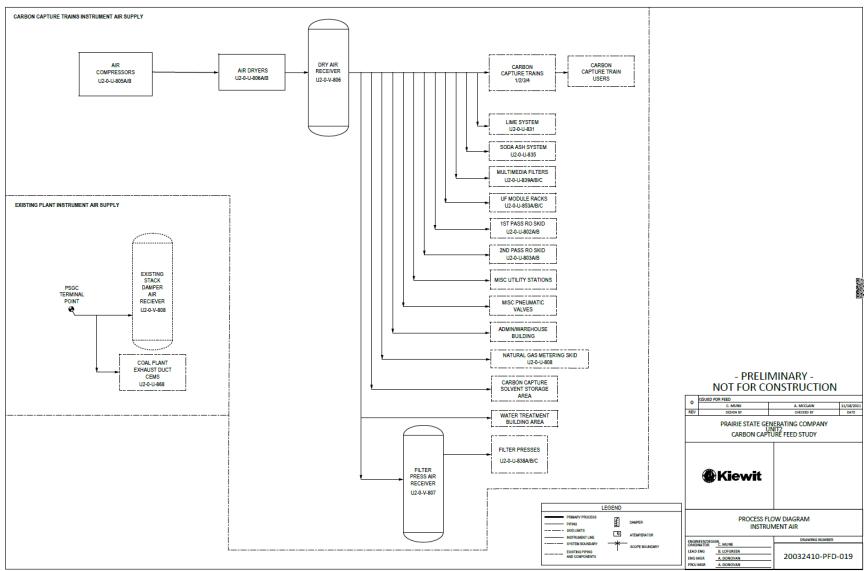
Figure 29. Process Flow Diagram Instrument Air
Page 57 of 145
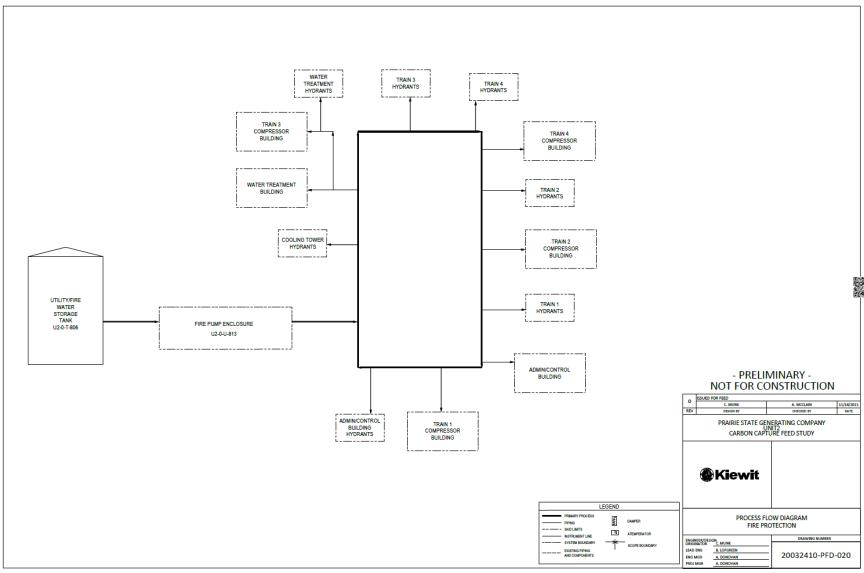
Figure 30. Process Flow Diagram Fire Protection
Page 58 of 145
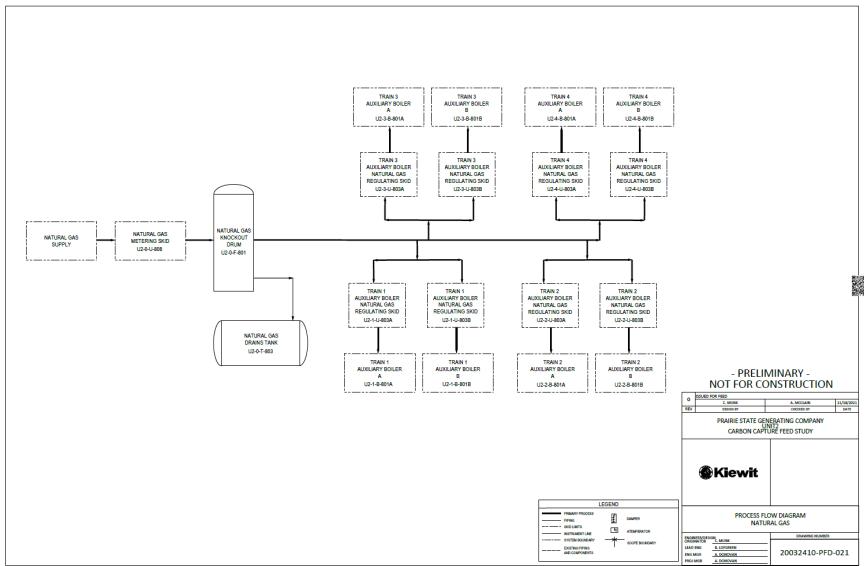
Figure 31. Process Flow Diagram Natural Gas
Page 59 of 145
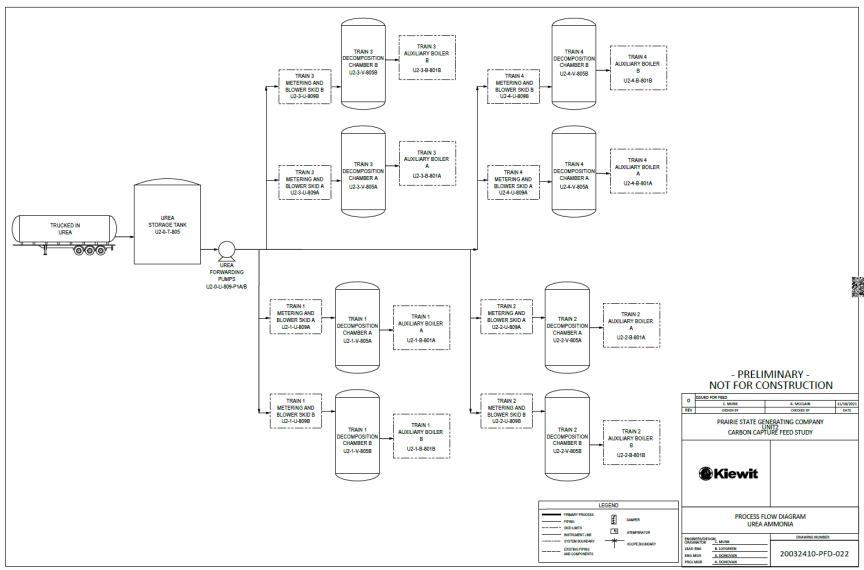
Figure 32. Process Flow Diagram Urea Ammonia
Page 60 of 145
Figure 33. Process Flow Diagram Nitrogen
Page 61 of 145
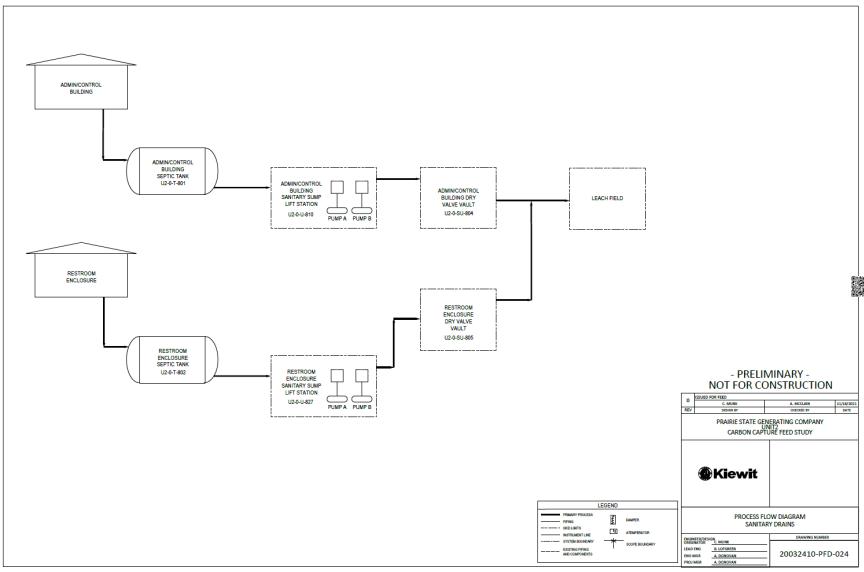
Figure 34. Process Flow Diagram Sanitary Drains
Page 62 of 145
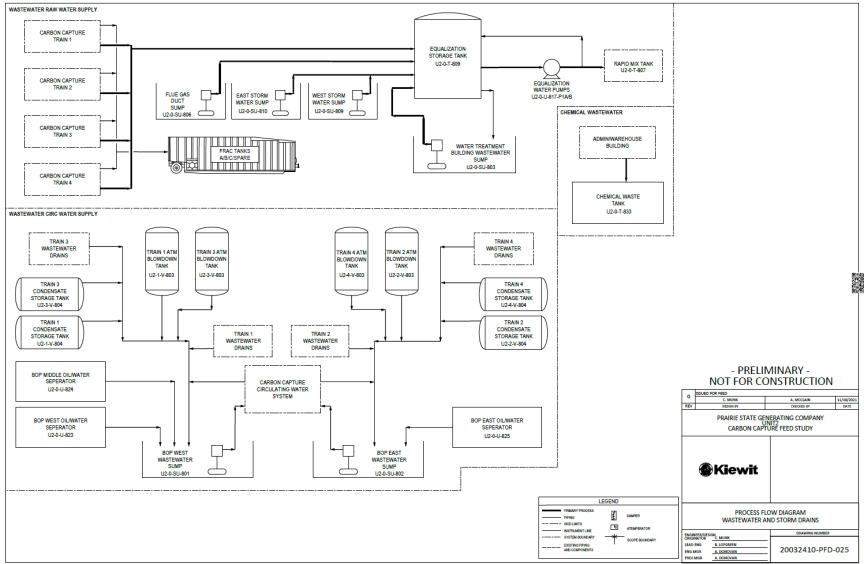
Figure 35. Process Flow Diagram Wastewater and Storm Drains
Page 63 of 145
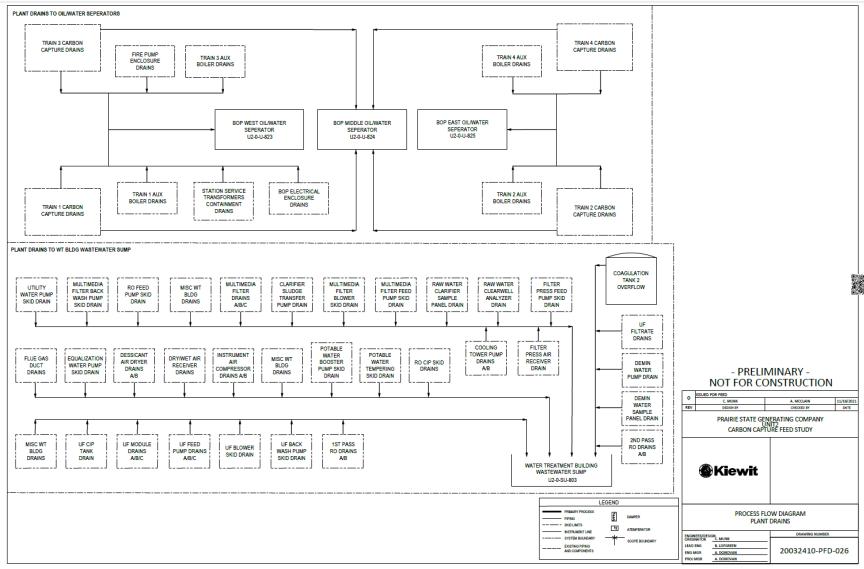
Figure 36. Process Flow Diagram Plant Drains
Page 64 of 145