

01 POWER ISLAND / 04 CO2 capture / Compostilla-project-OXYCFB300-FEED-report
.pdf70 | |
OXYCFB300 COMPOSTILLA. CARBON CAPTURE AND STORAGE DEMOSTRATION PROJECT |
OPERATIONAL FLEXIBILITY OF THE BOILER |
||
Load |
Fuel |
|
|
|
|
60% - 100% |
Load Range using coal/petcoke as fuel. |
|
Supercritical operation |
||
|
||
40% - 60% |
Load Range using coal/petcoke as fuel. |
|
Subcritical operation |
||
|
||
0% - 40% |
Not designed for continuous operation or oxycombustion. |
|
|
Use of start-up burners required. |
|
Table 4.18 Operational flexibility of the Boiler
Primary regulation, which will be conducted by the turbine control valves, implies load variations of 1.5% of the maximum load will be possible in order to recover the grid frequency in 15 sec once it has varied by 100 mHz.
Secondary regulation is designed according to the following figure, so that the maximum rate of change in load required is 3% · of the maximum load per minute.
4.4.2.2 CO2 Transport Pipeline and Storage
For the boiler, the transition between 40% and 100% load is achieved according to a certain ramp defined by the supplier of the equipment and according to the secondary regulation of Spanish electricity market. This ramp does not exceed 3% per minute, while the initial transient in firing rate can reach 30% per minute (in the case of very sudden demands of load variation). The steam turbine operates at sliding pressure during continuous operation. Therefore, its adaptation to transient operations involving moderate load variations can be considered immediate.
The ASU and CPU have been designed taking into account the operational flexibility of the boiler.
On the other hand, the CPU also has sufficient venting capacity to derive all the gas flow to the cooling tower. Such venting capability make it possible to separate its operational from the state of the site. Consequently, the boiler is the limiting element and the one that will react more slowly to any sudden load variations.
External Regulation
The plant has been designed to follow the demand of the Spanish electricity system.The figure below shows the daily load cycle of the design.
Figure 4.28 Designed load profile for the power station
From the point of view of external adjustment, the plant has been designed to participate in the primary and secondary regulation of the electricity system to which it is connected according to the operating procedures of Red Eléctrica de España (PO7.1 for the primary regulation and PO7.2 for secondary regulation).
The well signals for control and monitoring of the injection wells will be routed to the fibre optic cable available for the control and communications of the injection facilities and the transport pipeline, and routed to the Power plant control room. Some of the signals from the wells will be used for the control of the injection equipment.
Figure 4.29 Secondary regulation profile
The main power supply to feed the injection wells will be from the power supply available in the injection facilities. For the monitoring wells, and depending on their location, a separate study of the power supply and data transmission means shall be done, but does not form part of this design scope.
Initial Startups
All line pipe / piping must be thoroughly cleaned of debris and scale and this must be done prior to hydrostatic testing, thoroughly drained and dried.
Initial filling of the pipeline will include dewatering after hydro-test- ing, purging and initial pressurization of the pipeline. This operation will be manned and monitored at all times. In addition, coordination with the CPU facilities will be required to ensure proper temperature and pressures are maintained during the pressurization.
Subsequent Startups
During restart the mainline valves should be opened in sequence starting from the valve closest to the CPU. Each bypass valve should

CHAPTER 4. FEED DESIGN |
| 71 |
be opened first to ensure that there is minimal differential pressure across the mainline valves.
Emergency Shutdowns
Pipeline rupture/fracture event
An emergency contingency plan is in place with an emergency contact list for local governmental authorities and key area contacts. The rupture can readily be identified and located with the leak detection system in place. Once identified, the affected section of pipeline between the block valves must be immediately isolated with the use of the remotely operated block valves. No other action should be implemented until an inspection of the site of the rupture/fracture is conducted and assessment of damage documented. A situation specific restart re-pressurization plan will need to be implemented after complete repair of the pipeline.
Emergency Shutdown (ESD)
Levels of Emergency Shutdown:
ESD -1 – this level of release of CO2. Level one ESD will shutdown the entire pipeline, send a command to either shutdown the compressor or put it in recycle mode, close all mainline block valves in order segment the pipeline, and shut.
ESD-2 – Level two ESD is local to each wellhead and will shutdown only the affected well in the event of a wellhead rupture or a significant CO2 leak is discovered.
4.4.2.3 Full System Metering And Monitoring Concept
The most significant components to monitor are H2O, H2S, CO and O2. Each of these components significantly impacts the potential for corrosion in the pipeline. The CPU analyzers data are available for the pipeline control system.
Process monitoring CO2 Pressure above 80 bar to avoid pressure drops (being out of the two phase region). Process monitoring CO2
Temperature above 10ºC to avoid water condensation within the pipeline. Flow control is maintained at each well site. Normal depressurization should be performed with a complete notification, possible evacuation and monitoring of the surrounding areas near the blow down riser.
Monitoring, Verification and Accounting
The monitoring, verification, and accounting (MVA) plan for a storage project will have a broad scope, covering CO2 storage conformance and containment, monitoring techniques for internal quality control, and verification and accounting for regulators and monetizing benefits of geological storage. In OXY-CFB-300, the MVA is an important part of making storage of CO2 safe, effective, and permanent in all types of geologic formations.
OXY-CFB-300 MVA plan will be developed in accordance with Spanish Act 40/2010 for Geological CO2 Storage, but also it will include components for meeting regulatory requirements, monitoring the CO2 plume, monitoring water/brine behaviour, detecting potential release pathways, and quantifying releases. In this way, our MVA defines monitoring objectives, risk-based performance metrics, and resources allocated for monitoring activities. In addition, a comprehensive plan includes the reviewed of monitoring tools’ effectiveness, stakeholder communications, procedures for documenting monitoring activities, and processes used to evaluate monitoring performance.
Updating and validating of reservoir simulation models with data from the monitoring program is a primary activity in the Carbon Dioxide Injection MVA. Demonstrating the integrity of a CO2 injection project through monitoring the behaviour of injected CO2 will be integral to gaining community support for the subsurface injection of CO2. Key objectives for the monitoring and verification activities therefore include:
Generating clear, comprehensive, timely and accurate information that will be used to effectively and responsibly manage environmental, health, safety and economic risks and to ensure that set performance standards are being met.
Determining, to an appropriate level of accuracy, the quality, composition and location of gas captured, injected and stored and the net abatement of emissions. This should include identification and accounting of fugitive emissions.
Demonstrating that the residual risk of leakage is acceptably low at the time of site closure.
The following table shows the current estimated well operating range.
DUERO SITE: OPERATING PARAMETERS RANGE |
VALUE |
|
|
Pressure at surface (barg) |
0 - 110 |
Pressure at BH (barg) |
0 - 300 |
Temperature at surface (°C) |
-20 - 50 |
Temperature at BH (°C) |
0 - 60 |
|
|
Table 4.19 Current estimated injection wells operating range

72 | |
OXYCFB300 COMPOSTILLA. CARBON CAPTURE AND STORAGE DEMOSTRATION PROJECT |
4.4.2.4 Full System Leak Detection and Venting Philosophy
Piping and Onshore Facilities
Full system leak detection
Leak Detection System (LDS) does comply with the following requirements:
Detect leakages defined for each line, including its location. Limit false alarms.
Minimize the lack of sensitivity in detection leakages while changes in the normal operation like changes in the injection conditions.
Leak Detection System (LDS) can cope with the following operation situations:
Distinguish pressure changes because of temperature changes and not because of leakages.
Use the available time windows of the SCADA to do its calibrations and tests.
Understand the changes of all control parameters in blocked or out of order lines exposed to solar radiation or adverse environmental conditions.
Be aware of the temporal variations of the control parameters due to operational changes in the injection, as a well shut-down, or the different ways to operate them.
Take into account non uniform flows in the system.
Take into account transient conditions (start-up, shut-down, compressors replacement...)
Venting
Scheduled venting operations may occur during the lifetime of the pipeline. These venting activities can be required due to:
Commissioning
Pre-Commissioning
Hydro test
Repair of a pipeline section
Repair a main line block valve
Batch of CO2 is contaminated (High Water Concentration)
When venting occurs, the block valves on both ends of a section are closed and one vent line is opened. The high pressure CO2 is released from a 3-inch vertical vent line located on the top of the valve station.
All valve stations have the same design and are spaced to block in similar pipeline lengths. While the pressure along the pipeline varies, the blocked in pressure does not vary enough to change the state of the material or properties of the initial release. Therefore, venting from any valve station along the pipeline will produce similar results.
The venting operation begins with closing the block valves at valve stations at both ends of the desire pipe length to be vented. Then, the valve station is fully opened and CO2 is vented vertically. The venting operation is designed to avoid formation of free water.
A pipeline segment of 25,000 meters long will require approximately 4 days depressurizing. Release rates of 51.7 kg/s, 32.9 kg/s and 1.3 kg/s describe the release rate at 10 minutes, 60 minutes and 4 days (Terminal Venting Rate) after the venting starts, respectively
Storage
In storage site, in order to avoid potential leakage risks and control through wells, several devices will be installed.
CHAPTER 4. FEED DESIGN |
| 73 |
5.1 |
Capture . . . . . . . . . . . . . . . . . . . . . . . . . . . . . . . . . . . . . . . . . . . . . . . . . . . . . . . . . . . . . . . . . . . . . . . . . |
77 |
5.2 |
Transport . . . . . . . . . . . . . . . . . . . . . . . . . . . . . . . . . . . . . . . . . . . . . . . . . . . . . . . . . . . . . . . . . . . . . . . |
80 |
5.3 |
CO2 Storage . . . . . . . . . . . . . . . . . . . . . . . . . . . . . . . . . . . . . . . . . . . . . . . . . . . . . . . . . . . . . . . . . . . |
83 |
Access to and use of the information ¡n this document ¡s subject to the terms of the 
Access to and use of the information ¡n this document ¡s subject to the terms of the important notice at the front of the document

5
Technological
Development Plants

76 | |
OXYCFB300 COMPOSTILLA. CARBON CAPTURE AND STORAGE DEMOSTRATION PROJECT |
Index |
|
|
5.1 |
Capture . . . . . . . . . . . . . . . . . . . . . . . . . . . . . . . . . . . . . . . . . . . . . . . . . . . . . . . . . . . . . . . . . . . . . . . . . . . . . . . . . . . |
77 |
|
5.1.1 Description of the Test Facility . . . . . . . . . . . . . . . . . . . . . . . . . . . . . . . . . . . . . . . . . . . . . . . . . . . . . . . . . . . . . . |
77 |
|
5.1.2 CPU subunits. . . . . . . . . . . . . . . . . . . . . . . . . . . . . . . . . . . . . . . . . . . . . . . . . . . . . . . . . . . . . . . . . . . . . . . . . . . . . |
79 |
|
5.1.3 Measurement and Data Acquisition . . . . . . . . . . . . . . . . . . . . . . . . . . . . . . . . . . . . . . . . . . . . . . . . . . . . . . . . . |
79 |
|
5.1.4. CO2 Capture Test Results and Conclusions . . . . . . . . . . . . . . . . . . . . . . . . . . . . . . . . . . . . . . . . . . . . . . . . . . |
80 |
5.2 |
Transport . . . . . . . . . . . . . . . . . . . . . . . . . . . . . . . . . . . . . . . . . . . . . . . . . . . . . . . . . . . . . . . . . . . . . . . . . . . . . . . . . . . |
80 |
|
5.2.1 Description of Test Facility . . . . . . . . . . . . . . . . . . . . . . . . . . . . . . . . . . . . . . . . . . . . . . . . . . . . . . . . . . . . . . . . . |
80 |
|
5.2.2CO2 Transport Test Results and Conclusions . . . . . . . . . . . . . . . . . . . . . . . . . . . . . . . . . . . . . . . . . . . . . . . . . |
81 |
|
5.2.2.1 Parametric Tests . . . . . . . . . . . . . . . . . . . . . . . . . . . . . . . . . . . . . . . . . . . . . . . . . . . . . . . . . . . . . . . . . . . |
81 |
|
5.2.2.2 Results. . . . . . . . . . . . . . . . . . . . . . . . . . . . . . . . . . . . . . . . . . . . . . . . . . . . . . . . . . . . . . . . . . . . . . . . . . . . |
82 |
5.3 |
CO2 Storage. . . . . . . . . . . . . . . . . . . . . . . . . . . . . . . . . . . . . . . . . . . . . . . . . . . . . . . . . . . . . . . . . . . . . . . . . . . . . . . . . . . |
83 |
|
5.3.1 Site Selection and Geological Characterization. . . . . . . . . . . . . . . . . . . . . . . . . . . . . . . . . . . . . . . . . . . . . . . |
83 |
|
5.3.2 Plant Components. . . . . . . . . . . . . . . . . . . . . . . . . . . . . . . . . . . . . . . . . . . . . . . . . . . . . . . . . . . . . . . . . . . . . . . . |
83 |
|
5.3.3 Monitoring Techniques . . . . . . . . . . . . . . . . . . . . . . . . . . . . . . . . . . . . . . . . . . . . . . . . . . . . . . . . . . . . . . . . . . . . |
83 |
List of Figures |
|
|
Figure 5.1 |
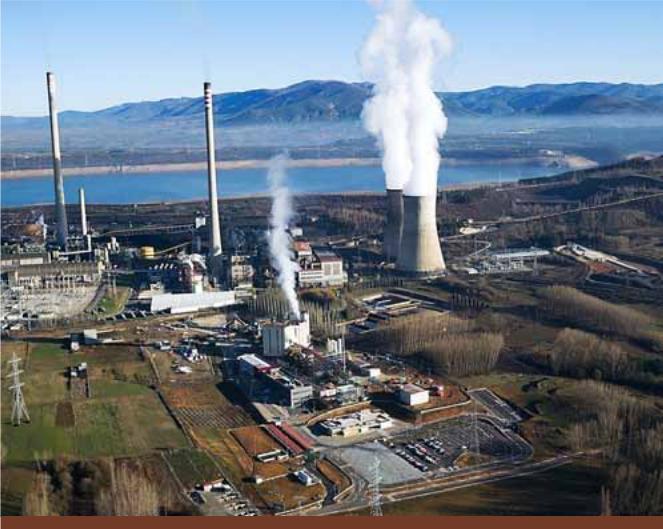
CIUDEN´s Technological Development Plant, close to the ENDESA Compostilla Power Station 77 |
|
Figure 5.2 |
Schematic process flow diagram of CIUDEN’s TDP. . . . . . . . . . . . . . . . . . . . . . . . . . . . . . . . . . . . . |
78 |
Figure 5.3 |
TDP layout . . . . . . . . . . . . . . . . . . . . . . . . . . . . . . . . . . . . . . . . . . . . . . . . . . . . . . . . . . . . . . . . . . . . . . . . . |
78 |
Figure 5.4 |
CIUDEN pilot CFB boiler. . . . . . . . . . . . . . . . . . . . . . . . . . . . . . . . . . . . . . . . . . . . . . . . . . . . . . . . . . . . . |
78 |
Figure 5.5 |
Simplified process block diagram . . . . . . . . . . . . . . . . . . . . . . . . . . . . . . . . . . . . . . . . . . . . . . . . . . . . |
79 |
Figure 5.6 |
CIUDEN pilot CFB boiler PFD including instrumentation locations . . . . . . . . . . . . . . . . . . . . . . . |
79 |
Figure 5.7 |
Aerial picture of CIUDEN’s TDP . . . . . . . . . . . . . . . . . . . . . . . . . . . . . . . . . . . . . . . . . . . . . . . . . . . . . . |
80 |
Figure 5.8 |
Transport rig PFD. . . . . . . . . . . . . . . . . . . . . . . . . . . . . . . . . . . . . . . . . . . . . . . . . . . . . . . . . . . . . . . . . . . |
81 |
Figure 5.9 |
Partial view of the transport rig at CIUDEN’s TDP . . . . . . . . . . . . . . . . . . . . . . . . . . . . . . . . . . . . . . |
81 |
Figure 5.11 |
Technological development plant for CO2 storage. . . . . . . . . . . . . . . . . . . . . . . . . . . . . . . . . . . . . . |
83 |
Figure 5.10 |
Site selection studies . . . . . . . . . . . . . . . . . . . . . . . . . . . . . . . . . . . . . . . . . . . . . . . . . . . . . . . . . . . . . . . |
83 |
Figure 5.12 |
Set of monitoring techniques currently deployed in the Hontomin Area . . . . . . . . . . . . . . . . . . |
84 |
Figure 5.13 |
Drilling and completion of hydrogeological wells in Hontomín . . . . . . . . . . . . . . . . . . . . . . . . . . . |
85 |
Figure 5.14 |
Applying DInSAR and SAR (GB-SAR) techniques at Hontomín . . . . . . . . . . . . . . . . . . . . . . . . . . |
85 |
List of Tables
Table 5.1 |
Design parameters of the transport rig. . . . . . . . . . . . . . . . . . . . . . . . . . . . . . . . . . . . . . . . . . . . . . . . |
81 |
CHAPTER 5. TECHNOLOGICAL DEVELOPMENT PLANTS |
| 77 |
5.1 CAPTURE
5.1.1 Description of the Test Facility
As CFB technology has been commercially demonstrated for conventional air firing but additional efforts to ensure the technological applicability to oxyfiring were required, the Technological Development Plant (TDP) owned by CIUDEN includes a 30 MWth Oxy-CFB boiler as its core unit, using the same technology that will be incorporated to the commercial Demo Plant. A complete test program has been carried out in this TDP, with the aim of validating the full chain of processes from fuel preparation to CO2 purification, producing a stream product ready for transport and storage in order to obtain enough data for scaling-up the technology.
The configuration of the TDP is flexible, modular and versatile in order to test a wide range of operating conditions including different coals and combustion conditions from air mode to oxymode, using independent but interconnected units for simultaneous or separate operation.
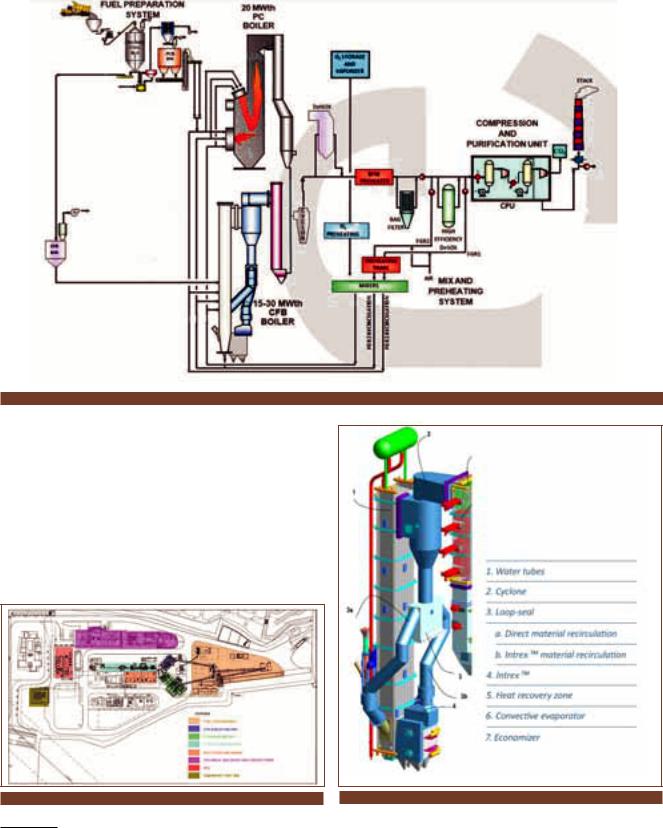
The TDP incorporates advanced equipment for the development of oxycombustion technologies, namely (see following figure):
Fuel preparation system.
Circulating fluidized bed boiler (CFB up to 30 MWth). Pulverized coal boiler (PC – up to 20 MWth).
Flue gas cleaning equipment:
Cyclones
Selective Catalytic Reduction (SCR) unit for NOx abatement Bag filter
System for collection, transport and storage of solids and ashes Flue gas recirculation (FRG) and oxidant preparation systems. CO2 compression and purification unit (CPU)
CO2 transport test rig.
Auxiliary service systems (oxygen, compressed air, LNG as auxiliary fuel, raw water, demineralised water, cooling water, CO2 as inert fluid, etc).
Figure 5.1 CIUDEN´s Technological Development Plant, close to the ENDESA Compostilla Power Station
78 | |
OXYCFB300 COMPOSTILLA. CARBON CAPTURE AND STORAGE DEMOSTRATION PROJECT |
||
|
|
|
|
|
|
|
|
Figure 5.2 Schematic process flow diagram of CIUDEN’s TDP
The variety of fuels to be used includes different ranges of coal and biomass. In particular, anthracites, bituminous and sub-bituminous European indigenous coals and pet coke were tested. This approach provides a valuable support to the requirements of ENDESA regarding fuels utilization at the Demo Plant, and will contribute to demonstrate the capabilities of the OxyCFB technology to process different fuels of interest for other Utilities in Europe in an efficient way.
As the Reader can see, CIUDEN’s TDP includes the necessary units to obtain the CO2 stream ready to be transported considering an semiindustrial size, roughly 1:3012 scale compared to the Demo Plant.
Figure 5.3 TDP layout
Figure 5.4 CIUDEN pilot CFB boiler
12 Average ratio based on boilers design thermal loads.
CHAPTER 5. TECHNOLOGICAL DEVELOPMENT PLANTS |
| 79 |
Feed water is heated using an appropriately designed economizer and the steam is produced in a natural circulation combustor circuit comprising downcomers, evaporative surface, riser tubes and steam drum.
The boiler heat recovery zone contains an evaporative tube bundle and economizer, and the steam-cooled walls act as the first superheating stage. It is also provided with several sootblowers distributed in the heat recovery zone, the convective evaporator and the economizer.
5.1.2 CPU subunits
CIUDEN´s Compression and Purification unit (CPU) has the capacity to capture CO2 from oxy-combustion flue gases. The CPU has been designed in a modular way that allows different process-sys- tem configurations by having the possibility to by-pass some of its sub-units. As the rest of the TDP, the CPU size has been chosen to facilitate the testing of technologies that will be ‘upscalable’ to the size required for a commercial demonstration unit while maintaining a reasonable cost and power consumption.
In a general view, the unit comprehends two main parts:
Warm section or pre-treatment part: This has been sized to treat the whole flue gas flow produced in either the Pulverised Coal (PC) or the Circulating Fluidised Bed (CFB) boilers. This has been done in order to have the possibility to test innovative flue gas scrubbing systems, filtration and drying at a sufficiently large enough size to allow the extrapolation of the design at a commercial scale as a next step. In terms of equivalent “CO2 capacity”, this important part of the unit could be rated as a 165 tpd.
Cold section: at a commercial scale, centrifugal technology would be used for CO2 compression. However, the CO2 flow at CIUDEN is not sufficient to make the implementation of this type of machines economically feasible so alternative technology, such as reciprocating compressors, must be used. Since centrifugal compressors are not used, the compression and cryogenic separation parts of the process have been scaled to produce 10 tons per day of CO2 in order to reduce the overall investment cost of the unit. In addition cryogenic technology is well probed at all sizes. With such capacity, the unit still demonstrates a capacity larger than the majority of the CO2 capture pilot plants installed worldwide or in progress for coal power plants.
5.1.3 Measurement and Data Acquisition
The instrumentation of the CFB boiler consists of around 800 measurements in addition to the instruments for motors, frequency converters and valve actuators. This instrumentation mainly comprises temperature and pressure measurements, heat flux profiles in boiler, flow meters and gas analyzers.
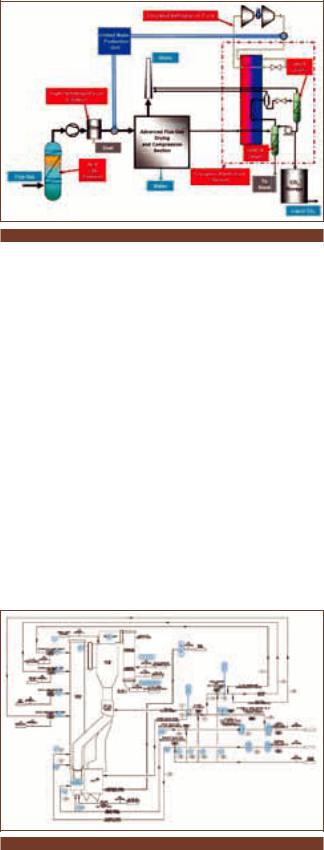
Figure 5.5 Simplified process block diagram
The following figure shows the minimum instrumentation necessary to close the mass and energy balance of the boiler i.e. flows, temperatures, pressures and compositions of the inputs and output streams etc. In addition to those shown, there are a number of measurements allowing mapping out detailed conditions inside the combustion process.
In the flue gas recirculation system and fuel preparation system there are almost 400 additional signals corresponding to its own instrumentation consisting of flow meters, gas analyzers, weighting cells, flow velocity meters and temperature and pressure measurements.
All the above-mentioned signals are collected in the DCS (Distributed Control System) where they are recorded and saved in the history database to assist in data analysis.
The DCS is a single centralized platform capable of supporting any commercial communication bus system (modbus, profibus, Fieldbus ...) that allows the diagnosis and the programming of the different devices from a “single control desk”.
Figure 5.6 CIUDEN pilot CFB boiler PFD including instrumentation locations