

01 POWER ISLAND / 04 CO2 capture / Compostilla-project-OXYCFB300-FEED-report
.pdf60 | |
OXYCFB300 COMPOSTILLA. CARBON CAPTURE AND STORAGE DEMOSTRATION PROJECT |
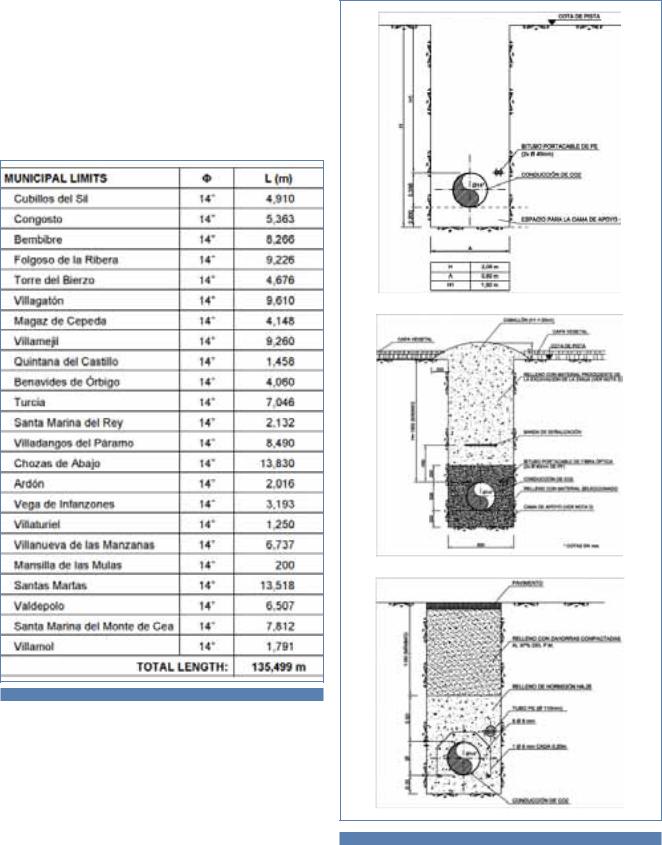
A surface casing of 13-3/8 inches will be run to 350m inside 17-1/2 inch open hole and cemented to the surface. An 8-½ inch open hole will be drilled to a TD of 1960m after which two 7 inch OD 29lb/ ft (43.15 kg/m) N-80 casing (with 25 Cr treatment for the bottom 360m) with the above-mentioned instrumentation will be run into the well and (CO2 resistant) cemented in place.
DEPTHS (M) |
COMPLETION |
Casing
0 (-58)
Conductor: 20'' OD - 94 lb/ft H-40 BT&C set in a 26'' wellbore cemented to the surface
0 (-350)
Surface: 13-3/8'' OD - 61 lb/ft J55 BT&C set in a 17-1/2'' wellbore cemented to surface
0 (-1445)
Intermediate: 9.625'' OD - 43.5 lb/ft N-80 BT&C set in a 12-1/4” wellbore cemented to surface
0 (-1600)
Production casing: 7'' OD - 29 lb/ft N-80 set in a 8-1/2'' wellbore cemented to liner top
1600 (-1960)
Production casing: 7” OD - 29 lb/ft, 80 Ksi, 25 Cr with premium flush joint connections
Table 4.11 Casing program for the generic monitoring well
Figure 4.12 Wellhead and the X-mas tree
4.2.3.4 Storage FEED Engineering
The injection system comprises surface facilities at the injection site, where there are a distribution manifold at the end of the transport pipeline, distribution pipelines to wells, additional compression facilities if needed, measurement and control systems, wellhead(s) and the injection wells.
Next picture presents a block flow diagram, indicating the overall flow and distribution of CO2 from the OXY-CFB-300 plant to the deep saline aquifers. Developing a aquifer for CO2 storage involves:
Drilling and equipping injection wells
Installation of high-pressure injection equipment and related piping
The storage site will be able to handle 70 kg/s of CO2 daily.
Determining the required CO2 pressure at the top of the well requires consideration of the pressure required at the bottom of the well to force CO2 into the injection zone, the pressure increase in the pipe due to the height of the CO2 column, and the pressure loss due to flow in the pipe. Moving the CO2 into the reservoir requires raising the CO2 sufficiently above the in situ pressure to provide a driving force, but not so high as to risk hydrofracturing the injection interval (Energy Information Administration, 2000). It is found that the pipeline delivery pressure, 100 bars, will be adequate for injection.
Figure 4.13 CO2 injection Block Flow Diagram (preliminary data)

CHAPTER 4. FEED DESIGN
4.2.4 Overall Project Data
4.2.4.1 Performance
OXY MODE |
19/07/2012 |
||
Coal consumption (kg/s) |
|
|
|
30.9 |
|||
Limestone consumption (Ton/h) |
28.76 |
||
Gross power (MW) |
345.2 |
||
Gross power plant efficiency (%) (LHV) |
48.4 |
||
Auxiliary total (MW) |
107.6 |
||
Net power (MW) |
237.7 |
||
Boiler efficiency (%) (LHV) excluding HRS |
93.83 |
||
Net power plant efficiency (%) (LHV) |
33.3 |
||
CO2 produced (kg/s) |
70.08 |
||
CO2 captured (kg/s) |
63.77 |
||
CO2 emitted (kg/s) |
6.31 |
||
Capture ratio (%) |
|
91 |
|
Annual equivalent operation hours for the first 5/10 |
4400 |
|
5004 |
|
|||
years of operation |
|
||
|
|
|
|
CO2 captured for the first 5/10 years of operation |
5.05 |
|
11.49 |
(Million Tons) |
|
|
|
| 61
|
AIR MODE |
19/07/2012 |
||
Coal consumption (kg/s) |
|
|
||
28.49 |
||||
Limestone consumption (Ton/h) |
26.78 |
|||
Gross power (MW) |
299.8 |
|||
|
|
|
|
|
Gross power plant efficiency (%) (LHV) |
45.6 |
|||
|
|
|
|
|
Auxiliary total (MW) |
29.8 |
|||
|
|
|
|
|
Net power (MW) |
270 |
|||
Boiler efficiency (%) (LHV) excluding HRS |
90.2 |
|||
Net power plant efficiency (%) (LHV) |
41.1 |
|||
|
|
|
|
|
CO2 produced (kg/s) |
64.25 |
|||
|
|
|
|
|
CO2 captured (kg/s) |
0.00 |
|||
CO2 emitted (kg/s) |
64.25 |
|||
Capture ratio (%) |
0 |
|||
|
|
|
|
|
28/12/2012 |
|
Coal LHV (KJ/Kg) |
|
23060 |
|
|
|
|
|
Table 4.12 CO2 Balance.
CO2 PARAMETERS (INCLUDING TRANSPORT COMPRESSOR)
CO2 Captured (% weight CO2) |
|
91% |
CO2 Captured (ton/yr)* |
|
1,287,007 |
CO2 Emitted (ton/yr)*(OXY+AIR) |
|
218,417 |
*5606 equivalent operating hours OXY mode |
|
|
394 equivalent operating hours AIR mode |
|
|
|
|
|
CO2 Captured (g/kWh) |
|
965.8 |
CO2 Emitted (g/kWh) |
|
95.5 |
CO2 Avoided (g/kWh) |
|
761.1 |
|
|
|
Table 4.13 CO2 parameters
All CO2-related data have to be taken with extreme care because the amount of CO2 actually captured/emitted depends on the number of oxycombustion operating hours and on plant load. It is very risky to express CO2 data on a yearly basis because important misunderstandings may be created if the number of full load equivalent operating hours is not specified. Continuous rates (kg/s) are more accurate, provided that boiler load is specified. Data given in kg/s in the tables above correspond to 100% load operation.
4.2.4.2. CO2 Transport and Storage Main Data
Table 4.14 Transport and Storage Planned and Actual values comparison
at the end of Phase I
62 | |
OXYCFB300 COMPOSTILLA. CARBON CAPTURE AND STORAGE DEMOSTRATION PROJECT |
4.3 LAYOUT AND CONSTRUCTION |
Justification for the Site |
|
|
|
The Compostilla Power Station is located in a consolidated indus- |
4.3.1 Site Location |
trial area dedicated to generating electricity using coal. It features |
|
|
|
a range of infrastructures that facilitate the installation of the OXY- |
4.3.1.1 Capture |
CFB-300 plant, as they can also be used by the new power station. |
|
Location |
This location offers space, power evacuation capacity, water, coal |
|
The OXY-CFB-300 plant will be situated on lands belonging to the |
storage yard, etc. All this makes it a particularly attractive option. |
|
current Compostilla Power Station, in the municipality of Cubillos |
In addition, it is in the midst of an industrial area that will favour the |
|
de Sil, which is located in the North East of the province of Leon, at |
installation of new power generating capacity. |
|
a distance of 110 km from the capital city, León, and 4.3 km from the |
|
|
mining town of Ponferrada. |
Moreover, the existence of coal in the region is a distinct advantage |
|
|
|
regarding the availability of fuel for the plant, together with the use |
The four thermal power generation units of the current power sta- |
of the coal management and storage infrastructure, which can han- |
|
tion (different ages and power) are located near the site. Part of the |
dle both local and imported coal. |
|
coal supply infrastructure of these units will be used for the new |
|
|
plant and the 400 kV substation. |
Finally, in the vicinity of the site chosen, we have CIUDEN’s 30MW |
|
|
|
technology development plant (PDT), which is of interest regarding |
The approximate geographical coordinates of the site where the |
the use of any experience obtained at a smaller scale. |
|
power station will be located are. |
|
|
|
Longitude: 42º 36’ 49.85” N |
|
|
Latitude: 06º 33’ 49.24” W |
4.3.1.2 Transport |
|
Altitude: +577 m above sea level |
|
|
|
General Description of the Route |
|
|
|
|
|
The selected route starts inside the Compostilla Power Station, |
|
|
more specifically in the planned CO2 capture installations in the MA |
|
|
of Cubillos del Sil, and goes round these installations by the west |
|
|
to then, at Dehesas del Obispo, turns east and runs parallel to the |
|
|
existing infrastructures. |
|
|
|
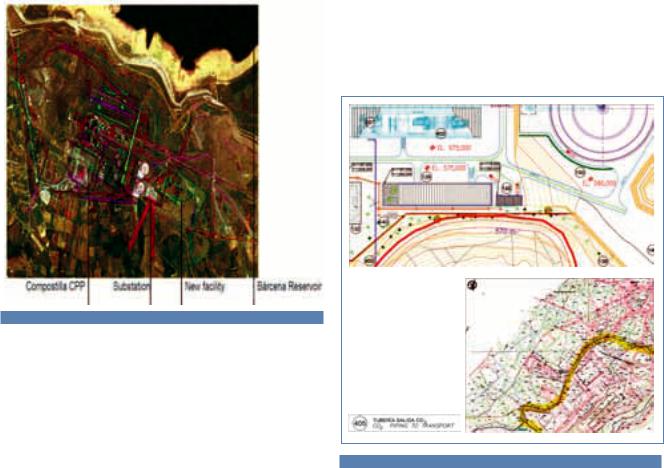
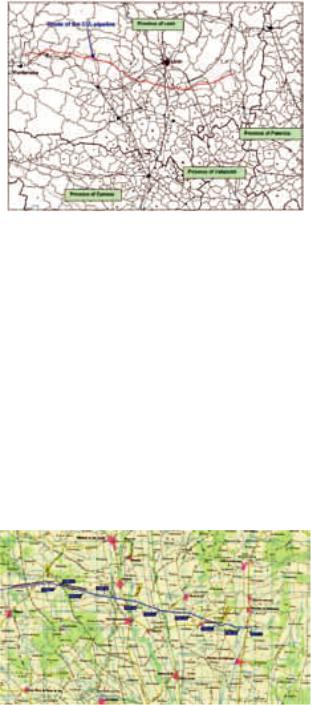
Figure 4.14 Location of the OXYCFB300 plant
The site can be reached directly from the regional road, CL-631 “Ponferrada-Villabilno”, through Pantano Avenue. Other modes of transport that service this area are:
Railway: The coal railway line is located near the power station.
Airport: The nearest airport is Leon Airport, at a distance of 110 km.
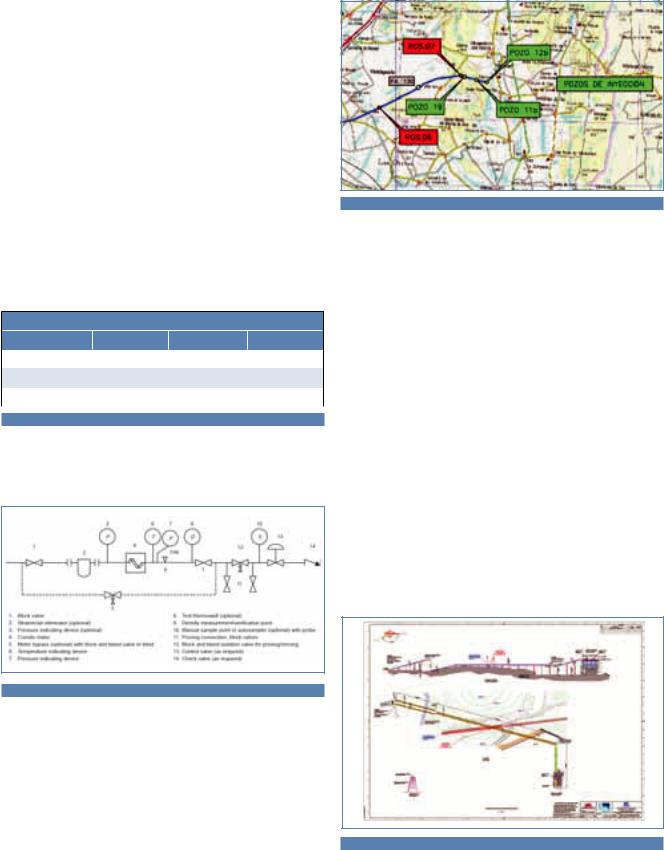
Figure 4.15 General description of the route
CHAPTER 4. FEED DESIGN |
| 63 |
Still heading eastwards it comes to the site of La Corela with rugged orography and classified as natural habitat. As it travels through this site, the CO2 pipeline runs in parallel to the railway tracks, and then crosses the River Sil where it flows into the Bárcena Reservoir.
Then, and still heading eastwards, the CO2 pipeline runs to the north of the town of Congosto and the south of Santuario de la Virgen de la Peña, now in the Municipal Area of Congosto, where it follows the same layout on the land as the A-6, during several kilometres.
Table 4.15 Municipal limits of the transport pipeline trace
Figure 4.16 Pipeline layout
64 | |
OXYCFB300 COMPOSTILLA. CARBON CAPTURE AND STORAGE DEMOSTRATION PROJECT |
|
4.3.2 Layout General Description |
|
|
4.3.2.1 Capture Plant |
|
|
Initial Design |
|
|
Several alternatives were studied regarding the installation of the |
|
|
OXY-CFB-300 plant in different areas owned by ENDESA in order to |
|
|
find the most appropriate location. |
|
|
The approach to these alternatives took into account the fact |
|
|
that the space freed by Groups 1 (currently out of service) and 2 |
|
|
could be used and that the space occupied by Group 3 could not |
|
|
be used under any circumstances. The building of future groups |
|
|
6, 7 and 8 at the combined cycle plant was also taken into ac- |
|
|
count together with the new coal yard to the north of the current |
|
Figure 4.17 Route of the CO2 pipeline. |
||
|
one. |
|
4.3.1.3 CO2 Storage |
The conclusion, after studying the different alternatives, was that |
|
|
the most advantageous option was to use a plot next to groups 4 |
|
Location |
and 5. This would avoid the need to remodel or demolish existing |
|
The intended location of the surface CO2 injection facilities is also in |
structures and enable us to build a “greenfield” project. Further- |
|
the province of Leon, about 140 km from the power station, near the |
more, this proposal provides a larger plot, which makes it possible |
|
provincial border of León and Palencia. |
to optimize the relative position between assemblies in order to |
|
|
minimize large diameter pipe runs. |
|
The selected location is in the Duero River basin and the following |
|
|
was taken into account when selecting it: the results of the Ap- |
The advantages of this option are: |
|
praisal Program and certain socio-economic criteria, such as the |
An open plot of the correct size. |
|
low population density of the area (less than 10 inhabitants per km2 |
It minimizes the cost of power evacuation. |
|
|
It does not interfere with any expansion or future project. |
|
Storage will be in a deep saline aquifer from the Cretaceous period |
|
|
by means of a number of injection wells that have not yet been de- |
Therefore, in the draft project, the new group lies south of current |
|
fined, but that will range between a maximum of nine and a mini- |
Groups 4 and 5 and next to the power station’s 400 kV substation, |
|
mum of two. |
on land owned by ENDESA that are part of the municipality of Cubil- |
|
|
los del Sil. |
|
|
||
|
In this arrangement, the turbine building, boiler and precipitator |
|
|
are aligned northeast-southwest from the cooling tower of group |
|
|
IV, with the current 400 KV Substation to the west. The ASU and |
|
|
the CPU are placed to the west of the other new units, respecting |
|
|
the easement for the future Montearenas high voltage line. The |
|
|
cooling tower has been planned to the southeast of these facilities, |
|
|
next to the landfill where waste from the Power Plant’s Waste-Water |
|
|
Treatment Plant. The altitude of the area varies between +575.0 and |
|
|
+580.0. |
|
|
The general layout was developed during the stages that followed |
|
|
||
Figure 4.18 Location of the CO2 pipe and storage |
||
the Draft project, during the Pre-FEED and FEED phases, when |
||
|
||
|
aspects that could be improved were detected. The following de- |
|
|
scribes the considerations taken into account during the seven de- |
|
|
velopments that emerged. |
CHAPTER 4. FEED DESIGN
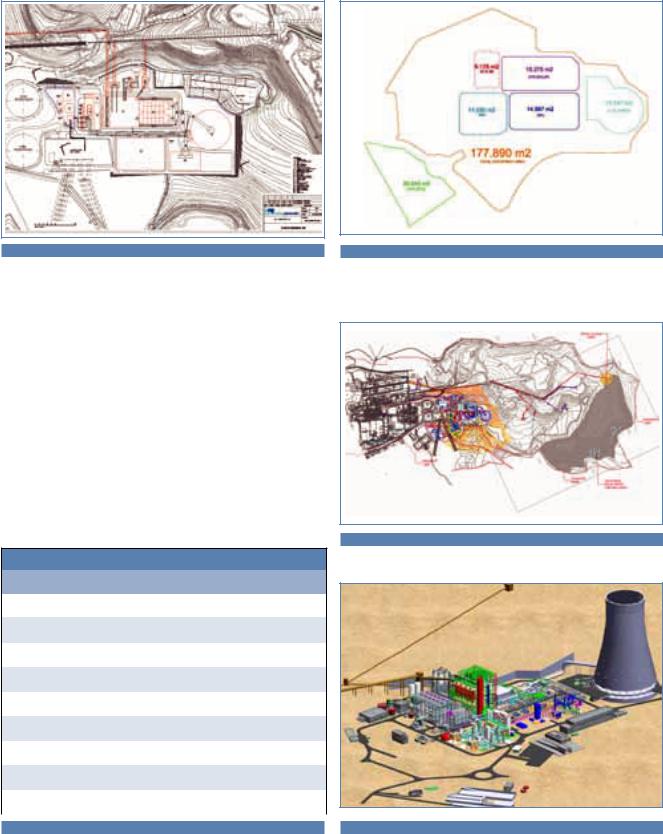
Figure 4.19 General Layout (preliminary)
Development in FEED Phase
In this phase, changes to and the relocation of the Wastewater Treatment Plant was studied, along with the complete design of OXY-CFB-300, including the coal handling system and its interconnection with the existing system southwest of the plant, the new NHIW landfill located north of the plant and the equipment to operate it and the final disposition of the areas assigned to the ASU and CPU.
The overall implementation was completed in the final phase with a detailed study of the drainage network, and the comprehensive treatment of effluents up to the authorized discharge point. This last phase takes into account the new dimensions of the six main modules, adapted to the latest designs for the Boiler, ASU and CPU, together with the optimization of common services.
COVERED AREAS
Description |
(m2) |
Steam turbine/electrical buildings |
5,175 |
Boiler and auxiliary building |
15,275 |
ASU |
11,530 |
CPU |
14,997 |
CW and Cooling tower area |
14,147 |
Wastewater Treatment Plant |
20 (-340) |
Sub-total (6 areas) |
81,464 |
Rest of areas |
116,766 |
Total covered area |
198,230 |
|
|
| 65
Figure 4.20 Areas of the overall implementation
Below is the final implementation and a 3D view of the plant.
Figure 4.21 Final implementation
Table 4.16 Layout covered areas |
Figure 4.22 3D view of the plant |
66 | |
OXYCFB300 COMPOSTILLA. CARBON CAPTURE AND STORAGE DEMOSTRATION PROJECT |
4.3.2.2 CO2 Storage Site
The injector wells will place approximately 1.5 km to the south of the appraisal well SD-4, in the southern side of the syncline. Three injector wells will be placed in a line perpendicular to the dip to optimize the sweep efficiency (contact area between the CO2 plume and the formation water) that would improve the dissolution and residual trapping as the plume moves towards the direction of the dip. Well spacing of 1000m was applied.
Injection facilities are responsible for distributing the flow of CO2 to the injection wells. Conceptually, their scope begins at the last position of the valves of the CO2 transport line, whose position is very close to the first injection well (well 19).
The 3 injection wells are aligned and, regarding the distribution of CO2, it was decided to maintain the 14” pipe design with identical characteristics to the rest of CO2 pipe. The derivations to each of the 3 wells branch out from this distribution line.
LOCATION OF INJECTION WELLS
Well No. |
UTM X |
UTM Y |
UTM Z |
11b |
329,249.23 |
4,712,410.24 |
901.67 |
12b |
330,356.14 |
4,712,136.69 |
877.14 |
19 |
327,808.67 |
4,712,920.78 |
943.90 |
|
|
|
|
Table 4.17 Location of injection wells
The wells have cut-off, retention, regulation, and bleed valves as well as flow meters to perform injection tasks in safety and in a controlled manner.
Figure 4.24 Lay-out of injection wells
4.3.3 Existing Installations
The location of Plant OXY-CFB-300 at the COMPOSTILLA Power Plant is adjacent to existing number 4 and number 5 coal fired, 350 MW, units. The implementation chosen as the most advantageous is to place the plant to the south of these groups, next to the power station’s 400 kV Substation, which would make it possible to share the following services with the existing plant.
4.3.3. 1 Coal Yard
The existing coal park that supplies the Compostilla power plant will be used. More specifically:
The current yard will supply the required ready-prepared mix to the new coaling system, as it has the capacity to prepare this mix which was established at 70% coke/30% coal in the design.
The interface of the new coaling system with existing facilities will be in the existing transfer tower.
The system will feature reception and storage silos for the readymade mix, screening and grinding system to achieve the required particle size and conveyor belts to the silos serving the new boiler. The new facility will be situated on the land available opposite the current coal yard transfer tower.
The figure below illustrates the planned layout.
Figure 4.23 Diagram of valves in the injection wells
The electric power for well 19 is supplied at low voltage from position 7 in the valve line while a medium voltage line (50 kVA) has been planned for wells 11b and 12b.
Figure 4.25 Planned layout of the coal yard
CHAPTER 4. FEED DESIGN |
| 67 |
4.4 OPERATION
4.4.1 Design Life Criteria
4.4.1.1 Generation and Capture Plant
The OXYCFB300 power plant has been designed considering a 25 years operational life and a maximum of 8000 h per year of effective operation. When facing design life criteria the following has been considered:
Issues coming from process fluids and process parameters (pressure-temperature) inherently related to ultrasupercritical power plants, considering also that the OXYCFB300 plant is coupled to CCS architecture.
Issues coming from expected plant operation.
4.4.1.2 Piping and Onshore Facilities
The facilities are designed for a life of 40 years. Where it is impractical for elements of the facilities to be specified with such a life (i.e. joints, bellows, valves trim ...) a maintenance routine will be planned.
4.4.1.3 CO2 Geological Storage
ENDESA has assumed the design life of the site and associated injection facilities for Duero Site to be 30 years but also able to extend the life 10 year more in order to align it with OXY-CFB-300 power plant and potential reservoir operating scenarios.
4.4.2 Operation Philosophy
4.4.2.1 Generation and Capture Plant
The OXY-CFB-300 plant features a Control System consisting of hardware, software and communications networks that constitute the human-machine interface and that controls the operation of the plant. The control system is based on digital technology, built from microprocessors.
The plant’s control system makes it possible to control all the systems that make up the plant, including the fluid bed boiler, ASU and CPU plants, turbine island and all its ancillary plants and systems, as well as monitoring and controlling CO2 transport and storage.
The control system comprises:
The Control Room equipment, which consists of operating stations to control and supervise the installation, as well as the necessary furniture for the comfort of the operators.
The Distributed Control System (DCS) itself consists of a set of servers, processors and signal and data acquisition cards installed in control cabinets, distributed throughout the plant. The DCS is the central control system that processes all the signals received from the plant and provides the operating consoles via the communications network.
The field instrumentation required to achieve the highest possible degree of automation.
The infrastructure required to operate the devices mentioned above (wires, pipes, trays...).
As for the design criteria governing the plant’s protection systems, 3 levels were indicated, according to the minimum redundancy requirements listed below. Reserve equipment, emergency stop buttons, safe positions, protection or alarm and permissive circuits have been planned:
Critical systems (Triple Redundant Measures).
To be used in critical loops. Critical control loops are understood to be those that, if taken out of service, will severely compromises the availability, security, operational capacity of the plant or may result in catastrophic damage to the plant’s main equipment or injuries to people or damage to the environment. This includes, for example, boiler and turbine shut-downs.
Integrity of the Plant and equipment shut-down (Double Redundant Measures).
Applicable to system and equipment controls that, if operated beyond the limits, could directly affect the operation of the plant, its production, or damage the equipment. In these cases, double redundancy will be used.
Non-critical systems (Simple Measures).
Applicable to systems for which any control failure can be readily rectified before the operation of the plant or its production is affected. An example of a system of this type is chemical dosage. For these systems, single control and monitoring equipment arrangements are acceptable. The failure of a single component can cause a failure or disruption of normal control and monitoring functions.
Start-up reserve equipment.
The components of equipment held in reserve, such as condensate pumps or boiler feed pumps, will remain on hold based on the provisions of a protection plan. The backup pump will startup, if in standby mode, when the pump that is in operation triggers an alarm or when one of the process parameters indicates that the pump in operation has failed. Once the backup pump has started-up, it will not stop automatically unless an operator causes it to stop / trip.
Emergency shut-down buttons.
Emergency shut-down buttons for major equipment or equipment that may cause damage will be installed in the main control room. This is applicable, for example, to the emergency shutdown of the steam turbine. The buttons will be wired directly to the end control device, which shall be independent of the SCD. The trigger buttons will be red and protected to prevent accidental activation.
Fail-safe design.
In general the plant will be failsafe. If the control signal or power supply is lost, the system and the control equipment will fail to a position that will not cause the failure / damage of any other equipment.
68 | |
OXYCFB300 COMPOSTILLA. CARBON CAPTURE AND STORAGE DEMOSTRATION PROJECT |
The alarm and protection circuits are de-energized when they trip. However, if shut-down protection is applied, the necessary redundancy will be implemented as well as the corresponding logical scrutiny (2oo3 ó 1oO2 voting logic) and the power supply will be ensured.
Protection or alarm circuits.
In general, an alarm is generated when the circuits open (contacts are normally closed or signals are normally energized) and the protection circuits will trigger when signals are not active.
Some of the plant’s control systems will be designed and certified for use in functional safety applications according to IEC 61508, with a SIL based on the study of their security requirements.
This applies, for example, to the boiler’s burner management system (BMS) and to the boiler protection system (BPS). In the case of components without SIL, if any, the Supplier will provide the reliability data needed to support the SIS analysis.
Safety systems will ensure the following:
On-line replacement of components.
Protection against unauthorized changes to the control program. Extensive diagnostic testing on systems with the capability to prepare reports.
Response time in milliseconds.
System error checking on all communication and control functions to eliminate false control commands and incorrect data.
•Conditions.
Conditions will be used for safety issues and for the sequential start-stop of system equipment. The conditions, timers and signals will be used in the most effective way to ensure optimum operation, the highest level of safety and reliability in any mode of operation and also to minimize the actions of operators and equipment failure.
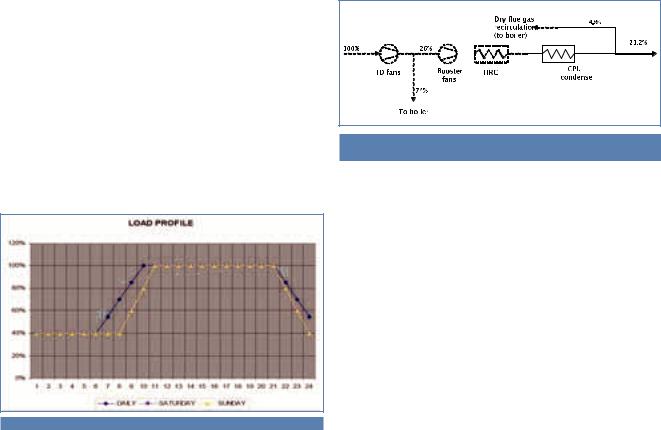
CPU Control Strategy
The theoretical CPU load profile is continuous 100% and 40% operation with two 100%-40% load shifts per day, as illustrated in the following Figure:
Figure 4.26 Theoretical CPU load profile
The OXY-CFB-300 facility is expected to participate in the Spanish electrical system Secondary regulation. Consequently, the CPU shall be configured to allow efficient operation under the resulting load profile.
OXY-CFB-300 operation under Secondary regulation is expected to result in load oscillations between 40% and 50% at night and between 75% and 100% during daytime; refer to “Power Plant Expected Schedule”,
Flue gas feed flow and resulting CO2 product flow are expected to continuously oscillate with load variations; as a minimum CO2 quality to be in accordance with requirements listed in Table 4. CPU to be configured to avoid wide variations in CO2 Product quality.
CPU to be configured to provide a continuous delivery of stable high pressure supercritical CO2 flow.
“CPU follows” philosophy: CPU operation depends on the gas flow exhausted from the boiler, which in turn depends of plant operating load. In no case shall CPU operation affect boiler operation. CPU rapid-re- sponse vent capacity shall be installed to prevent boiler fans from tripping (this is particularly important during boiler ramp-up transitory).
Predicted architecture of fans and blowers upstream the CPU is illustrated in the following Figure.
Figure 4.27 |
Equipment architecture at boiler exhaust-CPU inlet (by-pass |
lines and control dampers not shown)
Note: (Dashed: boiler scope; Plain: CPU scope; Numbers: gas percentages when operating at design load)
Distributed Control System (DCS)
The control system shall include the facilities and systems necessary to operate the plant.
The normal operational mode for the installation is automatic, with the possibility of manual controls from the operator stations.
The control system is based on the remote start-stop of the auxiliary mechanical elements from the operating stations. The boiler, steam turbine, CPU plant and ASU plant can be started and stopped remotely from the DCS operation stations in the control room. The plant can be started/stopped automatically from the highest hierarchical level by means of the plant’s start and stop sequences.
CHAPTER 4. FEED DESIGN |
| 69 |
Operating Modes
Due to the intrinsic nature of the plant as a “technology demonstration project”, plant operation will require a certain level of flexibility.
Normal Operation
The OXY-CFB-300 plant has been designed to operate as a base power station (i.e. permanently in operation), following the demand curve of the Spanish electricity system for a minimum of 25 years of effective operation. It has not been designed, however, for frequent start-ups and shut-downs.
Operation in Oxy-fuel combustion mode (“OXY” Mode): 100% Load
The plant has been designed and optimized for operation in “oxy” mode. It is in this mode for which the 100% load has been defined (matching “load” to “feedwater flow”) and that ensures a gross output of approximately 345 MWe at full load.
During operation in “oxy” mode, all the facility’s equipment must be operating, including the flue gas recirculation system (“FGR System”) and the flue gas heat recovery system (“HR System”) .
Additionally, an essential condition to operate in this OXY mode is having an adequate CO2 transport and injection capacity. If this capacity is not available, it would still be theoretically possible to operate, since the CPU has been designed with full venting capacity.
The average raw power at the alternator terminal expected at full power exceeds 340 MWe, according to the corresponding thermal balance. At full power, the steam turbine will operate at pure sliding pressure (VWO mode) and reach full power with steam pressures of 270.4 bar(a) upstream of the control valve in the HP section of the steam turbine and about 55.6 bar(a) upstream of the intercepting valves of the MP section of said steam turbine and maintaining a constant pressure of 0.042 bar (a) in the condenser.
Operation in Conventional Combustion Mode (“Air” Mode): 90%
Load
The plant has also been designed to operate continuously in “air” mode, to the point that it is in this mode when net power production is maximised (as the ASU and CPU do not consume electricity). Although the operational differences between “air” mode and “oxy” mode are significant, operating in conventional mode (with air as oxidizer in the boiler) will be strictly necessary in the event of any prolonged unavailability of the ASU and, to a lesser extent, of the CPU and of the CO2 transport/injection facilities. More specifically, boiler blowdown and the startup of the boiler up to 40% load (technical minimum) will be performed in “air” mode.
In detail, the differences in both modes of operation are:
In “air” mode, the steam flow at full load is substantially lower (approximately 10% lower) than that produced in “oxy” mode and, consequently, the gross power output will also lower than the design figure. Full load operation in air mode is limited by technical criteria; particularly flue gas speed.
When operating in “air” more, the ASU, CPU, the equipment linked to CO2 transport and the boiler flue gas recirculation system are not in operation and, therefore, the net yield and power increase.
The composition of the flue gases is very different. When operating in “air” mode, the density of the gas falls by approximately 24% (due to the dilution of CO2). In practice, this implies a reduction in the mass flow (maintaining constant velocity) and has an impact on the amount of gases to be recirculated in “oxy” mode (gas velocity must be constant). Additionally, the heat capacity of the said gases also decreases.
Fuel consumption at full load is lower in “air” mode. Consequently, the consumption of limestone and ash flow is also lower.
When operating in “air” mode, the HRS will not heat the O2 produced in the ASU, but the combustion air.
When operating in “air” mode, the gas flow actually discharged to the atmosphere is considerably increased (tripled). The temperature of the flow is similar in both modes, but the increase of the flow and the fact that it is discharged through the cooling tower affects the draugth of the tower.
Operational Flexibility
From the standpoint of operational flexibility, the plant has been designed to operate without restrictions either in “oxy” or in “air” mode and it is not necessary to interrupt the electrical power output in order to switch between modes. This feature provides a degree of flexibility from the viewpoint of electric power produced, as exportable net power is considerably higher when operating in “air” mode (12% higher, approximately, when operating at full load).
However, if due to reasons of demand (or other unavailability of any of the plant’s facilities) it is not necessary to operate at full load, the boiler, which is the most limiting element from the point of view of load variation, allows the range of flexibility listed in the Table below.
The continuous operating range is between 40 and 100% of boiler load, considering that the boiler load is equivalent to the flow of feedwater. Below 40% boiler load, permanent operation with solid fuel is not possible. This load level must only be achieved in “air” mode as the absence of a stable flow of flue gas makes flue gas recirculation impossible.