

01 POWER ISLAND / 04 CO2 capture / Compostilla-project-OXYCFB300-FEED-report
.pdf40 | |
OXYCFB300 COMPOSTILLA. CARBON CAPTURE AND STORAGE DEMOSTRATION PROJECT |
Health and safety studies (including what-if, HAZOP and HAZID studies)
Power supply, electrical systems, lightening, instrumentation, and controlling
Technical and procurement specifications for the 3 main procurement packages defined were issued; and RFQ for investment estimate released and concluded.
Although transport FEED was concluded in November 2011, deliverable submit to the European Commission EEPR Programme (D2.1 “know how on design criteria, materials selection and safety issues for captured CO2 transport by pipeline”) was delayed to include CIUDEN’s transport TDP conclusions and finally delivered in January 2012.
Storage FEED Tasks
Storage FEED tasks were highly constrained by Preliminary and Extensive Subsurface Characterization studies (Tasks 3.2 and 3.3 on DOW).
During 2010, activities were focused mainly on completing and reviewing previous works (2D seismic surveys, magnetoteluric surveys, hydro geological studies, existing wells and surveys reinterpretation, first geological models and soforth). At the end of 2010, all storage characterization plan was set and the screening and appraisal strategy was audited and verified independently by specialized services provided by Schlumberger Carbon Services.
During 2011, preliminary and extensive subsurface characterization campaigns were deployed, with the aim of completing the lack of data, parameters and information needed for completing the geological models:
Duero 3D seismic survey was released in June 2011. Due to social opposition at site, the campaing finalization was delayed from December 2011 to June 2012.
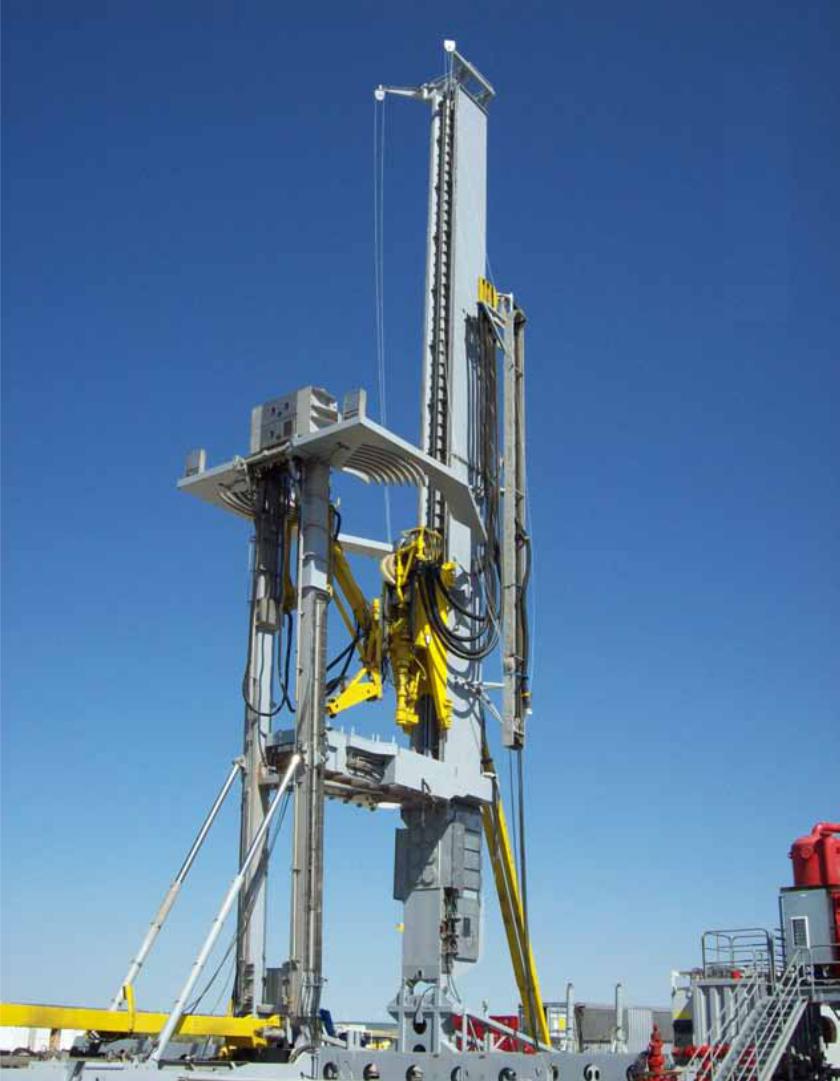
In late 2011, after the required engineering, permitting and procurement, drilling campaing of characterization wells at Duero site was released. 4 wells were drilled (3 with oil industry technology and a complementary one with mining technology). Little overlaps between wells were possible during this campaign due to the availability within budget of only one oil drilling rig with the required capacity to reach 2,000+ meters depths. Once each well drilled, site tests (injection, capacity, permeability, pressure), laboratory tests on core samples and data processing were performed. This massive campaign took one year long until late 2012.
As a result of what explained above, and considering that both all wells and 3D seismic were needed for completing the geological static and dynamic models, only in late 2012 the static and dynamic models were completely updated. Later on during 1st semester of
2013, all the information gathered has allowed to finalize the reservoir engineering, the injection and monitoring engineering, the risk analysis, all the specifications for the construction phase and the FEED engineering for the storage reservoir.
Critical Path
Critical paths are diverse and certainly not just a single one in such a complex programme. All the EEPR technological development activities performed during 2010, 2011, 2012 and early 2013 converged on a single clear and rigid-fixed milestone, the Final Investment Decision (FID) process start, scheduled for 1st April 2013 (accomplished). Close Out (CO) internal milestone for all the FEED activities is scheduled for June 2013 (accomplished). Between the Close Out (CO) and the Starting Point (SP) of all FEED activities, the main critical paths identified during management of the project and FEED Programme were the following:
Regarding Work Package 1 CO2 capture FEED studies, critical path went through the oxycfb combustion technology demonstration and validation. CFB boiler design and integration engineering during FEED were run in parallel, and directly connected to tests plan results (Canmet, Lagisza and CIUDEN’s capture TDP), especially during the boiler design validation in early 2013. Regarding Work Package 2 CO2 transport FEED studies, critical path went through the development of singular studies during 2011, in order to allow completing all the FEED studies during 2012. Nevertheless, CIUDEN’s transport TDP construction and tests plan delays finally had impact on the critical path during late 2012, delaying final conclusions on transport know-how until January 2013.
Regarding storage reservoir, critical path went through the site assessment and storage geological characterization activities, and later on through the reservoir assessment and FEED engineering. Delays on field campaigns (3D seismic survey due to social opposition and characterization wells drilling) had relevant impact on the delays of the project.
The most significant mitigation measures taken for avoiding or mitigating delays on the critical path were the following:
CHAPTER 3. FEED PROJECT MANAGEMENT |
| 41 |
WP 7 |
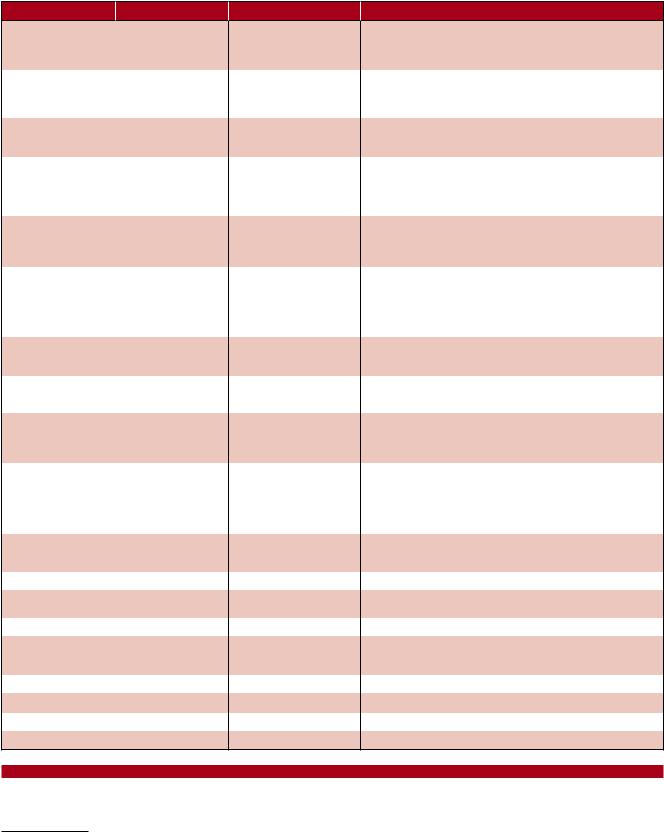
DELAYS MITIGATION |
PARTICIPANTE |
PURPOSE |
WP1 capt. FEED |
Contract ASU & CPU |
|
dedicated FEEDs by |
|
technologists |
WP1 capt. FEED |
Decoupling of boiler |
|
and capture FEED from |
|
tests plan results |
WP2 trans. FEED |
Speed-up preliminary |
|
alternative traces |
|
(From Mar-13 to Apr-12) |
WP2 trans. FEED |
Early deliver of initial |
|
document for starting |
|
permitting process |
|
earlier than scheduled |
|
(Jun-11 vs Oct-11) |
WP2 trans. FEED |
Decoupling of transport |
|
FEED from tests plan |
|
results |
WP3 stor. FEED |
Contract specialized |
|
audit services |
|
to validate |
|
characterization plan |
|
and screening and |
|
appraisal strategy |
WP3 stor. FEED |
Communication plan |
|
roll-out in the Duero- |
|
Sahagún site area |
WP3 stor. FEED |
Speed up plan |
|
for Duero site |
|
characterization wells |
WP3 stor. FEED |
Abandon Monegrillo- |
|
Ebro site campaign |
|
after first negative |
|
‘no-go’ results |
WP3 stor. FEED |
Progressive update of |
|
geomodels from field |
|
data |
WP3 stor. FEED |
Develop generic FEED |
|
specifications |
Annual Review Meeting |
29th September 2011 |
Technical Meeting |
29th September 2011 |
Technical Meeting |
lOth November 2011 |
Technical Meeting |
16th November 2011 |
Technical Meeting |
27th March 2012 |
Technical Audit |
26th April 2012 |
Technical Meeting |
12th June 2012 |
Technical Meeting |
12th June 2012 |
|
|
Lack of information during Apr-Sep 2011 for thermal cycle integration of ASU and CPU
Delays on tests plan due to delays on capture TDP construction and commissioning
Faster development of permitting process
Obtain objections to the project in an early stage of design
Delays on tests plan due to delays on transport TDP construction and commissioning
Doubts on fit for purpose characterization plan
Avoid 3D seismic campaign paralization (Jul11)
Delays on drilling campaign
Quick evaluation of the impact of first negative results on Monegrillo-Ebro site appraisal
Right integration of schedules and essays heuristics (drilling, site tests, laboratory tests, data processing and modeling contracts)
Lack of information for each injection and monitoring well
ENDESA, CIUDEN, FWEOy
ENDESA, FWEOy, others
ENDESA, FWEOy, others
ENDESA, FWEOy
ENDESA, FWEOy
ENDESA, CIUDEN, FWEOy
ENDESA, FWEOy
ENDESA, FWEOy, others
ASU & CPU FEEDs performed during 1st semester 2012 in time for all the capture FEED studies
Boiler FEED and capture FEED studies developed in parallel without significant modifications after results, avoiding greater chain delays
Administrative delays in permitting cancelled the expected positive effect (see next item)
Administrative delay of the Environmental Board surpassed float (8 months vs. 3 months max. legal period)
Transport FEED studies developed in parallel without significant modifications after results, avoiding greater chain delays
Avoid delays due to wrong planning and strategy
3D adquisition campaign restarted in Nov-11 after public engangement sessions and agreements signatures completion with land owners
Higher delays avoided. Prioritization of results needed for modeling
Focus resources on Duero campaign for higher speed up and delays recover
Avoid greater chain delays
Development of generic injection and monitoring wells specifications for CAPEX/OPEX preliminary estimation in Nov-12 (input required for risk analysis) prior to FEED finalizing
Review of the 2nd Interim Report with the EC
Meetings on technical and planning issues of Flexiburn work packages
Dynamic simulation model (APROS tool)
Oxy-CFB boiler design issues, ASU & CPU integration issues, design interactions with auxiliary systems and technical status of the project
Detailed Oxy-CFB boiler engineering and FEED issues
Technical audit of the project by the EC
Boiler FEED finalizing
ASU & CPU FEED finalizing
Table 3.1 Delays mitigation measures taken.
7 Work Package
42 | |
OXYCFB300 COMPOSTILLA. CARBON CAPTURE AND STORAGE DEMOSTRATION PROJECT |
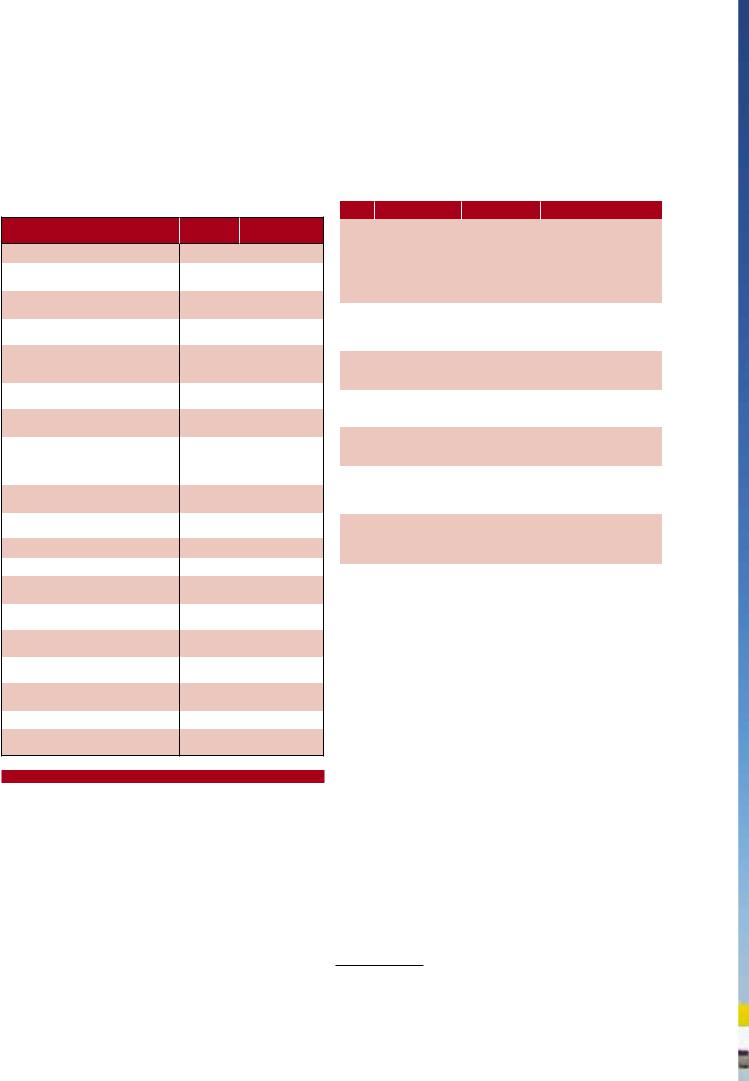
Next table shows original planned dates (as established on the DOW) and actual achieved dates for the deliverables that were connected to FEED Programme activities placed on the critical path of the project. Delays on these dates show evolution of the FEED schedule:
DELIVERABLE |
ORIGINAL |
ACTUAL DATE |
|
DATE |
ARCHIEVED |
||
|
D1.1 CANMET tests characterization
D1.2 TDP completed and ready to carry out the test program
D1.3 Tests results evaluation. Knowhow on oxy-firing in CFB
D1.4 Operating modes and control strategies of the integrated TDP
D1.5 Final Oxy-CFB integrated Plant Assessment for Demo project construction
D1.6 Capture economic and risk assessment analysis final conclusions
D1.7 FEED
D2.1 Know-How on design criteria, materials selection and safety issues for captured CO2 transport by pipeline
D2.2 Transport economic and risk assessment final conclusions
D3.1 Homogeneous and heterogeneous static earth model
D3.2 Dynamic earth model
D3.3 Storage site availability report
D3.4 Storage economic and risk assessment final conclusions
D4.1 Documents for Demo Plant authorization request
D4.2 Documents for Demo Plant local permitting request
D4.3 Document for pipeline authorization request
D4.4 Documents for storage authorization request
D6.5 FEED final conclusions
M1.5 Final Investment Decision (FID) process start
sep-10 |
nov-10 |
|
jun-11 |
dec-11 |
|
dec-11 |
dec-12 |
|
may-12 |
jan-13 |
|
may-12 |
feb-13 |
|
may-12 |
dec-12 |
|
nov-11 & |
nov-11 & nov-12 |
|
may-12 |
||
|
||
jan-12 |
dec-12 |
|
may-12 |
dec-12 |
|
mar-12 |
jan-13 |
|
mar-12 |
jan-13 |
|
may-12 |
jun-13 |
|
may-12 |
jun-13 |
|
mar-11 |
apr-11 |
|
mar-12 |
sep-12 |
|
nov-12 |
dec-12 |
|
nov-12 |
not yet archieved |
|
dec-12 |
sep-13 |
|
may-12 |
apr-13 |
|
|
|
Table 3.2 Original planned dates and actual dates.
Floating Tasks
Next table shows details on task identified as floating (with possibility of delay without delaying critical path of the project) during the analysis of the FEED Programme and final results:
WP 8 |
FLOATING TASK |
APPROACH |
RESULT |
WP1 |
Limestone tests |
Extend |
Limestone tests |
capt. |
at Canmet 1MWt |
limestone |
extended to include |
FEED |
|
testing |
different samples from |
|
|
|
a variety of sources |
|
|
|
near the site. Results |
|
|
|
improved without delays |
|
|
|
on critical path |
WP1 |
Lagisza plant |
Delayed due |
No impact on critical |
capt. |
460MWe tests |
to operational |
path |
FEED |
|
troubles at PKE |
|
|
|
plant |
|
WP1 |
HV grid |
Not speeded up |
No impact on critical |
capt. |
permitting |
|
path |
FEED |
activities |
|
|
WP1 |
Dissemination |
Partially |
No impact on critical |
capt. |
activities at FP7 |
delayed |
path |
FEED |
programme |
|
|
WP2 |
DNV pipetrans |
Delayed by |
No impact on critical |
trans. |
phase II initiative |
coordinator |
path |
FEED |
|
DNV |
|
WP2 |
CIUDEN’s TDP |
Delays due |
Float was surpassed |
trans. |
transport tests |
to failures |
and delayed critical path |
FEED |
|
between |
on transport FEED by 1 |
|
|
commissioning |
month |
WP3 |
Baseline reports |
Extended |
No impact on critical |
stor. |
|
campaign |
path |
FEED |
|
for better |
|
|
|
characterization |
|
|
|
|
|
Table 3.3 Floating tasks. |
|
|
|
|
|
|
|
8 Work Package
CHAPTER 3. FEED PROJECT MANAGEMENT |
| 43 |
4.1 Background. . . . . . . . . . . . . . . . . . . . . . . . . . . . . . . . . . . . . . . . . . . . 47
4.2 FEED Development . . . . . . . . . . . . . . . . . . . . . . . . . . . . . . . . . . . . . 47
4.3 Layout and Construction. . . . . . . . . . . . . . . . . . . . . . . . . . . . . . . . 62
4.4 Operation . . . . . . . . . . . . . . . . . . . . . . . . . . . . . . . . . . . . . . . . . . . . . 67
Access to and use of the information ¡n this document ¡s subject to the terms of the important notice at the front of the document

4
FEED Design

46 | |
OXYCFB300 COMPOSTILLA. CARBON CAPTURE AND STORAGE DEMOSTRATION PROJECT |
Index
4.1 Background. . . . . . . . . . . . . . . . . . . . . . . . . . . . . . . . . . . . . . . . . . . . . . . . 47
4.2 FEED Development . . . . . . . . . . . . . . . . . . . . . . . . . . . . . . . . . . . . . . . . . 47
4.2.1 Site Data and Conditions . . . . . . . . . . . . . . . . . . . . . . . . . . . . . . 47
4.2.1.1 Site Conditions . . . . . . . . . . . . . . . . . . . . . . . . . . . . . . . . . 47
4.2.1.2 Fuel . . . . . . . . . . . . . . . . . . . . . . . . . . . . . . . . . . . . . . . . . . . 47
4.2.2 Process Systems Description. . . . . . . . . . . . . . . . . . . . . . . . . . 48
4.2.2.1 Generation and Capture Plant . . . . . . . . . . . . . . . . . . . 48
4.2.2.2 Piping and Onshore Facilities. . . . . . . . . . . . . . . . . . . . 53
4.2.3 Storage Subsurface Characterization and Reservoir Engineering 56
4.2.3.1 Reservoir Characterization . . . . . . . . . . . . . . . . . . . . . . 56
4.2.3.2 Conclusions: Reservoir Viability . . . . . . . . . . . . . . . . . 57
4.2.3.3 Generic Design of the Injectors and the Monitoring Wells. 58
4.2.3.4 Storage FEED Engineering . . . . . . . . . . . . . . . . . . . . . . 60
4.2.4 Overall Project Data . . . . . . . . . . . . . . . . . . . . . . . . . . . . . . . . . . . 61
4.2.4.1 Performance . . . . . . . . . . . . . . . . . . . . . . . . . . . . . . . . . . . 61
4.3 Layout and Construction. . . . . . . . . . . . . . . . . . . . . . . . . . . . . . . . . . . . 62
4.3.1 Site Location . . . . . . . . . . . . . . . . . . . . . . . . . . . . . . . . . . . . . . . . . 62
4.3.1.1 Capture. . . . . . . . . . . . . . . . . . . . . . . . . . . . . . . . . . . . . . . . 62
4.3.1.2 Transport . . . . . . . . . . . . . . . . . . . . . . . . . . . . . . . . . . . . . . 62
4.3.1.3 CO2 Storage . . . . . . . . . . . . . . . . . . . . . . . . . . . . . . . . . . . 64
4.3.2 Layout General Description . . . . . . . . . . . . . . . . . . . . . . . . . . . . 64
4.3.2.1 Capture Plant . . . . . . . . . . . . . . . . . . . . . . . . . . . . . . . . . . 64
4.3.2.2 CO2 Storage Site . . . . . . . . . . . . . . . . . . . . . . . . . . . . . . . 66
4.3.3 Existing Installations . . . . . . . . . . . . . . . . . . . . . . . . . . . . . . . . . . 66
4.3.3. 1 Coal Yard . . . . . . . . . . . . . . . . . . . . . . . . . . . . . . . . . . . . . . 66
4.4 Operation. . . . . . . . . . . . . . . . . . . . . . . . . . . . . . . . . . . . . . . . . . . . . . . . . . |
67 |
|
4.4.1 |
Design Life Criteria . . . . . . . . . . . . . . . . . . . . . . . . . . . . . . . . . . . . |
67 |
|
4.4.1.1 Generation and Capture Plant . . . . . . . . . . . . . . . . . . . |
67 |
|
4.4.1.2 Piping and Onshore Facilities . . . . . . . . . . . . . . . . . . . . |
67 |
|
4.4.1.3 CO2 Geological Storage . . . . . . . . . . . . . . . . . . . . . . . . . |
67 |
4.4.2 Operation Philosophy . . . . . . . . . . . . . . . . . . . . . . . . . . . . . . . . . |
67 |
|
|
4.4.2.1 Generation and Capture Plant . . . . . . . . . . . . . . . . . . . |
67 |
|
4.4.2.2 CO2 Transport Pipeline and Storage. . . . . . . . . . . . . . |
70 |
|
4.4.2.3 Full System Metering and Monitoring Concept. . . . |
.71 |
|
4.4.2.4 Full System Leak Detection and Venting Philosophy |
72 |
List of Figures
Figure 4.1 Schematic of a Flexi-Burn® CFB power plant . . . . . . . . . . . . 48 Figure 4.2 Block flow diagram of the current boiler concept (simplified) 48 Figure 4.3 Powerplant fan concept (simplified) . . . . . . . . . . . . . . . . . . . . 49 Figure 4.4 Water-steam circuitry . . . . . . . . . . . . . . . . . . . . . . . . . . . . . . . . . 49 Figure 4.5 OXYCFB300 CPU simplified process scheme. . . . . . . . . . . . .51 Figure 4.6 OXYCFB300 ASU simplified process scheme. . . . . . . . . . . . .51 Figure 4.7 Single Line Drawing of the Capture Plant (1) . . . . . . . . . . . . . 53 Figure 4.8 Single Line Drawing of the Capture Plant (2). . . . . . . . . . . . . 53 Figure 4.9 Duero Basin with old, existing wells (green well location:
Leon-1, Leon-1BIS, Pena-1, El Campillo-1, Villameriel-1), and newly drilled wells (yellow and cyan well locations: SD-1, SD-2, SD-3, SD-4, SDE-3). . . . . . . . . . . . . . . . . . . . . . . . . . . . . . . . . . . . . . . . . . . 56
Figure 4.10 Static model (orange polygon). Seismic surveys are plotted in purple, old wells in green, new wells in yellow
(deep wells) or blue (shallow wells); red polygons are ENDESA permit boundaries. . . . . . . . . . . . . . . . . . . . . . . . . . . . . . . . . . . . . . . . . . . . 57
Figure 4.11 Dynamic model grid cells, top of Utrillas . . . . . . . . . . . . . . . . 57 Figure 4.12 Wellhead and the X-mas tree . . . . . . . . . . . . . . . . . . . . . . . . . . 60 Figure 4.13 CO2 injection Block Flow Diagram (preliminary data) . . . . 60 Figure 4.14 Location of the OXYCFB300 plant . . . . . . . . . . . . . . . . . . . . . 62 Figure 4.15 General description of the route . . . . . . . . . . . . . . . . . . . . . . . 62 Figure 4.16 Pipeline layout . . . . . . . . . . . . . . . . . . . . . . . . . . . . . . . . . . . . . . . 63
Figure 4.17 Route of the CO2 pipeline. . . . . . . . . . . . . . . . . . . . . . . . . . . . . . 64 Figure 4.18 Location of the CO2 pipe and storage. . . . . . . . . . . . . . . . . . . 64
Figure 4.19 General Layout (preliminary). . . . . . . . . . . . . . . . . . . . . . . . . . 65 Figure 4.20 Areas of the overall implementation . . . . . . . . . . . . . . . . . . . 65 Figure 4.21 Final implementation . . . . . . . . . . . . . . . . . . . . . . . . . . . . . . . . . 65 Figure 4.22 3D view of the plant . . . . . . . . . . . . . . . . . . . . . . . . . . . . . . . . . . 65 Figure 4.23 Diagram of valves in the injection wells. . . . . . . . . . . . . . . . . 66 Figure 4.24 Lay-out of injection wells . . . . . . . . . . . . . . . . . . . . . . . . . . . . . 66 Figure 4.25 Planned layout of the coal yard. . . . . . . . . . . . . . . . . . . . . . . . 66 Figure 4.26 Theoretical CPU load profile . . . . . . . . . . . . . . . . . . . . . . . . . . 68 Figure 4.27 Equipment architecture at boiler exhaust-CPU inlet
(by-pass lines and control dampers not shown) . . . . . . . . . . . . . . . . . 68 Figure 4.28 Designed load profile for the power station. . . . . . . . . . . . . 70 Figure 4.29 Secondary regulation profile . . . . . . . . . . . . . . . . . . . . . . . . . . 70
List of Tables
Table 4.1 Environmental conditions at the plant site . . . . . . . . . . . . . .47 Table 4.2 Fuel composition according to plant design. . . . . . . . . . . . .47 Table 4.3 Location of valve positions . . . . . . . . . . . . . . . . . . . . . . . . . . . .54 Table 4.4 Size, material and thickness selected for the pipeline . . . .54 Table 4.5 External coating standard thickness for the pipeline . . . . .55 Table 4.6 Medium and Low Voltage Electrical feeders
for pipeline valve positions . . . . . . . . . . . . . . . . . . . . . . . . . . . . . . . . . . .56 Table 4.7 General assumptions for the injector well . . . . . . . . . . . . . .58 Table 4.8 Specifications of the CO2 composition. . . . . . . . . . . . . . . . . .58 Table 4.9 Summary of completion specifications for injection wells.59 Table 4.10List of expected measurements in the monitoring well . . .59 Table 4.11 Casing program for the generic monitoring well . . . . . . . . 60
Table 4.12 CO2 Balance. . . . . . . . . . . . . . . . . . . . . . . . . . . . . . . . . . . . . . . . . 61 Table 4.13 CO2 parameters . . . . . . . . . . . . . . . . . . . . . . . . . . . . . . . . . . . . . 61 Table 4.14 Transport and Storage Planned and Actual values
comparison at the end of Phase I . . . . . . . . . . . . . . . . . . . . . . . . . . . . . 61 Table 4.15 Municipal limits of the transport pipeline trace. . . . . . . . . .63 Table 4.16 Layout covered areas . . . . . . . . . . . . . . . . . . . . . . . . . . . . . . . .65 Table 4.17 Location of injection wells . . . . . . . . . . . . . . . . . . . . . . . . . . . 66 Table 4.18 Operational flexibility of the Boiler . . . . . . . . . . . . . . . . . . . . .70 Table 4.19 Current estimated injection wells operating range. . . . . . . 71

CHAPTER 4. FEED DESIGN |
| 47 |
4.1 BACKGROUND
In 2007 Foster Wheeler and ENDESA Generación reached an agreement for the development of Oxy-fuel combustion technology in circulating fluidized beds, in which it was agreed to develop a feasibility study that would become the basis for the development of the CO2 Capture and Storage demo plant concept, (CCS) OXYCFB300.
The feasibility study performed in 2008 was for a fictitious greenfield power plant of 500 MWe (gross) situated in Spain. Later on, this feasibility study was updated for 300 MWe (gross) size. Initially, specifications were provided for two different sites (Compostilla and Teruel Power Stations). It was later decided to use the Compostilla specifications, while performance estimates with other fuels and at alternate conditions may be carried out in subsequent studies.
Supercritical parameters were selected after considering that the steam cycle efficiency should be as high as possible owing to the energy spent on oxygen production and CO2 capture. The involvement of industrial gas technologists was required for both realistic cost estimates and supporting technical data for the cryogenic Air Separation Unit (ASU) and CO2 Compression & Purification Unit, (CPU).
Since the feasibility study, the concept evolved so that instead of studying air-fired CFB and oxy-fuel CFB separately, it was decided to study a dual firing concept. This means that the Flexi-Burn® CFB boiler (and plant in general) will be able to operate in air firing mode as well as in oxy-combustion mode without making modifications to it. It was assumed that oxy-fuel combustion with CCS would be the primary operation mode, while air firing would be needed for start-up and as back-up e.g. in case of the unavailability of CO2 transport and storage facilities.
For storage development, ENDESA Generación has been working at preselected safe CO2 storage sites in Spain from December 2005 to 2008. In this way, a screening and ranking framework (SRF) has been developed to evaluate potential geological carbon dioxide storage sites on the basis of capacity, health, safety, and environmental (HSE) risks arising from CO2 leakage. Therefore, several technical and social-economic criteria were defined. Six different potential sites have been evaluated. Based on the results developed under previous projects, two possible saline aquifers were selected to store CO2 from the OXY-CFB-300 plant,“Duero Site” and “Ebro Site”.
Consequently, after the pre-selection works had been performed, administrative permits for the exploration of the two selected sites were authorized and the corresponding CO2 storage exploration permits were granted. Legal administrative resolutions were issued for ENDESA Generación, S.A. from CASTILLA Y LEÓN and ARAGON regional governments in August, 2008. During 2009-2010; a number of tendering processes were organised to perform selection, pre-characterization and characterization tasks based on the previous results achieved.
4.2 FEED DEVELOPMENT
4.2.1 Site Data and Conditions
4.2.1.1 Site Conditions
ENVIRONMENTAL CONDITIONS
Barometric pressure expected |
948 mbar |
Temperature |
|
Average (design teams) |
12.6 °C |
Absolute maximum (equipment structural design) |
45 ºC |
Absolute minimum (equipment structural design) |
-13 ºC |
Relative humidity (annual average) |
66% |
|
|
Table 4.1 Environmental conditions at the plant site
4.2.1.2 Fuel
Fuel included in the design
The following table shows the characteristics of the fuel mix on which the design and warranty of the boiler is based.
DESIGN MIX–COAL-PETCOKE (70/30% WEIGHT)
|
|
DESIGN |
General (as received; percentages by weight) |
|
|
Carbon |
% |
61.03 |
Ash |
% |
22.73 |
Total humidity |
% |
8.19 |
Sulphur |
% |
2.57 |
Hydrogen |
% |
2.31 |
Oxygen |
% |
2.09 |
Nitrogen |
% |
1.08 |
LHV |
MJ·kg-1 |
23,059 |
|
|
|
Ash Fusibility (in reducing atmosphere) |
|
|
Softening temperature |
ºC |
> 1100 |
|
|
|
Table 4.2 Fuel composition according to plant design
48 | |
OXYCFB300 COMPOSTILLA. CARBON CAPTURE AND STORAGE DEMOSTRATION PROJECT |
Other fuels
In addition to the fuel included in the design, the boiler is capable of operating by burning only coal (anthracite with high percentage of ash). There is an entire range of coal types and coal blends / with different characteristics and calorific features.
Biomass may be included in the fuel mix: If required, the biomass shall consist only of wood pellets. The average properties shown in the table below are based on the analysis of a wood pellet sample. According to preliminary analyses, the allowable share of wood pellet co-firing with the design fuel blend shall be limited as follows:
-If the blend consists of anthracite and petcoke, the maximum share of wood pellets is 10 % (on LHV basis).
-If the blend consists of anthracite only, the maximum share of wood pellets is 20 % (on LHV basis).
Auxiliary Fuel
The plant uses light gas oil as auxiliary fuel, which will be used as: Fuel for the emergency diesel generators (to ensure the safe shutdown of the entire plant).
Fuel to power the diesel pump of the fire-fighting water system. Fuel to feed the diesel fuel pump that sends water to the boiler during emergencies (plant “black-out”).
Fuel for start-ups.
Limestone
Limestone of high reactivity is preferred for sulphur oxide removal.
4.2.2 Process Systems Description
4.2.2.1 Generation and Capture Plant
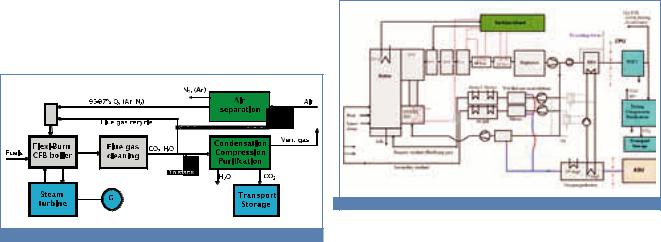
A simplified process flow scheme of a power plant designed for both air-fired and oxygen-fired operation modes is shown below. It consists of an air separation unit (ASU), a high-efficiency steam cycle utilizing Foster Wheeler Flexi-Burn® CFB boiler technology and a CO2 processing unit (CPU).
Figure 4.1 Schematic of a Flexi-Burn® CFB power plant |
Among all the equipment included in the power plant, the oxy-fired CFB boiler will be the first-of-its-kind ever designed and erected. No
large oxy-fired boiler has ever been operated and, within the OXYCFB300 power plant it will be responsible, not only for producing a stable steam flow that guarantees the expected electric power output, but also for producing a stable flue gas flow from which the CO2 can be captured.
Acknowledging that the CFB boiler is the key component of the plant, the power cycle has been engineered to match its performances. By the following, both the boiler and the power cycle systems (including solid handling systems) are briefly presented.
Boiler Process Description
The OXYCFB300 plant CFB boiler has been designed for stable operation in air combustion and oxyfuel combustion (O2 rich combustion) within the specified load range and with smooth transitions between the two modes. However, only the later mode of operation is of interest from a CO2 capture point of view since the flue gas flow is not rich enough in CO2 when the boiler operates under standard air combustion. For oxy-fuel combustion, which is then the primary operation mode, low purity oxygen produced in the ASU is mixed with recycled flue gases, creating a N2-lean mixture that is used as oxidant in furnace combustion instead of air. The absence of nitrogen in the oxidant produces a flue gas stream with a high concentration of CO2, largely easing its separation with equipment of reasonable size.. In the air firing mode, which serves to risk mitigation purposes but may also be applied during high load demand, the ASU and the CPU are out of service (or in stand-by) and the plant is operated like a conventional power plant, leading flue gases to the atmosphere.
The following figure provides a sketch of the boiler concept in a block-diagram manner, the equipment needed for air-operation being represented in light grey.
Figure 4.2 Block flow diagram of the current boiler concept (simplified)
The boiler has been conceived so as to maximize its efficiency when operating in oxy-mode. The design intends to recover as much waste heat from the flue gas as possible. To do so, the following specific equipment has been included in the design:
CHAPTER 4. FEED DESIGN |
| 49 |
A high-pressure economizer (HP Eco) is located after the conventional economizer in flue gas path. In the water-steam circuit it is located upstream of the normal economizer, in parallel with HP feedwater heaters. HP Eco is active regardless of operation mode.
A low-pressure economizer (LP Eco) utilizes remaining flue gas heat and cools the gas to a temperature considered optimal for filtration and flue gas recirculation, approx. 160 °C in oxy mode. LP Eco heats up a mixture of condensate extracted upstream of the deaerator and low pressure feed water from feed water pump extraction. It is active regardless of the operation mode.
A heat recovery system (HRS) consisting of a plastic tubular heat exchanger with water as the heat transfer medium and water- oxygen/water-air heat exchangers is used to transfer residual heat from the flue gas flow going to the CPU (in OXY-mode) to the incoming fesh oxidant stream (O2 in oxy-mode and atmospheric air in air-mode). The HRS treats the whole exiting flue gas stream in oxy mode but only part of it in air mode. This is to save investment cost: a full size HRS would increase efficiency in air mode but not change it in oxy mode, which is defined as the main operation mode of the boiler.
In oxycombustion operation, downstream of the baghouse (upstream of the HRS) the flue gas flow is split and most of the flow is mixed with the incoming flow of low purity O2 coming from the ASU and preheated against power cycle water in a dedicated exchanger. Two (2) oxidant streams are fed to the furnace: the primary and secondary oxidants. Both streams are heated against power cycle steam in dedicated steam coil air heaters (SCAH), thus further increasing boiler efficiency.
Boiler fan concept is illustrated in the following figure. Dual-purpose equipment (for air and oxy operation) has been chosen. For the RFG fans, the gas inlet is either from outside or from the recirculation gas take-off point, and in change-over periods the inlet gas can be a mixture of air and flue gas.
Figure 4.3 Powerplant fan concept (simplified)
The water and steam side design in based on the low mass flux BENSON once-through technology. This technology is ideal for CFB conditions as it utilizes vertical furnace tubes, opposed to spiral wound tubing used in many other once-through designs. For the CFB technology the vertical tubing is the normal arrangement in natural circulation designs and hence the similar design can now be used for supercritical, once-through boilers. The technology has been in commercial operation since 2009 (Lagisza, 460 Mwe). Additionally, five new boilers are under construction.
The heat fluxes in CFB and boilers are low and uniform compared to PC boilers and therefore the required water mass fluxes are rather low. The low heat fluxes allow also using normal smooth tubes in furnace walls with a mass flux of 550-650 kg/m2s at full load. Due to low and uniform heat flux of the CFB furnace and the BENSON low mass flux technology, the fluid temperatures are very uniform after evaporator in different load conditions.
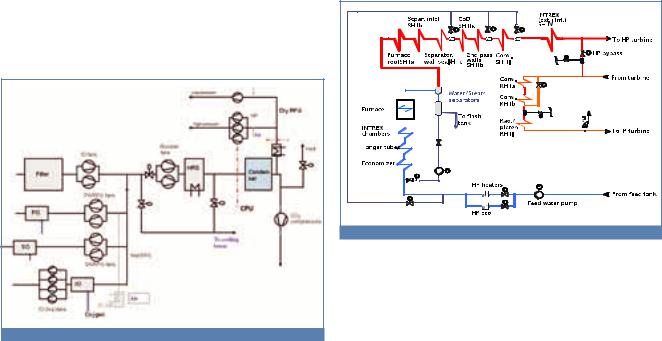
The following figure illustrates the current water/steam circuitry of the boiler. The feed water is pumped from the deaerator and divided in two parallel streams, one leading to conventional feedwater heaters using steam extracted from the turbine, while the other one leads to a HP economizer(a flue gas-water heat exchanger placed in the boiler flue gas stream). Next, the parallel feed water streams are combined into one that enters the boiler at a temperature of 290 °C for preheating in a bare tube economizer. Thereafter water is taken to water-cooled hanger tubes and the enclosure walls of the INTREX fluidized bed heat exchangers, and finally to distribution headers of the evaporator (furnace) walls. The water is heated in the evaporator wall tubes and eventually converted to superheated steam before the evaporator outlet.
Figure 4.4 Water-steam circuitry.
Dry steam from the evaporator is led to the furnace roof, which is the first part of superheating system. After the furnace roof, steam is taken to the four steam-cooled solids separators, which are formed of gas tight membrane walls covered with a thin refractory lining with high heat conductivity. The first water spray desu-