

Ebooki / SGT-Volume1
.pdfSEARL GLOBAL TECHNOLOGIES – MATHS – STATISTICS: |
DOC-M1-1-160. |
Searl knowledge 1946-1968:
Page 160©

SEARLTM GLOBAL TECHNOLOGIES – MATHS – STATISTICS: |
DOC-M1-1-161. |
Searl knowledge 1946-1968:
Searl states as from today, Tuesday 11th August 2015: all legal documents will carry the Trade Mark behind my name as show above. Searl say that some pages carry half width of type with the other half carry photo information of what the companies have done, doing and planning, which shall continue.
Establish, it may be used to make comparisons with the starting base. Searl say that generally, the starting base is given the value of 100; hence, if the current price index number is 132, the initial index has increased by 32 points since the initial index base was established. Searl say that a significant and increasingly important use of index numbers is their use as the basis for wage negotiations as well as helping to formulate changes in government economic policy, such as changes in direct and/or indirect taxation.
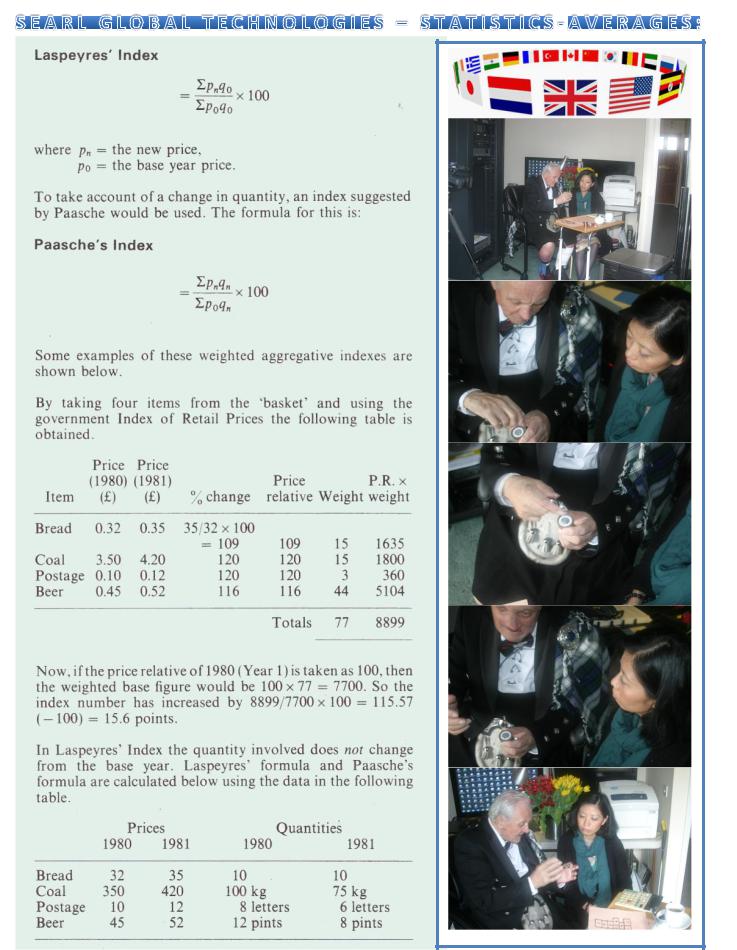
Searl say that the Index of Retail Prices monitors the percentage change in the spending of a typical family on foods and services. The method of construction and calculation of the RPI can be appreciated more easily by considering a very large and representative ‘basket’ of goods and services in January of each year, and then comparing the cost of this same ‘basket’ in each of the following 12 months. Searl quote this because SEARL GLOBAL TECHNOLGIES responsibility would have to see food and drink was available in the different factories within its organization. The percentage increase in the total cost since January can then be calculated. Searl say that the ‘basket’ is changed each January to ensure that it is as up-to-date as possible, but the percentage changes in the cost of successive ‘baskets’ are linked together in order to produce a continuous series of percentage changes since the RPI was created.
Degree of importance:
Searl agrees that some items in the ‘basket’ account for a much greater percentage of the family budget than others. Searl say that for an example, most households spend far more on bread and meat than they do, say, on soap. Searl points out an important issue here; therefore, a 10% increase in the cost of bread will clearly add more to the cost of the ‘basket’ than a 10% increase in the cost of soap. Searl say that to allow for this relative importance of the various items in the ‘basket’, each percentage change in price is given a weight to represent its relative importance in the household expenditure of the previous 12 months. The percentage changes in price are then multiplied by these weights before being averaged.
Family Expenditure Survey:
Searl say that the groups that comprise the goods and services in the RP1 are derived from the results of the continuous Family Expenditure Survey. Searl states that this survey is designed to provide information for a number of purposes, only one of which is the weighting basis for the RPI. The survey Searl say covers a sample of households throughout the UK. Searl understand this as he had received such surveys over the years. Searl say that there are, however, two groups or classes of households which are not represented.
1.Households with a total income above a predetermined level:
2.Households in which at least three-quarters of the total income in derived from social security payments, pensions and other transfer payments.
Searl confirms that excluding these classes, each year about 10,000 households provide detail records of their individual expenditures. Searl understand that these records are then summarized and used for weighting purposes. On the next page Searl will present what weighting means. Searl survey return just had his name, address and date of birth and all questions marked N/A; not one question actually applied to Searl, as Searl could not afford such luxuries as those, due to the fact that he was trying to replacing his stolen goods, took all his money.
Page 161©

SEARLTM GLOBAL TECHNOLOGIES – MATHS – STATISTICS: |
DOC-M1-1-162. |
Searl knowledge 1946-1968:
Page 162©

SEARLTM GLOBAL TECHNOLOGIES – MATHS – STATISTICS: |
DOC-M1-1-163. |
Searl knowledge 1946-1968:
Page 163©
SEARLTM GLOBAL TECHNOLOGIES – MATHS – STATISTICS: |
DOC-M1-1-164. |
Searl knowledge 1946-1968:
Page 164©

SEARLTM GLOBAL TECHNOLOGIES – MATHS – STATISTICS: |
DOC-M1-1-165. |
Searl knowledge 1946-1968:
Page 165©

SEARLTM GLOBAL TECHNOLOGIES – MATHS – STATISTICS: |
DOC-M1-1-166. |
Searl knowledge 1946-1968:
Engineers have come a long way in flight technology, some of which have now gone. We are also planning to change flight technology to that of the DISC shape craft termed the I-G-V.
Page 166©

SEARLTM GLOBAL TECHNOLOGIES – MATHS – STATISTICS: |
DOC-M1-1-167. |
Searl knowledge 1946-1968:
Predictions of future increases. As Searl understands it; as an example, in the mid-seventies, some labour relations agreements contained escalator clauses and threshold levels in an attempt to nullify the damaging financial effect which the sudden change in house prices caused. Searl say that the use of trend analysis techniques is becoming increasingly important. One such method is that of moving averages;
MOVING AVERAGES:
Searl explains that a moving average may be defined as the average of a consecutive set of n observations, where n is some convenient number. Searl say that if trends are to be detected or an interest is shown in the general pattern of growth of some particular factor, then a moving average (which is an artificially construction time series) may well be easier to understand and construct than mathematical equations of time series. Searl agree that in a moving average each annual (or monthly, weekly or even hourly) figure is replaced by the mean of both itself and those values corresponding to a number of preceding and succeeding periods. Searl say that in a five-year moving average, each annual figure is replaced by a mean which is calculated by adding the value of the year under examination, Sear say that those values of the two preceding years and those values of the two succeeding years. Searl states that the longer the period of time over which the average is calculated, the smoother the curve will be when a number of these averages are plotted against the time scale. Searl claims: that essentially a moving average tends to ‘smooth out’ the peaks and troughs which occur as a result of cyclical, seasonal or other periodic variations. Searl feels that the factor under consideration might be profit, turnover or sales per employee, production levels of S.E.G.s or hospital bed utilization, in fact Searl say almost anything which can be quantified and not necessarily on an annual basis. Searl appreciate that the greater the value of n, the smoother the graph becomes, but Searl warns you with the disadvantage that the indication of the trend becomes less noticeable.
Searl say that a graph on which a number of variable values are plotted against time is called a historigram
(i.e. a historical record, not to be confused with a histogram). Searl points out that if the averages are calculated over an even number of periods, say, 8 years or 12 months, then the problem arises that the moving average will have to be plotted between successive years or months. Searl suggest overcoming this difficulty, it is usual to ‘centre’ the values by calculating a two year moving average at least initially.
Example:
Searl say that the directors of SEARL MAGNETICS CORPORATION are considering diversification as part of their corporate strategy. Searl say however, they are unsure of the degree of diversification which might be considered prudent and they therefore wish to have an idea of the trend of their S.E.G.s sales. Searl say that the following figures are available from which five-year moving averages can be plotted.
Page 167©

SEARLTM GLOBAL TECHNOLOGIES – MATHS – STATISTICS: |
DOC-M1-1-168. |
Searl knowledge 1946-1968:
=====================================
|
SEG sales |
Five year |
Five year |
Year |
000s |
moving total |
moving average |
=====================================
1965 |
15.6 |
|
|
1966 |
16.8 |
|
|
1967 |
17.2 |
82.9 |
16.58 |
1968 |
17.0 |
85.7 |
17.14 |
1969 |
16.3 |
86.2 |
17.24 |
1970 |
18.4 |
88.6 |
17.72 |
1971 |
17.3 |
89.4 |
17.88 |
1972 |
19.6 |
91.5 |
18.26 |
1973 |
17.8 |
93.6 |
18.72 |
1974 |
18.2 |
96.5 |
19.30 |
1975 |
20.7 |
95.2 |
19.04 |
1976 |
20.2 |
95.0 |
19.00 |
1977 |
18.3 |
94.7 |
18.94 |
1978 |
17.6 |
|
|
1979 |
17.9 |
|
|
==================================
Searl technology has started R&D here in San Diego, the land of the future technology. We shall win because we are determined.
Searl say that the two values at the end of the series are lost, which is a slight disadvantage, particularly when the series is very short. Figure 6S shows the graph which produced when the moving average and the original data are plotted against the time.
Figure 6S: Searl Magnetic Corporation five year moving averages.
Searl say having determined the trend, another technique which can be used in an attempt to predict the values associated with future time periods is that of extrapolation. Searl say the basic problem associated with extrapolating is in assuming what the prevailing economic forces will be during the period under consideration. However, Searl mathematical models can be built which take uncertainty into account. Searl say these will be discussed more fully in another book or chapter within this document.
Page 168©

SEARLTM GLOBAL TECHNOLOGIES – MATHS – STATISTICS: |
DOC-M1-1-169. |
Searl: knowledge 1946-1968: Legal: SEARL NO: 013787346: Legal: SEARLE NO: 013787451 – Beware!
Dispersion:
Searl say that the measure of location: Mean, Median and Mode: which Searl has already discussed earlier in this document provides single numbers which represent whole sets of data. However, Searl say, a major characteristic of any distribution is its dispersion or spread about a central value such as the arithmetic mean. Searl shows that curve A is spread more widely than curve B, although the mean of each distribution is the same.
Variable values
Figure P7S: Dispersion about the same mean:
Searl points out that it is frequently to his understanding that it’s necessary to measure the degree of the dispersion, i.e. to attempt to determine the variability of the population.
Example:
Searl say let us suppose that a number of people are considering investing in one of four Companies namely: Searl Global Technologies; Searl Aerospace Corporation; Searl Magnetics Corporation; Searl Transportation Division and, as one of the criteria of success with which to evaluate the companies, they examine the profile of the market values of the companies £1.00 normal value shares, over the past ten years.
Year |
1 |
2 |
3 |
4 |
5 |
6 |
7 |
8 |
9 |
10 |
================================================================
Co A |
1.25 |
1.55 |
1.60 |
1.60 |
2.00 |
0.85 |
1.70 |
2.15 |
2.40 |
1.90 |
Co B |
1.70 |
1.90 |
3.40 |
2.60 |
1.20 |
0.50 |
0.60 |
0.90 |
2.20 |
2.00 |
Co C |
1.10 |
1.20 |
1.30 |
1.50 |
2.00 |
2.00 |
2.00 |
1.90 |
2.00 |
2.00 |
================================================================
Searl feel that the investors would, of course, be more interested in the relative yield per share rather than just the capital change in the value of the share, as far as their investment decision making is concerned. Searl thinks that even so, the variability of the population is quite significant and provides far more information than just the arithmetic mean, the median or the mode. (This base is square 3 mode).
Here are Searl results to above data: Searl state that the mean market value for the shares of each of these companies is £1.70. However, Searl say if the investors are unaware of the spread of the prices, they might believe (at least on this information) that there was little to choose between the companies. With the dispersion known, they would want to know why the shares of company B have varied from 50p to £3.40, or why Company C appears to have been fairly static over the past five years. That is why Searl is so concern about companies generating the wrong image in hope to boast their image.
Page 169©