

SOCIALIST REPUBLIC OF VIETNAM
Ministry of Industry and Trade (MOIT)
Guideline for
Technical Regulation
Volume 2
Design of Thermal Power Facilities
Book 10/12
« Environment Facility »
Final Draft
June 2013
Japan International Cooperation Agency
Electric Power Development Co., Ltd.
Shikoku Electric Power Co., Inc.
West Japan Engineering Consultants, Inc.
IL
CR(2)
13-092
Table of Contents |
|
Chapter-1. Comparison between Technical Regulation and Technical Guideline of environmental |
|
facility ................................................................................................................. |
1 |
Chapter-2. Each Items of Guideline........................................................................................... |
2 |
Chapter-3. Reference International Technical Standards ............................................................ |
77 |
Chapter-4. Reference Japanese Technical Standards.................................................................. |
81 |
Chapter-5. Reference TCVN................................................................................................... |
83 |
Chapter-6. Referenced Literature and Materials ........................................................................ |
87 |
List of Tables |
|
Table- 1: Comparison between Technical Regulation and Technical Guidelineof environmental |
|
facility................................................................................................................................ |
1 |
Table- 2: Appendix-1: List of project to making of Environmental impact Assessment Report... |
3 |
Table- 3: Appendix-2. List of inter-industry and inter-province projects which Ministry of ....... |
4 |
Table- 4: Related laws of solid waste......................................................................................... |
5 |
Table- 5: C concentrations of pollution parameters of emissions gas in thermal power industry. 6 |
|
Table- 6: Power factor Kp (QCVN 22/2009/BTNMT)................................................................ |
6 |
Table- 7: Area factor Kv (QCVN 22/2009/BTNMT) .................................................................. |
7 |
Table- 8: Maximum allowable ambient air quality (QCVN 05/2009/BTNMT) ........................... |
8 |
Table- 9: List of gravity type floating separation operation...................................................... |
29 |
Table10: Example of kitchen drainage................................................................................... |
32 |
Table11: Example of water demineralizer regeneration wastewater ....................................... |
32 |
Table12: Example of condensate demineralizer regeneration wastewater............................... |
32 |
Table13: Water quality example of desulfurization wastewater.............................................. |
33 |
Table14: Water quality example of chemical cleaning drainage............................................. |
35 |
Table15: National technical regulation on industrial wastewater (QCVN 24/2009/BTNMT).. |
40 |
Table16: Kq in case releasing industrial wastewater to river, spring canal, channel, stream and |
|
trench (QCVN 24/2009/BTNMT) .................................................................................... |
41 |
Table17: Kp in case releasing industrial wastewater to pond or lake (QCVN 24/2009/BTNMT) |
|
........................................................................................................................................ |
41 |
Table18: Emission regulation for pollutants in wastewater C (QCVN 14/2008/BTNMT)....... |
42 |
Table19: Coefficient K corresponding to the type of service facility, public facility and |
|
complex housing (QCVN 14/2008/BTNMT).................................................................... |
43 |
Table20: Water quality regulation for surface water (QCVN 08/2008/BTNMT)..................... |
43 |
Table21: National Technical Regulation on Coastal Water Quality(QCVN 10/2008/BRNMT) |
|
........................................................................................................................................ |
45 |
Table22: Environmental regulation for noise (dB (A))........................................................... |
47 |
i
Table23: Allowable noise level .............................................................................................. |
47 |
Table24: Specific sound level ................................................................................................ |
56 |
Table25: Protection technology for low-frequency air vibration ............................................ |
60 |
Table26: World Bank Standard for Noise .............................................................................. |
62 |
Table27: Permissible Noise Level (db (B)) (TCVN 5949-1998)............................................. |
62 |
Table28: Maximum allowable value of vibration acceleration level for construction work .... |
64 |
Table29: Maximum allowable value of vibration acceleration for production and service |
|
activities .......................................................................................................................... |
64 |
Table30: Examples of measures to prevent coal dust scattering ............................................. |
67 |
Table31: Comparison of different methods of flue gas desulfurization for coal-fired boiler ... |
71 |
Table32: Reference International Technical Standards ........................................................... |
77 |
Table33: Reference Japanese Technical Standards ................................................................. |
81 |
Table34: Reference TCVN .................................................................................................... |
83 |
List of Figures |
|
Fig- 1: Flue gas treatment system for coal-fired thermal power plant......................................... |
9 |
Fig- 2: Denitration process ........................................................................................................ |
9 |
Fig- 3: Denitration process flow .............................................................................................. |
10 |
Fig- 4: Activated carbon absorption system flow (Isogo) ......................................................... |
13 |
Fig- 5: Activated carbon absorption block flow ....................................................................... |
13 |
Fig- 6: System diagram of desulfurizer by Lime-Gypsum method (IHI)................................... |
14 |
Fig- 7: Block flow of Limestone-Gypsum method ................................................................... |
14 |
Fig- 8: Block flow of very low temperature EP environmental system..................................... |
15 |
Fig- 9: Block flow of ammonia injection environmental system............................................... |
15 |
Fig10: Dust collection technology for commercial thermal power plants............................... |
16 |
Fig11: Moving electrode system (Hitachi)............................................................................. |
18 |
Fig12: Moving electrode system (Hitachi)............................................................................. |
18 |
Fig13: Fixed electrode system (Hitachi) ................................................................................ |
19 |
Fig14: Bag filter system (Hitachi) ......................................................................................... |
20 |
Fig15: Direction of drainage.................................................................................................. |
21 |
Fig16: Neutralization curve ................................................................................................... |
22 |
Fig17: Particle aggregation model ......................................................................................... |
23 |
Fig18: Relationship between pH and hydroxide..................................................................... |
23 |
Fig19: Typical construction of thickener ............................................................................... |
24 |
Fig20: Typical construction of filter ...................................................................................... |
24 |
Fig21: Thickener ................................................................................................................... |
25 |
Fig22: Measurement of equilibrium....................................................................................... |
26 |
ii
Fig23: Equilibrium relation q vs. c ........................................................................................ |
27 |
Fig24: Equilibrium for wastewater ........................................................................................ |
27 |
Fig25: API type oil separator................................................................................................. |
28 |
Fig26: CPI type oil separator................................................................................................. |
28 |
Fig27: PPI type oil separator ................................................................................................. |
29 |
Fig28: Example of particle size of oil droplets in the wastewater .......................................... |
29 |
Fig29: Types of wastewater in thermal power plant............................................................... |
31 |
Fig30: Water quality example of AH washing ....................................................................... |
34 |
Fig31: Example of general wastewater treatment system ....................................................... |
36 |
Fig32: Example of oil-containing wastewater treatment system............................................. |
37 |
Fig33: Example of drainage treatment system ....................................................................... |
38 |
Fig34: Example of desulfurization wastewater treatment system ........................................... |
39 |
Fig35: Practices of noise control plan.................................................................................... |
48 |
Fig36: Concept of noise prevention measures........................................................................ |
49 |
Fig37: Method to prevent noise ............................................................................................. |
50 |
Fig38: Method to apply measures preventing noise ............................................................... |
51 |
Fig39: Measures for noise prevention of boiler and turbine building ..................................... |
53 |
Fig40: Measures for noise prevention of transformer............................................................. |
54 |
Fig41: Measures for noise prevention of main fans................................................................ |
55 |
Fig42: Value that window and door begin to rattletrap .......................................................... |
58 |
Fig43: Sensitivity threshold of extremely low-frequency silence ........................................... |
58 |
Fig44: Radiation mechanism of low-frequency air vibration.................................................. |
59 |
Fig45: Example of a resonance type silencer ......................................................................... |
60 |
Fig46: Vibration isolator ....................................................................................................... |
63 |
Fig47: Vibration isolator for gen. set ..................................................................................... |
63 |
Fig48: Overview of coal handling and coal dust occurrence .................................................. |
66 |
Fig49: Factors and processes of coal dust scattering.............................................................. |
67 |
Fig50: Summery of coal dust scattering prediction method.................................................... |
69 |
Fig51: System flow of seawater desulfurization method ........................................................ |
70 |
Fig52: Schematic drawing of Condenser Cooling Water System ........................................... |
72 |
Fig53: Spreading and Cooling Process of Thermal Effluent................................................... |
73 |
Fig54: Curtain wall intake facility......................................................................................... |
74 |
Fig55: Deep-water intake ...................................................................................................... |
74 |
Fig56: Deep-water intake facility .......................................................................................... |
75 |
Fig57: Typical construction of porous ................................................................................... |
75 |
Fig58: Multi PipeType (Parallel Discharge)........................................................................... |
76 |
Fig59: Multi PipeType (Radiation Discharge)........................................................................ |
76 |
iii
List of Photos |
|
Photo- 1: Filter ........................................................................................................................ |
25 |
Photo- 2: Isolated base for compressor .................................................................................... |
63 |
Photo- 3: Isolated base for compressor .................................................................................... |
63 |
Photo- 4: Anti-vibration spring mounts .................................................................................... |
63 |
Photo- 5: Vibration isolator for gen. set ................................................................................... |
63 |
Photo- 6: Coal mill spring mount............................................................................................. |
64 |
Photo- 7: Coal screen base....................................................................................................... |
64 |
Photo- 8: Curtain wall intake facility ....................................................................................... |
75 |
iv
|
List of Acronyms/Abbreviations |
|
|
AH |
Air Heater |
|
|
API |
American Petroleum Institute |
|
|
BOD |
Biochemical Oxygen Demand |
|
|
COD |
Chemical Oxygen Demand |
|
|
CPI |
Corrugated Plate Interceptor |
|
|
DO |
Dissolved Oxygen |
|
|
DONRE |
Department of Natural Resources an Environment |
|
|
EIA |
Environment Impact Assessment |
|
|
EP |
Electrostatic Precipitator |
|
|
GGH |
Gas-Gas Heater |
|
|
JIS |
Japanese Industrial Standard |
|
|
MLSS |
Mixed Liquor Suspended Solid |
|
|
MOST |
Ministry of Science and Technology |
|
|
MONRE |
Ministry of Natural Resources an Environment |
|
|
MOSTE |
Ministry of Science, Technology and Environment |
|
|
NOx |
Nitrogen Oxides |
|
|
OECD |
Organization for Economic Co-operation and Development |
|
|
PPI |
Parallel Plate Interceptor |
|
|
SEA |
Strategic Environmental Assessment |
|
|
SOx |
Sulfur Oxides |
|
|
SS |
Suspended Solid |
|
|
SV |
Sludge Volume |
|
|
SVI |
Sludge Volume Index |
|
|
TSS |
Total Suspended Solid |
|
|
v

Chapter-1. Comparison between Technical Regulation and Technical Guideline of environmental facility
The article number of this guideline isshown in the Table-1 contrasted technical regulation with technical guideline for easy understanding.
Table- 1: Comparison between Technical Regulation and Technical Guideline of environmental facility
|
Technical Regulation |
|
|
Technical Guideline |
|
|
|||
|
|
|
|
|
|
|
|||
Article 219. |
Laws |
and |
Regulations |
Relate |
Article 219. |
Laws and Regulations Related to Environment |
|||
|
Environment |
|
|
|
|
|
|
|
|
-1. |
Article 219-1. Related Laws, Regulations, |
-1. |
Article 219-1. Related Laws, Regulations, OCVN |
||||||
|
OCVN and TCVN |
|
|
|
and TCVN |
|
|
|
|
|
|
|
|
|
|
||||
Article 220. |
Facility to Prevent Air Pollution |
|
Article 220. |
Facility to Prevent Air Pollution |
|
||||
|
|
|
|
|
|||||
-1. |
Emission Limit of pollution parameter |
-1. |
Emission Limit of pollution parameter |
|
|||||
|
|
|
|
|
|
|
|||
-2. |
Maximum allowable concentration of ai |
-2. |
Maximum |
allowable |
concentration |
of |
|||
|
pollution |
|
|
|
|
pollution |
|
|
|
|
|
|
|
|
|
||||
Article 221. |
Principle of Effluent Treatment |
|
Article 221. |
Principle of Effluent Treatment |
|
||||
|
|
|
|
|
|
||||
-1. |
Principle of Effluent Treatment |
|
-1. |
Principle of Effluent Treatment |
|
||||
|
|
|
|
|
|
||||
Article 222. |
Discharge Standard of Effluent |
|
Article 222. |
Discharge Standard of Effluent |
|
||||
|
|
|
|
||||||
-1. |
Value of the Parameters ofPollution in |
-1. |
Value of the Parameters of Pollution in Industrial |
||||||
|
Industrial Wastewater |
|
|
Wastewater |
|
|
|
||
|
|
|
|
|
|
||||
-2. |
Maximum allowable value parameter |
|
-2. |
Maximum allowable value parameter |
|
||||
|
|
|
|
|
|
|
|||
Article 223. |
Facility to Prevent Noise |
|
Article 223. |
Facility to Prevent Noise |
|
|
|||
|
|
|
|
|
|
|
|
|
|
-1. |
Noise Limit |
|
|
-1. |
Noise Limit |
|
|
|
|
|
|
|
|
|
|
|
|||
Article 224. |
Facility to Prevent Vibration |
|
Article 224. |
Facility to Prevent Vibration |
|
|
|||
|
|
|
|
|
|
|
|
||
-1. |
Vibration Limit |
|
|
-1. |
Vibration Limit |
|
|
||
|
|
|
|
|
|
|
|||
Article 225. |
Measures for Effluent |
|
Article 225. |
Measures for Effluent |
|
|
|||
|
|
|
|
|
|
|
|||
-1. |
Dust Prevention of Coal Yard |
|
-1. |
Dust Prevention in Coal Yard |
|
|
|||
|
|
|
|
|
|||||
-2. |
Dust Prevention of Ash Treatment Facility |
-2. |
Dust Prevention of Ash Treatment Facility |
|
|||||
|
|
|
|
|
|
||||
-3. |
Effluent from Seawater De-Sox |
|
-3. |
Effluent from Seawater De-Sox |
|
||||
|
|
|
|
||||||
Article 226. |
Measures for Dust from Coal Un-loading |
Article 226. |
Measures for Dust from Coal Un-loading Pier, |
||||||
|
Pier, Coal Yard and Ash Pond |
|
|
Coal Yard and Ash Pond |
|
|
|||
-1. |
Dust Prevention of Truck Hopper |
|
-1. |
Dust Prevention of Truck Hopper |
|
||||
|
|
|
|
|
|
|
|
|
|
-2. |
Car Washer |
|
|
-2. |
Car Washer |
|
|
|
|
|
|
|
|
|
|
|
|
||
-3. |
Conveyor Gallery |
|
|
-3. |
Conveyor Gallery |
|
|
||
|
|
|
|
|
|||||
-4. |
Dust prevention from Ash Damping Area |
-4. |
Dust prevention from Ash Damping Area |
|
|||||
|
|
|
|
|
|
|
|||
-5. |
Coal Dust Prevention |
|
-5. |
Coal Dust Prevention |
|
|
|||
|
|
|
|
|
|
||||
Article 227. |
Measures for Thermal Effluent |
|
Article 227. |
Measures for Thermal Effluent |
|
||||
|
|
|
|
|
|
|
|||
-1. |
Measure for Thermal Effluent |
|
-1. |
Measure for Thermal Effluent |
|
|
|||
|
|
|
|
|
|
|
|
|
|
1

Chapter-2. Each Items of Guideline
Article 219. Laws and regulations related to environment
Article 219-1. Related laws, regulations, QCVN and TCVN
1.Environmental policy
At first, the overview of environmental policies of Vietnam isorganized as follows. Environmental Protection Act (Law on Environmental Protection was enforced on 1994 as a basic framework for
environmental policy in Vietnam. Environmental regulations such as the air quality standards (TCVN 5937, 5939-1995), water quality standards (TCVN 5942, 5943, 5944-1995) and emission regulations such as emission standards (TCVN 5939-1995), water emission standard (TCVN-5945-1995) and other emissions criteria from pollution sources established in 1995,although Ho Chi Minh city and Hanoi city which were becoming increasingly industrialized had establish environmental regulations by themselves to an earlier before enforcement of the law and deal with environmental issues until
then. Now these uniform environmental standardsare being revised to respond to changes in circumstances surrounding the regulatory environment for economicgrowth in recent years. The Amended Environmental Protection Act (Revised Law on Environmental Protection) has passed the National Assembly of Vietnam in 2005 and still valid. Currently, some of the environmental standards enacted in 1995 have been revised and the rest of has been replaced with Vietnam National Technical Regulation (QCVN-05: 2009/BTNMT, etc.).
2.Environmental administration
MOSTE (Ministry of Science, Technology and Environment) which was established in1992 was in |
|
|||||||
charge of environmental administration in Vietnam and was the responsibleagencies which are |
|
|||||||
responsible |
for the overall |
technical and environmental concerns such |
as scirentificsearh, |
|
||||
technology |
development, |
equipment |
standards, |
industrial |
property |
rights |
protection |
and |
environmental protection, etc.MOSTE (Ministry of Science and Technology)was divided into MOST (Ministry of Science and Technology) and MONRE (Ministry of Natural Resources and Environment) in August/ 2002 and all matters elatedr to the environmenthave been transferred to MONRE. MONRE is responsible for overseeing the work done at the National level such as development of documents related to the environment preservationpolicy, confirmation of status of compliance with environmental laws and regulations, environmental impact assessment (EIA), management of resource.
On the other hand, DONRE (Department of Natural Resources and Environment)which has been installed in the each provinces or central municipalities is charge the environmental administration at the local level. DONRE has been placed under the provincial People’s Committee and assist the People’s Committee in the management of land use, watresource use, natural resource use, environment, climate, waterway, measurement and map. DONRE is in a position to directly monitor
2
compliance with environmental regulations and has been monitoring of air quality or water quality, plant inspection and registered for land or water.
3.Vietnamese laws, regulations and ordinance pertaining the thermal power project
(1) Environmental laws
1)Law on Environmental Protection
The |
environmental |
Protection |
Act |
passed |
the |
National |
Assembly |
of |
Vietnam |
on |
November/29/2005, |
promulgated |
by |
President’s ordinance |
29/2005/L/CTN on |
|
|||||
December/12/2005 and entered into force on July/1/2006. Environmental Protection |
Act is |
|
||||||||
consisting of all 15 chapters and 136 sections, the overall of chapter-3is consisting by SEA |
|
|||||||||
(Strategic Environmental Assessment: paragraph 14~17)and EIA (Environmental Impact |
|
|||||||||
Assessment: paragraph 18~23). |
|
|
|
|
|
|
|
|
||
2)Decree 80/2006/ND-CP
This is the decree dated Augst/09/2006 “relating to details and guidelines on the implementation of some sections of the Environmental Protection Act”. This decree consists of 3 chapters and 25 sections, and it includes SEA and EIA in Section-2 and Chapter-1 and 12 detailed regulations pertaining to environmental protection. A list of projects that need EIA report preparation is
provided in Annex1of Decree 80/2006/ND-CP and a list of projects that need EIA report preparation and across sectors and provinces reviewing and approving by MONRE in Annex-2. According to these two rules in Annex, “Thermal power projects exceed 50MW” shall establish
EIA report and “Thermal power plant with design power of exceed 300MW to less than 500MW and which is located less than 2km from the city or residential area”and “Thermal power project more than 500MW” shall be reviewed and approved as shown in Table-2 and 3.
Table- 2: Appendix-1: List of project to making of Environmental impact Assessment Report
Original |
Projects |
Size |
|
No. |
|||
|
|
||
|
|
|
|
1 |
Project on key national works |
All |
|
|
|
|
|
|
Projects using part or the whole of land areas of or adversely affecting |
|
|
2 |
nature conservation zones, national parks, historical-cultural relic areas, |
|
|
natural heritages and famous scenic places, ranked or not yet ranked, |
All |
||
|
which are protected under decisions of provincial/municipal People’s |
|
|
|
Committees |
|
|
|
|
|
|
3 |
Projects involving risks of directly and badly affecting water sources in |
All |
|
river basins, coastal areas and areas having protected eco-systems |
|||
|
|
||
|
|
|
|
4 |
Projects on nuclear power plants |
All |
|
|
|
|
|
30 |
Projects on thermo power plants |
Capacity of 50 MW or |
|
more |
|||
|
|
||
31 |
Projects on hydropower plants |
Reservoir with a capacity |
|
|
of 1,000,000 m3 or more |
||
32 |
Projects on building high-voltage power lines |
50 km or more in length |
|
|
|
|
3

Table- 3: Appendix-2. List of inter-industry and inter-province projects which Ministry of Natural Resources and Environment has authority to appraised and approve Environmental Impact Assessment Report
Projects using part or all of the land of a national park, a alnaturconservation zone, an
(1)ecosphere reserve zone, a world heritage site or an historical and cultural site which has been classified at the national level.
(2) |
|
Nuclear power plant projects, thermo-nuclear power plant projects, and |
nuclear |
reac |
|
projects. |
|
|
|
|
|
|
|
|
|
|
|
|
|
|
|
Thermo-power plant projects with a design output capacity of from 300 to 500 |
MW less than |
|
(3) |
|
2 kilometers from an urban or concentrated residential zone; other thermo-electric |
plant |
|
|
|
projects with an output capacity of from 500 or more MW. |
|
|
|
|
|
|
|
Hydro-power plants [or] irrigation works with a reservoir with a capacity of 100,000,
(4)cubic meters or more of water, or which affect the surface water supply and ground water of two or more provinces and cities under central authority.
Projects for which otectivepr forest in catchment areas, estuaries or coastal area
(5)specialized use forests of 20 hectares or more or natural forest of 200 hectares or more will be cut or destroyed pursuant to a plan for conversion of land use purposes approved by t Government.
(6)Aquaculture projects on a sandy area of 100 hectares or more.
Petrochemical refinery projects; projects for manufacturing basic chemicals, plant protection agents, washing detergents, additives [or] chemical fertilizer with an output capacity of from
(7)20,000 tons of product per year; projects for a plant manufacturing batteries with a desi output capacity of from 300,000 Wh per year; projects for a plant manufacturing cement with an output capacity of from 1,200,000 tons of cement per year; projects for a manufacturing plant or factory producing radioactive substances or emitting radioactive waste.
|
Projects for mining petroleum and gas; projects for mining solid minerals with an ou |
|||||||||
|
capacity of from 500,000 cubic meters per year (including earth, loose stone and base ore); |
|||||||||
(8) |
projects |
for |
mining radioactive [and/or] |
rare |
earth metals; |
projects |
for |
exploitation of |
||
underground water with an output capacity of from 50,000 cubic meters per 24 hours, and for |
||||||||||
|
||||||||||
|
exploitation of surface water with a design output capacity of from 500,000 cubic meters per |
|||||||||
|
24 hours. |
|
|
|
|
|
|
|
|
|
|
|
|
||||||||
|
Projects for the construction of infrastructure of an industrial zone, export processing zone, |
|||||||||
|
high-tech zone, industrial group, tourism zone and entertainment zone with a land area of 200 |
|||||||||
(9) |
or more hectares; projects for the construction of |
a port for ships of a tonnage of 50 |
||||||||
|
DWT or more; projects for [production of] refined steel with a design output capacity of from |
|||||||||
|
300,000 tons of product per year. |
|
|
|
|
|
|
|||
|
|
|
|
|
|
|
|
|
|
|
(10) |
Projects |
for |
the recycling of hazardous |
waste, |
[and/or] the |
treatment |
and |
dispos |
||
hazardous waste. |
|
|
|
|
|
|
||||
|
|
|
|
|
|
|
||||
(11)Projects with one or more items of a project set out in paragraphs 1 to 10 above.
(12)Other projects stipulated in Appendix I lying within the area of two or more provinces and cities under central authority.
3)Decree 81/2006/ND-CP
This is a decree relating to administrative penalties in the area of environmental protection dated on Augst/9/2006. This is consisting all 5 chapters and 44 sections. Section9stipulates-
that the penalty for violating the rules relating to the EIA and SEA.
4
4)Decree 21/2008/ND-CP
This is issued by the Vietnamese government in February/2008, which is revision and supplement to Decree 80/2006/ND-CP.
5)Circular 08/2006/TT-BTNMT
This is the circular “Guidance for SEA, EIA and environmental initiatives” issued by MONRE on September/8/2006. In the section-3 of this circular, details for development, assessment and approval of EIA report, audit and certification relating to theimplementation of the content of EIA report has been provided.
6)Circular 05/2008/TT-BTNMT
This is the circular dated December/8/2008 issued by MONREThe. detailed guideline for implementation of a number of matters relating to SEA, EIA and environmental protection stipulated in Environmental Protection Act and Decree 21/2008/ND-CP.
7)Others
Other legal documents that are referenced in the EIA reportare the Water Resources Act (The Water resources Law: passed through the Vietnam National Assembly on May/20/1998),Land Act (The Land Law: passed through the Vietnam National Assembly on November/26/2003) and the like.
8)Solid waste management related laws
There is something like the following lows shown in Table-4 as solid waste management laws.
Table- 4: Related laws of solid waste
1. |
Decree 59/2007/ND-CP |
:2007/4/9 |
Decree for solid waste management |
|
|
|
|
|
Circular 12/2006/TT-BTNM |
:2006/12/26 |
MONRE circular regarding guideline for |
2. |
|
|
implementation and procedure of application, |
|
|
|
registration and approval of solid waste |
|
|
|
|
3. |
TCVN 6696 |
:2000/ |
Solid waste-Common requirement for |
|
|
environmental protection, sanitary landfill |
|
|
|
|
|
|
|
|
|
4. |
TCVN 6705 |
:2000/ |
Non-hazardous solid waste-classification |
|
|
|
|
5. |
TCVN 6706 |
:2000/ |
Hazardous waste-classification |
|
|
|
|
5

Article 220. Facility to prevent air pollution
Article 220-1.Emission limit of pollution parameter
1.National technical regulation on emission of thermal power industry QCVN 22/2009/BTNMT
Cmax (maximum allowable concentration of air pollution parameters in thermal power industrial) is calculated as follows;
Cmax = C × Kp × Kv
C concentration of pollution parameters as basis for calculating maximum allowable concentration of emissions gas in thermal power industrial is stipulated by type of fuel in Table-5 below;
Table- 5: C concentrations of pollution parameters of emissions gas in thermal power industry (QCVN 22/2009/BTNMT)
|
|
|
|
|
|
Concentration (mg/Nm3) |
|
|
No. |
|
Parameters |
|
|
|
|
|
|
|
|
A (Existing |
|
B (New Plant) |
|
|
||
|
|
|
|
Plant) |
|
|
|
|
|
|
|
|
|
Coal |
Oil |
Gas |
|
|
|
|
|
|
|
|
|
|
1 |
|
Total dust |
|
400 |
|
200 |
150 |
50 |
|
|
|
|
|
|
|
|
|
|
|
NOx |
|
1,000 |
|
- 650 |
600 |
250 |
2 |
|
(Calculated |
|
|
|
(The volatile content of coal > 10%) |
|
|
|
by NO2) |
|
|
|
-1,000 |
|
|
|
|
|
|
|
|
|
|
||
|
|
|
|
|
|
(The volatile content of coal ≤ 10%) |
|
|
|
|
|
|
|
|
|
|
|
3 |
|
SO2 |
|
1,500 |
|
500 |
500 |
300 |
Note: |
Depending on |
the type of |
used fuel, the allowable maximum |
concentrations of |
||||
components NOx, SO2 and dust on emission gas in thermal power is given in Table-6. These concentration values calculated at standard conditions. For thermal power used co concentration of excess oxygen (O2) reference in emission gas is 6%; for gas turbines concentration of excess oxygen (O2) reference in emission gas is 15%.
Kp is the power factor in proportion with total design capacity of thermal power plants as shown in Table-6.
Table- 6: Power factor Kp (QCVN 22/2009/BTNMT)
Power generation capacity (MW) |
Kp |
|
|
P ≤ 300 |
1 |
|
|
300 < P ≤ 1200 |
0.85 |
|
|
1200 < P |
0.7 |
|
|
6

Kv is the area factor, regional factor which corresponding to the placement of thermal power plants location as shown in Tabl-7.
Table- 7: Area factor Kv (QCVN 22/2009/BTNMT)
|
Partition of region, area |
|
Kv |
||
|
|
|
|
|
|
|
(1) |
(1) |
(2) |
|
|
|
Interior of special urban and |
urban type ; |
special-use forests ; natural |
|
|
Type 1 |
heritage, vestige of historic and cultural is |
(3) |
0.6 |
||
ranked; thermal power plants |
|||||
|
have distance to the boundary of the area above 05km. |
|
|||
|
|
|
|||
|
Interior of urban type2, 3, 4(1); suburbs of specialurban, suburbs of urban |
|
|||
Type 2 |
type1 there are the distance to the boundary of interior is greater than or equal |
0.8 |
|||
to 05km, thermal power plants have distance to the boundary of tthese |
|||||
|
|
||||
|
areas below 05km. |
|
|
|
|
|
|
|
|||
|
Industrial Park; Urban type5(1); suburbs and outskirts of urban type2,3,4 there |
|
|||
Type 3 |
are the distance to the boundary of interior is greater than or equal to 05km |
1.0 |
|||
thermal power plants have distance to the |
boundary of these areas below |
||||
|
|
||||
|
05km(4). |
|
|
|
|
Type 4 |
Rural |
|
|
1.2 |
|
|
|
|
|
|
|
Type 5 |
Rural mountainous |
|
|
1.4 |
|
|
|
|
|
|
|
Legend:
(1)The Urban shall be determined as stipulated inecreeD No.42/2009/ND-CP May/7/2009 by the Government on classification of urban areas;
(2)Special-use forests shall be determined by the Law on Protection andevelopmentD of Forests
December/14/2004 include: national parks, natural reserves, area of landscapeprotection, forest research, experimental science;
(3) Natural heritage, vestige of historic and cultural were the SCO,UNE the Prime Minister or Ministries of managing decision making establishment and ranked;
(4)In case the source of emissions there is the distance to more 2 regions, smaller than 02km, shall be to apply KV factor of region, which have smallest factor;
(5)The distance stipulates in Table-7 are calculated from the emission source.
2.National Technical Regulation on Ambient Air Quality: QCVN 05/2009/BTNMT The regulation of ambient air quality of Vietnam is shown in Table-8.
7
Table- 8: Maximum allowable ambient air quality (QCVN 05/2009/BTNMT)
|
|
1hr- |
3hr- |
8hr- |
Annual |
|
No. |
Parameter |
Averaging |
Averaging |
Averaging |
Averaging |
|
|
|
Time |
Time |
Time |
Time |
|
|
|
|
|
|
|
|
1 |
SO2 |
350 |
― |
125 |
50 |
|
2 |
CO |
30,000 |
10,000 |
5,000 |
― |
|
|
|
|
|
|
|
|
3 |
NOx |
200 |
|
100 |
40 |
|
|
|
|
|
|
|
|
4 |
O3 |
180 |
120 |
80 |
― |
|
|
|
|
|
|
|
|
5 |
Suspended particulate |
300 |
― |
200 |
140 |
|
matter (TSP) |
||||||
|
|
|
|
|
||
|
|
|
|
|
|
|
6 |
Particulate matter |
― |
― |
150 |
50 |
|
≤ 10μm (PM10) |
||||||
|
|
|
|
|
||
|
|
|
|
|
|
|
7 |
Pb |
― |
― |
1.5 |
0.5 |
|
|
|
|
|
|
|
|
Note: En dash (-): No stipulation |
|
|
|
|
||
|
|
|
|
|
|
|
Article 220-2.Maximum allowable concentration of air pollution
1.System configuration of environmental equipment for coal-fired boiler
The flue gas treatment measures for thermal power generation plant in Japan are located on the top level with a global perspective, which is practical and reliable technology. Thermal power generation Japan has become a very small SOx and NOx emission value per unit of electricity generation compared with 6 countries in the OECD by promoting measures against fuel and equipment. However, the requirement is increasing on a par with advanced environmental measures against coal-fired thermal power plant in order to further preserve the local environment. It is required comprehensive gas treatment measures, since flue gas from coal-fired thermal power plant has high concentration of sulfur oxide, nitrogen oxide and dust. In addition, environmental facility has been increasing as shown in Fig-1 as of coal-fired facilities; the cost reduction measures are required.
The cases requiring dust concentration of less than 10mg/m3N against conventional number of 10mg/m3N and sulfur oxide of less than 50ppm are increasing for the suburban type coal-fired plant. In this case, the wet type EP has been put into practical systems adding a wet type EP at outlet of absorber of desulfurization unit in order to further improve the performance of dust removal. However, recently it is often adopted a low temperature EP which is capable to increase economic performance in combination with the dry EP without installation of the wet type EP, desulfurization facility and GGH (gas gas heater), since such facilities configuration increase the complexity and cost. This system is established upstream of the EP and is aimed to improve the performance of EP. It can be achieved a significant improvement in EP performance at a temperature around 90oC, since electrical resistivity of coal ash is greatly reduced, the back corona phenomenon can be completely
8
eliminated and normal charging state is secured against coal dust collection which previously could not be used extremely poor. It can be reduced the dust concentration at outlet of stack less than number of mg/m3 by adoption of the very low-temperature type EP.
|
|
Boiler |
|
|
|
|
|
|
|
|
Boiler |
Fired |
|
|
Coal |
|
|
|
|
|
|
|
Boiler |
|
||
|
|
|
|
|
|
|
|
Boiler |
|
|
|
|
|
|
NH3 |
|
|
|
|
|
|
|
|
|
|
|
|
|
|
|
|
|
|
|
|
|
|
|
|
|
|
|
|
|
|
|
|
|
|
|
|
|
|
|
|
|
|
|
|
||
|
|
|
|
|
|
|
|
|
|
|
|
|
|
|
|
|
|
|
|
|
|
|
|
|
|
|
|
|
|
|
|
|
|
|
|
|
|
|
|
|
|
|
|
|
|
|
|
||
|
|
|
|
|
|
|
|
|
|
|
|
|
|
|
|
|
|
|
|
|
|
Dry Ep |
|
|
|
|
|
|
|
|
|
|
|
|
|
|
|
|
|
|
|
|
|
|
|
|
|||
|
|
|
|
|
|
|
De- |
|
|
|
|
|
|
|
|
|
|
|
|
|
|
|
|
|
|
|
|
|
|
De-SOx |
|
|
|
|
|
|
|
|
|
|
|
||||||||
|
|
|
|
|
|
|
|
|
|
|
|
AH |
|
|
|
|
|
|
|
|
|
GGH |
|
|
|
|
|
GGH |
|
|
|
Low Temp. |
|||||||||||||||||
Boiler |
|
|
|
|
|
|
|
|
|
|
|
|
|
|
|
|
(L/Temp.) |
|
|
|
|
|
|
|
|
|
|
|
|||||||||||||||||||||
|
|
|
|
NOx |
|
|
|
|
|
|
|
|
|
|
|
|
|
|
|
|
|
|
|
|
|
|
|
|
|
|
|
|
|
|
|
|
|
|
|
||||||||||
|
|
|
|
|
|
|
|
|
|
|
|
|
|
|
|
|
|
|
|
|
|
|
|
|
|
|
|
|
|
|
|
|
|
|
|
|
|
|
|
|
|
Type EP |
|||||||
|
|
|
|
|
|
|
|
|
|
|
|
|
|
|
|
|
|
|
|
|
|
|
|
|
|
|
|
|
|
|
|
|
|
|
|
|
|
|
|
|
|
|
|||||||
|
|
|
|
|
|
|
|
|
|
|
|
|
|
|
|
|
|
|
|
|
|
|
|
|
|
|
|
|
|
|
|
|
|
|
|
|
|
|
|
|
|
|
|
|
|
|
|
||
|
|
|
|
|
|
|
|
|
|
|
|
|
|
|
|
|
|
|
|
|
|
|
|
|
|
|
|
|
|
|
|
|
|
|
|
|
|
|
|
|
|
|
|
|
|
|
|
||
|
|
|
|
|
|
|
|
|
|
|
|
|
|
|
|
|
|
|
|
|
|
|
|
|
|
|
|
|
|
|
|
|
|
|
|
|
|
|
|
|
|
|
|
|
|
|
|
||
|
|
|
|
|
|
|
|
|
|
|
|
|
|
|
|
|
|
|
|
|
|
|
|
|
|
|
|
|
|
|
|
|
|
|
|
|
|
|
|
|
|
|
|
|
|
|
|
|
|
|
|
|
|
|
|
|
|
|
|
|
|
|
|
|
|
|
|
|
|
|
|
|
|
|
|
|
|
|
|
|
|
|
|
|
|
|
|
|
|
|
|
|
|
|
|
|
|
|
|
|
|
|
|
|
|
|
|
|
|
|
|
|
NH3 |
|
|
|
|
|
|
|
|
|
|
|
|
|
|
|
|
|
|
|
|
|
|
|
|
|
|
|
|
|
|
|
|
||||
|
|
|
|
|
|
|
|
|
|
|
|
|
|
|
|
|
|
|
|
|
|
|
|
|
|
|
|
|
|
|
|
|
|
|
|
|
|
|
|
|
|
|
|
|
|
||||
|
|
|
|
|
|
|
Dry Ep |
|
|
|
|
|
|
|
|
|
|
|
|
|
|
|
|
|
|
|
|
|
|
|
|
|
|
|
|
|
|
|
|
|
|
|
|
|
|
||||
|
|
|
|
|
|
|
|
|
|
|
|
|
De- |
|
|
|
|
|
|
|
|
|
|
|
|
|
De-SOx |
|
|
|
|
GGH |
|
|
|
|
High Temp. |
||||||||||||
|
|
|
|
|
|
|
|
|
|
|
|
|
|
|
AH |
|
|
|
GGH |
|
|
|
|
|
|
|
|
|
|
|
|||||||||||||||||||
|
|
|
|
|
|
|
(H/Temp.) |
|
|
|
|
|
|
|
|
|
|
|
|
|
|
|
|
|
|
||||||||||||||||||||||||
Boiler |
|
|
|
|
|
|
|
|
|
|
|
|
|
|
|
||||||||||||||||||||||||||||||||||
|
|
|
|
|
|
|
|
|
|
|
|
NOx |
|
|
|
|
|
|
|
|
|
|
|
|
|
|
|
|
|
|
|
|
|||||||||||||||||
|
|
|
|
|
|
|
|
|
|
|
|
|
|
|
|
|
|
|
|
|
|
|
|
|
|
|
|
|
|
|
|
|
|
|
|
|
|
Type EP |
|||||||||||
|
|
|
|
|
|
|
|
|
|
|
|
|
|
|
|
|
|
|
|
|
|
|
|
|
|
|
|
|
|
|
|
|
|
|
|
|
|
||||||||||||
|
|
|
|
|
|
|
|
|
|
|
|
|
|
|
|
|
|
|
|
|
|
|
|
|
|
|
|
|
|
|
|
|
|
|
|
|
|
|
|
|
|
|
|
|
|
|
|
||
|
|
|
|
|
|
|
|
|
|
|
|
|
|
|
|
|
|
|
|
|
|
|
|
|
|
|
|
|
|
|
|
|
|
|
|
|
|
|
|
|
|
|
|
|
|
|
|
||
|
|
|
|
|
|
|
|
|
|
|
|
|
|
|
|
|
|
|
|
|
|
|
|
|
|
|
|
|
|
|
|
|
|
|
|
|
|
|
|
|
|
|
|
|
|
|
|
||
|
|
|
|
|
|
|
|
|
|
|
|
|
|
|
|
|
|
|
|
|
|
|
|
|
|
|
|
|
|
|
|
|
|
|
|
|
|
|
|
|
|
|
|
|
|
|
|
|
|
|
|
|
|
|
|
|
|
|
|
|
|
|
|
|
|
|
|
|
|
|
|
|
|
|
|
|
|
|
|
|
|
|
|
|
|
|
|
|
|
|
|
|
|
|
|
|
|
||
|
|
|
NH3 |
|
|
|
|
|
|
|
|
|
|
|
|
|
|
|
|
|
|
|
|
|
|
|
|
|
|
|
|
|
|
|
|
|
|
|
|
|
|
|
|
|
|
|
|||
|
|
|
|
|
|
|
|
|
|
|
|
|
|
|
|
|
|
|
|
|
|
|
|
|
|
|
|
|
|
|
|
|
|
|
|
|
|
|
|
|
|
|
|
|
|
|
|
|
|
|
|
|
|
|
|
|
|
|
|
|
|
|
|
|
|
|
|
|
Dry Ep |
|
|
|
|
|
|
|
|
|
|
|
|
|
|
|
|
|
|
|
|
|
|
|
Wet |
||||||
|
|
|
|
|
|
De- |
|
|
|
|
|
|
|
|
|
|
|
GGH |
|
|
De-SOx |
|
Wet EP |
|
|
|
|
|
|
|
|
||||||||||||||||||
|
|
|
|
|
|
|
|
|
|
AH |
|
|
|
|
|
|
|
|
|
|
GGH |
|
|
||||||||||||||||||||||||||
Boiler |
|
|
|
|
|
|
|
|
|
(L/Temp.) |
|
|
|
|
|
|
|
|
|||||||||||||||||||||||||||||||
|
|
|
|
NOx |
|
|
|
|
|
|
|
|
|
|
|
|
|
|
|
|
|
|
|
|
|
|
|
|
|
|
|
|
|
|
|
|
|
|
Type EP |
||||||||||
|
|
|
|
|
|
|
|
|
|
|
|
|
|
|
|
|
|
|
|
|
|
|
|
|
|
|
|
|
|
|
|
|
|
|
|
|
|
|
|
|
|
|
|||||||
|
|
|
|
|
|
|
|
|
|
|
|
|
|
|
|
|
|
|
|
|
|
|
|
|
|
|
|
|
|
|
|
|
|
|
|
|
|||||||||||||
|
|
|
|
|
|
|
|
|
|
|
|
|
|
|
|
|
|
|
|
|
|
|
|
|
|
|
|
|
|
|
|
|
|
|
|
|
|
|
|
|
|
|
|
|
|
|
|
||
|
|
|
|
|
|
|
|
|
|
|
|
|
|
|
|
|
|
|
|
|
|
|
|
|
|
|
|
|
|
|
|
|
|
|
|
|
|
|
|
|
|
|
|
|
|
|
|
|
|
|
|
|
|
|
|
|
|
|
|
|
|
|
|
|
|
|
|
|
|
|
|
|
|
|
|
|
|
|
|
|
|
|
|
|
|
|
|
|
|
|
|
|
|
|
|
|
|||
|
|
|
NH3 |
|
|
|
|
|
|
|
|
|
|
|
|
|
|
|
|
|
|
|
|
|
|
|
|
|
|
|
|
|
|
|
|
|
|
|
|
|
|
|
|
|
|
||||
|
|
|
|
|
|
|
|
|
|
|
|
|
|
|
|
|
|
|
|
|
|
|
|
|
|
|
|
|
|
|
|
|
|
|
|
|
|
|
|
|
|
|
|
|
|
|
|
|
|
|
|
|
|
|
|
|
|
|
|
|
|
|
|
|
|
|
|
|
|
|
|
|
|
|
|
|
Dry Ep |
|
|
|
|
|
|
|
|
|
|
|
|
|
|
Very Low temp. |
|
||||||
|
|
|
|
|
|
|
De- |
|
|
|
|
|
|
|
|
|
|
|
|
|
GGH |
|
|
|
De-SOx |
|
|
|
|
|
|
|
|
|
|
|
|||||||||||||
|
|
|
|
|
|
|
|
|
|
|
|
AH |
|
|
|
|
|
|
|
|
|
|
|
|
GGH |
|
|
|
|
|
|||||||||||||||||||
|
|
|
|
|
|
|
|
|
|
|
|
|
|
|
|
|
|
|
(VL/Temp.) |
|
|
|
|
|
|
|
|||||||||||||||||||||||
Boiler |
|
|
|
|
|
|
|
|
|||||||||||||||||||||||||||||||||||||||||
|
|
|
|
NOx |
|
|
|
|
|
|
|
|
|
|
|
|
|
|
|
|
|
|
|
|
|
|
|
|
|
|
|
|
|
|
|
|
Type EP |
|
|||||||||||
|
|
|
|
|
|
|
|
|
|
|
|
|
|
|
|
|
|
|
|
|
|
|
|
|
|
|
|
|
|
|
|
|
|
|
|
|
|
|
|
|
|
|
|
||||||
|
|
|
|
|
|
|
|
|
|
|
|
|
|
|
|
|
|
|
|
|
|
|
|
|
|
|
|
|
|
|
|
|
|
|
|
|
|
||||||||||||
|
|
|
|
|
|
|
|
|
|
|
|
|
|
|
|
|
|
|
|
|
|
|
|
|
|
|
|
|
|
|
|
|
|
|
|
|
|
|
|
|
|
|
|
|
|
|
|
|
|
|
|
|
|
|
|
|
|
|
|
|
|
|
|
|
|
|
|
|
|
|
|
|
|
|
|
|
|
|
|
|
|
|
|
|
|
|
|
|
|
|
|
|
|
|
|
|
|
|
|
Fig- 1: Flue gas treatment system for coal-fired thermal power plant
Reference: P-91 of Journal (No.649: Oct. /2010): TENPES
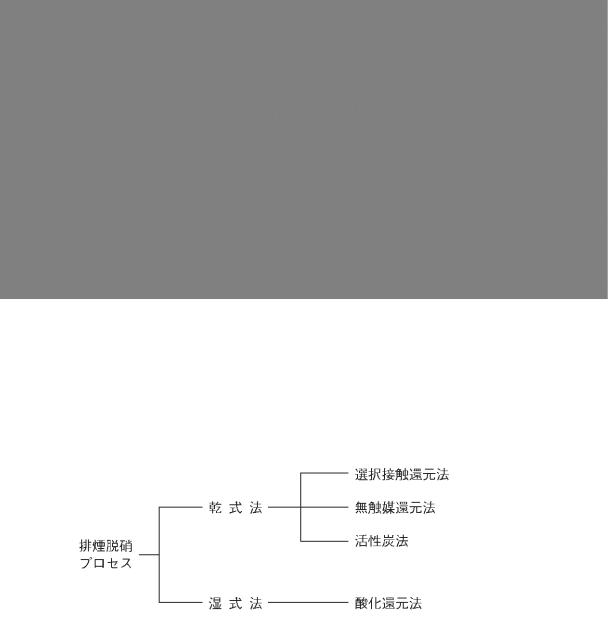
1.1Denitrification
The main fuel gas denitration process which has been commercialized is shown in Fig-2.
|
|
|
|
|
|
|
|
Selective Catalytic Reduction Method |
|||
|
|
|
|
|
|
|
|
|
|
|
|
|
|
|
|
|
|
|
|
|
|
|
|
|
|
|
Dry Method |
|
|
|
|
|
|||
|
|
|
|
|
|
Non-catalytic Reduction Method |
|
||||
|
|
|
|
|
|
|
|
||||
|
|
|
|
|
|
|
|
|
|
|
|
De-NOx |
|
|
|
|
|
|
|
|
|||
|
|
|
|
|
|
|
Activated carbon Method |
|
|
|
|
Process from |
|
|
|
|
|
|
|
|
|
|
|
|
|
|
|
|
|
|
|
||||
|
|
|
|
|
|
|
|
|
|
|
|
Flue Gas |
|
|
|
|
|
|
|
|
|||
|
|
|
|
|
|
|
|
|
|
|
|
|
|
|
|
|
|
|
|
|
|
|
|
|
|
|
|
|
|
|
Oxidation Reduction Method |
|
|
||
|
|
|
Wet Method |
|
|
|
|
||||
|
|
|
|
|
|
|
|
|
|
|
|
Fig- 2: Denitration process
Reference: P-92 of Journal (No.649: Oct. /2010): TENPES
The selective catalytic denitrification process which conducts reaction in the presence of a catalytic using ammonia (NH3) as agent for dry method are most commonly used, since the facility is simple and it is totally unnecessarypost-processing because no byproduct. Furthermore, selective catalytic reduction process has been adopted as mainstream of denitration facility for thermal power plant for business as shown in Fig-3, since high performance isobtained by a simple process and simple
9
maneuvers.
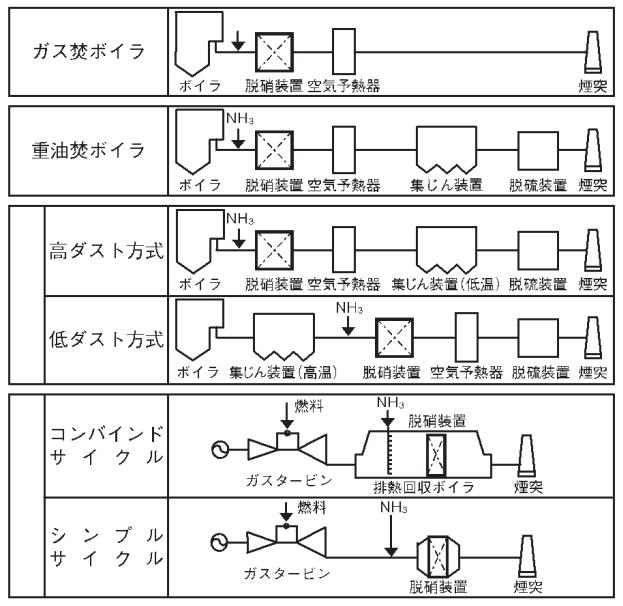
1.1.1Denitration facility for boiler
The denirration facility for boiler has been established subsequent spread in 1990s upon request such as diversification of heavy oil, coal, residual oil, heavy residual oil into the background of energy situation. In recent years, biomass fuel which has been attracting attention as measures for global warming and an alternative to fossil have been made efforts to use as new energy source. Denitration performance and evaluation of the impact of biomass co-firing has been proven in various tests, is in intensive support for commercialization.
NH3
|
Gas Fired Boiler |
|
|
|
|
|
|
|
|
|
|
|
|
|
|
|
|
|
|
|
|
|
|
|
|
|
|
|
|
|
|
|
|
|
|
|
|
|
|
Boiler |
|
|
DE-NOx |
AH |
|
Stack |
|
|
|
|
|
|
|
|
|
|
|
|
|
|
|
|
|
|
|
NH3 |
|
|
|
|
|
|
|
|
|
|
|
|
|
||||
Heavy Oil Fired Boiler |
|
|
|
|
|
|
|
|
|||
|
|
|
|
|
|
|
|
|
|
|
|
Coal Fired Boiler
Gas Turbine
|
|
|
|
|
|
Boiler |
|
|
|
|
DE-NOx |
|
|
|
AH |
|
|
|
|
|
|
|
Dust Collector |
|
|
|
De-SOx |
Stack |
|||||||||||||||||||
|
|
|
|
|
|
|
|
|
|
|
|
|
|
|
|
|
|
|
|
|
|
|
|
|
|
|
|
|
|
|
|
|
|
|
|
|
|
|
|
|
|
|
|
|
|||
|
|
|
|
|
|
|
|
|
NH3 |
|
|
|
|
|
|
|
|
|
|
|
|
|
|
|
|
|
|
|
|
|
|
|
|
|
|
|
|
|
|
|
|
|
|
||||
|
|
|
|
|
|
|
|
|
|
|
|
|
|
|
|
|
|
|
|
|
|
|
|
|
|
|
|
|
|
|
|
|
|
|
|
|
|
|
|
|
|
|
|||||
|
High-dust |
|
|
|
|
|
|
|
|
|
|
|
|
|
|
|
|
|
|
|
|
|
|
|
|
|
|
|
|
|
|
|
|
|
|
|
|
|
|
|
|
|
|||||
|
System |
|
|
|
|
|
|
|
|
|
|
|
|
|
|
|
|
|
|
|
|
|
|
|
|
|
|
|
|
|
|
|
|
|
|
|
|
|
|
|
|
|
|||||
|
|
|
|
|
|
|
|
|
|
|
|
|
|
|
|
|
|
|
|
|
|
|
|
|
|
|
|
|
|
|
|
|
|
|
|
|
|
|
|
|
|
|
|
|
|
||
|
|
|
|
|
|
|
|
|
|
|
|
|
|
|
|
|
|
|
|
|
|
|
|
|
|
|
|
|
|
|
|
|
|
|
|
|
|
|
|
|
|
|
|
|
|
|
|
|
|
|
|
|
|
Boiler |
|
|
|
|
DE-NOx |
|
|
AH |
|
|
|
|
|
|
|
|
|
|
|
EP (LT) |
|
|
De-SOx |
Stack |
|||||||||||||||||
|
|
|
|
|
|
|
|
|
|
|
|
|
|
|
|
|
|
|
|
|
|
|
|
|
|
|
|
|
|
|
|
|
|
|
|
|
|
|
|
|
|
|
|
|
|
|
|
|
|
|
|
|
|
|
|
|
|
|
|
|
|
|
|
|
|
|
|
|
NH3 |
|
|
|
|
|
|
|
|
|
|
|
|
|
|
|
|
|
|
|
|
|
|
|
|
||
|
|
|
|
|
|
|
|
|
|
|
|
|
|
|
|
|
|
|
|
|
|
|
|
|
|
|
|
|
|
|
|
|
|
|
|
|
|
|
|
|
|
||||||
|
Low-dust |
|
|
|
|
|
|
|
|
|
|
|
|
|
|
|
|
|
|
|
|
|
|
|
|
|
|
|
|
|
|
|
|
|
|
|
|
|
|
|
|
|
|||||
|
System |
|
|
|
|
|
|
|
|
|
|
|
|
|
|
|
|
|
|
|
|
|
|
|
|
|
|
|
|
|
|
|
|
|
|
|
|
|
|
|
|
|
|||||
|
|
|
|
|
|
|
|
|
|
|
|
|
|
|
|
|
|
|
|
|
|
|
|
|
|
|
|
|
|
|
|
|
|
|
|
|
|
|
|
|
|||||||
|
|
|
|
|
|
Boiler |
|
|
|
|
|
EP (HT) |
|
|
|
|
DE-NOx |
|
|
|
|
|
|
|
|
|
|
|
|
|
|||||||||||||||||
|
|
|
|
|
|
AH |
|
De-SOx |
Stack |
||||||||||||||||||||||||||||||||||||||
|
|
|
|
|
|
|
|
|
|
|
|
|
|
|
|
|
|
|
|
|
|
|
|
|
|
|
|
|
|
|
|
|
|
|
|
|
|
|
|
|
|
|
|
|
|
|
|
|
|
|
|
|
|
|
|
|
|
|
|
|
|
|
|
|
|
|
|
|
|
|
|
|
|
|
|
|
|
|
|
|
|
|
|
|
|
|
|
|
|
|
|
|
|
|
|
|
|
|
|
|
|
|
|
|
|
|
|
|
|
|
|
|
|
|
|
|
|
|
|
|
|
|
|
|
|
|
|
|
|
|
|
|
|
|
|
|
|
|
|
|
|||
|
|
|
|
|
|
|
|
|
|
|
|
|
|
|
Fuel |
|
|
|
|
|
|
NH3 |
|
|
|
|
|
|
|
|
|
|
|
|
|
|
|
||||||||||
|
|
|
|
|
|
|
|
|
|
|
|
|
|
|
|
|
|
|
|
|
|
|
|
|
|
|
|
|
|
|
|
|
|
DE-NOx |
|
|
|
|
|
|
|
|
|
|
|||
|
|
|
|
|
|
|
|
|
|
|
|
|
|
|
|
|
|
|
|
|
|
|
|
|
|
|
|
|
|
|
|
|
|
|
|
|
|
|
|
|
|
|
|
||||
|
Combined |
|
|
|
|
|
|
|
|
|
|
|
|
|
|
|
|
|
|
|
|
|
|
|
|
|
|
|
|
|
|
|
|
|
|
|
|
|
|
|
|
||||||
|
|
|
|
|
|
|
|
|
|
|
|
|
|
|
|
|
|
|
|
|
|
|
|
|
|
|
|
|
|
|
|
|
|
|
|
|
|
|
|
|
|
||||||
|
Cycle |
|
|
|
|
|
|
|
|
|
|
|
|
|
|
|
|
|
|
|
|
|
|
|
|
|
|
|
|
|
|
|
|
|
|
|
|
|
|
|
|
|
|||||
|
|
|
|
|
|
|
|
|
|
|
|
|
|
|
|
|
|
|
|
|
|
|
|
|
|
|
|
|
|
|
|
|
|
|
|
|
|
|
|
|
|
|
|
|
|
|
|
|
|
|
|
|
|
|
|
|
|
|
|
|
|
|
|
|
|
|
|
|
|
|
|
|
|
|
|
|
|
|
|
|
|
|
|
|
|
|
|
|
|
|
|
|
|
|
|
|
|
|
|
|
|
|
|
|
|
|
|
Gas Turbine |
|
|
|
|
|
|
|
|
|
|
|
|
|
|
|
|
|
|
|
|
|
|
|
|
|
|
|
|
|||||||
|
|
|
|
|
|
|
|
|
|
|
|
|
|
|
|
|
|
|
|
|
HRSG |
|
|
|
|
Stack |
|
|
|||||||||||||||||||
|
|
|
|
|
|
|
|
|
|
|
|
|
|
|
|
|
|
|
|
|
|
|
|
|
|
|
|
|
|
|
|
|
|||||||||||||||
|
|
|
|
|
|
|
|
|
|
|
|
|
|
|
|
|
|
|
|
|
|
|
|
|
|
|
|
|
|
|
|
|
|
|
|
|
|
|
|
|
|
|
|
|
|
|
|
|
|
|
|
|
|
|
|
|
|
|
|
|
|
|
Fuel |
|
|
|
|
|
|
NH3 |
|
|
|
|
|
|
|
|
|
|
|
|
|
|
|||||||||||
|
|
|
|
|
|
|
|
|
|
|
|
|
|
|
|
|
|
|
|
|
|
|
|
|
|
|
|
|
|
|
|
|
|
|
|
|
|
|
|
|
|
|
|||||
|
Simple |
|
|
|
|
|
|
|
|
|
|
|
|
|
|
|
|
|
|
|
|
|
|
|
|
|
|
|
|
|
|
|
|
|
|
|
|
|
|
|
|
|
|||||
|
Cycle |
|
|
|
|
|
|
|
|
|
|
|
|
|
|
|
|
|
|
|
|
|
|
|
|
|
|
|
|
|
|
|
|
|
|
|
|
|
|
|
|
|
|||||
|
|
|
|
|
|
|
|
|
|
|
|
Gas Turbine |
|
|
|
|
|
|
|
|
|
|
|
|
|
|
|
|
|
|
|
|
|
|
|
|
|
|
|
|
|
|
|||||
|
|
|
|
|
|
|
|
|
|
|
|
|
|
|
|
|
|
|
|
|
|
|
|
|
|
|
|
|
|
|
|
|
|
|
|
|
|
|
|
|
|
||||||
|
|
|
|
|
|
|
|
|
|
|
|
|
|
|
|
|
|
|
|
|
|
|
|
|
|
|
|
DE-NOx |
|
|
|
|
|
Stack |
|
|
|
||||||||||
|
|
|
|
|
|
|
|
|
|
|
|
|
|
|
|
|
|
|
|
|
|
|
|
|
|
|
|
|
|
|
|
|
|
|
|
|
|
|
|
|
|||||||
Fig- 3: Denitration process flow
Reference: P-93 of Journal (No.649: Oct. /2010): TENPES
10
1.1.2Denitration facility for gas turbine
The denitration equipment for gas turbine combined cycle has been installed subsequently spraeded widely in the 1990s. On the other hand, the denitrization equipment for simple gas turbine has not spread from the viewpoint of energy saving, though several plants were established in the 1990s.
1.1.3Trends of denitrification technology
This section describes the recent technical development in coal-fired denitration after 40 year have been put into practical use of selective catalytic reduction system for NOx removal equipment.
(1)Regeneration of catalyst
The catalytic performance is degraded through a period of time from start of operation. It was required to replace catalysts in order to stably operate the plant up to now. However, the catalyst recycling techniques have been studied and some partial catalyst regeneration technology is imposed by type and form in the viewpoint of cost reduction of catalyst and environmental protection.
(2)Large grain ash
In the recent years, a problem of the catalyst clogging has been seen due to flying ash from boiler with relatively large particle size. It is necessary ingenuity to prevent the ash with large particle size from reaching denitration facility with large hopper or to prevent reaching to the catalysts by means of installing mesh at the entrance of the catalysts.
(3)Low SO2 oxidation catalyst
With the diversification of coal-fired thermal power plants, a high concentration of sulfur oxides (SOx) context in the flue gas when using with high sulfur coal as fuel for thermal power plant. On the other hand, in case of denitration catalyst mainly composed of titanium and vanadium oxide which has large application results, following problems tend to occur due to the produced high concentrations SO3 , since it has also slight function to oxide SO2 (side reactions) apart from NOx reduction function.
1)Precipitation of acidic ammonium sulfate in the wake of AH
2)Corrosion of equipment at low temperature part such as AH
3)Occurrence of purple smoke
Therefore, when using these fuels, NOx catalytic that inhibited SO2 oxidation as much as possible are required while maintaining function for NOx reduction (denitration).
(4)Ammonia uniform distribution technology
Technique to disperse NH3 as the reduction agent in the reactor uniformly is used as a way to
11
measure the efficiency of denitration equipment for further strict regulations in the future. Generally, the method is employed to installed multiple nozzles in the flue gas duct prior to the reactor by gridding the NH3 injection nozzle, since homogeneous mixing is limited if NOx distribution in the flow of nozzle is large. So recently, a new effect is being made to take place in the effective dispersion in mixer by installing a flow mixer (static mixer) in front of denitration facility. In addition, attempts to optimize the required number and position of the mixture have been made by flow model and computer simulation in order to ensure uniform mixing of NH3.
2.Desulfurization
2.1Summary of desulfurization technology
Flue gas desulfurization equipment has been installed in Japan in earnest since the 1970s, which continued well established into 2000s. Its mainstream is wet limestone-gypsum method which absorbent is cheap and markets of byproduct are stable. Facilities which have following features have been installed, though the number of facility tends to decrease since the beginning of 2000s with the slowdown in electricity demand, if browsing by age and status of installation of flue gas desulfurization for domestic thermal power plants for business use.
1)Large capacity of facility; series according to the boiler
2)High efficiency; high efficient desulfurization, high concentration of absorbent, high efficient oxidation system
3)Pursuit of more compact and rationalization; adoption of very low temperature EP, rationalization of the installation position of BUF
2.2.Desulfurization system
The mainstream processes of flue gas desulfurization is wet limestone-gypsum, there are the activated carbon absorption method, electric beam method, semi-dry method as other processes. Also the wet limestone-gypsum method is divided into several systems according to the gas properties and emission regulations. Here is a typical process outlined below;
(1)Dry activated carbon method
This method has not only the absorbent function of activated carbon but the simultaneous desulfurization and denitrification method using as a catalyst. The block flow is shown in Fig-4 and
5.This method has the features that re-heating equipment is not required, no drop of humidity in the flue gas, it is possible to recover sulfuric acid or sulfur as byproduct in addition to the simultaneous desulfurization and denitrification method.
12
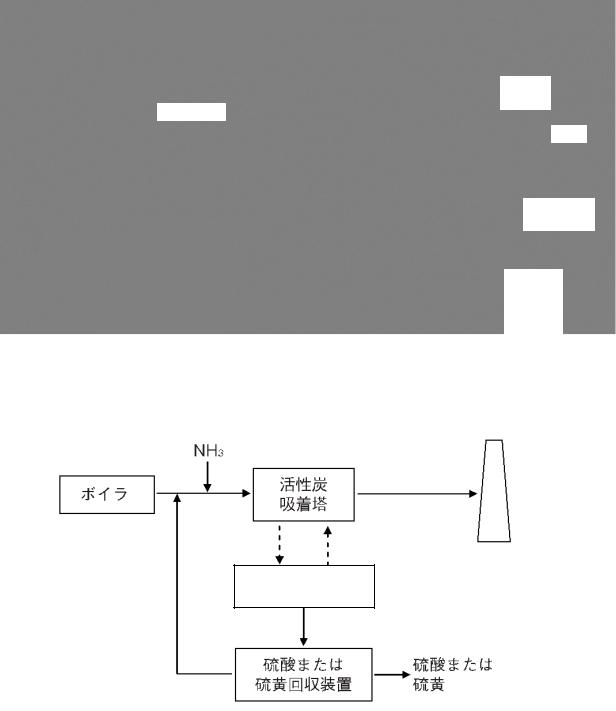
|
|
|
|
|
|
|
|
|
|
|
NH3 |
|
|
|
|
|
|
|
|
|
|
|
|
|
|
|
|
|
|
|
|
|
|
|
|
|
|
|
|
|
|
|
Downstreem |
|
|
|
|
|
|
|
|
|
|
|
|
|
|
|
|
|||||||||
|
|
SCR De-NOx |
EP |
|
|
|
|
|
|
|
|
|
|
|
|
|
|
Dust |
|
|||
|
|
|
|
|
|
|
|
|
|
|
|
|
|
|
|
|
|
Collector |
|
|||
|
|
|
|
|
|
|
||||||||||||||||
|
|
|
|
|
|
|
|
|
|
|||||||||||||
Boiler |
|
|
|
|
|
|
|
IDF |
||||||||||||||
|
|
|
|
|
|
|
|
|
|
|
|
|
|
|
|
|
|
|
|
|||
|
AH |
|
|
|
|
|
|
|
|
|
|
|
|
|
|
|
|
|
||||
|
|
|
|
|
|
|
|
|
|
|
|
|
|
De-SOx |
|
|
|
|
||||
|
|
|
|
|
|
|
|
|
|
|
|
|
|
|
|
|
|
|||||
|
|
|
|
|
|
|
|
|
|
|
|
|
|
|
|
|
|
|
||||
|
|
|
|
|
|
|
|
|
|
|
|
|
|
|
Tower |
|
|
|
|
|||
|
|
|
|
|
|
|
|
|
|
|
|
|
|
|
|
|
|
|
|
|
||
|
|
|
|
|
|
|
|
|
Off Gas |
|
|
|
|
|
|
|
|
|
|
|
||
|
|
|
|
|
|
|
|
|
|
|
|
|
Activated Carbon |
|
||||||||
|
|
|
|
|
|
|
|
|
|
|
|
|
|
|
|
|
||||||
|
|
|
|
|
|
|
|
|
|
|
|
|
|
|
|
|
||||||
|
|
|
|
|
|
|
|
|
|
|
|
|
|
|
|
|
|
|
|
|
||
|
|
|
|
|
|
|
|
|
|
|
|
|
|
|
|
|
Sulfuric Acid |
|
||||
|
|
|
|
|
Sulfuric Acid |
|
|
|
||||||||||||||
|
|
|
|
|
|
|
|
|
|
|
|
|
Production Unit |
|
||||||||
|
|
|
|
|
|
|
|
|
|
|
|
|
|
|
|
|
|
|||||
|
|
|
|
|
|
|
|
|
|
|
|
|
|
|
|
|
|
|
|
|||
|
|
|
|
|
|
|
|
|
|
|
|
|
|
|
|
|
|
|
Regenerated Gas |
|||
|
|
|
|
|
|
|
|
|
|
|
|
|
|
|
|
|
|
|
|
Wash-water |
||
Fig- 4: Activated carbon absorption system flow (Isogo)
Reference: P-44 of Journal (No.579: Dec. /2004): TENPES
Regeneration
Tower
Stack
Regenerated
Gas
Activated
Carbon
+
Fly-ash
|
|
NH3 |
|
|
|
|
|
|
|
|
|
|
|
|
|
|
|
|
|
|
|
Activated Carbon |
|
Boiler |
|||||
|
|
|
Absorption Tower |
||
|
|
|
|
||
|
|||||
|
|
|
|
|
Stack
Regeneration
Tower
|
|
|
Sulfuric Acid or |
|
Sulfuric Acid |
Sulfur Recovery Unit |
|
or Sulfur |
|
|
|
|
|
|
Fig- 5: Activated carbon absorption block flow
Reference: P-94 of Journal (No.649: Oct. /2010): TENPES
(2)Wet limestone-gypsum method
1)For conventional coal-fired systems
The wet limestone-gypsum method is the method to react slurred limestone (CaCO3) with SO2 in the absorption tower and recover gypsum absorbed SO2 as the byproduct. The main block flow
13
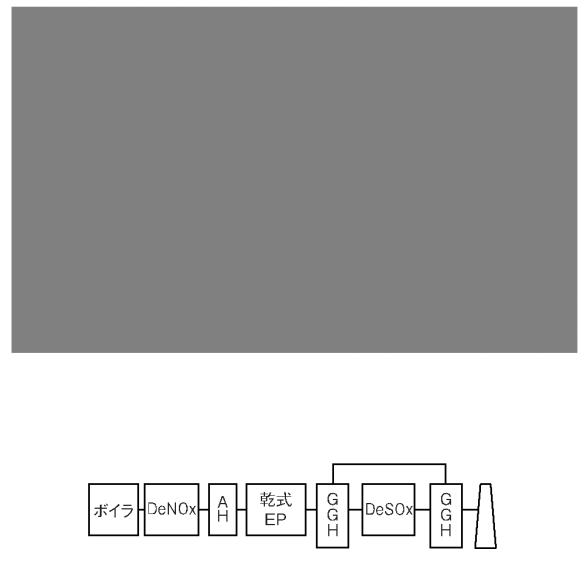
is shown in Fig-6 and 7.
Fig- 6: System diagram of desulfurizer by Lime-Gypsum method (IHI)
Reference: P-23 of Journal (No.570: Mar. /2004): TENPES
Non-leak GGH
|
|
Dry |
|
Boiler |
|||
|
EP |
||
|
|
||
|
|||
|
|
|
Stack
Fig- 7: Block flow of Limestone-Gypsum method
Reference: P-94 of Journal (No.649: Oct. /2010): TENPES
2)For very low temperature EP systems
The environmental facility with a low temperature highly efficient dust removal system are being adopted for recent most stringent emission regulations such as less than 10mg/m3N dust concentration at outlet as away to support more rational in terms of equipment. The main block flow is shown in Fig-8.
14
Non-leak GGH
|
|
VL Temp. |
|
Boiler |
|||
|
Dry EP |
||
|
|
||
|
|
|
Stack
Fig- 8: Block flow of very low temperature EP environmental system
Reference: P-94 of Journal (No.649: Oct. /2010): TENPES
3)For heavy oil-fired systems
The concentration of SO3 is higher in the flue gas, since much sulfur is contained in the heavy-oil fuel. There is a way of injecting ammonia into the flue gas duct as a high SO3 concentration measures. The main flow of the environmental facility which conducting ammonia injection is shown in Fig-9.
Non-leak GGH
|
|
NH3 Injection |
|
||
|
|
|
|
|
|
|
|
|
Dry |
||
Boiler |
|||||
|
|
EP |
|||
|
|
|
|||
|
|||||
|
|
|
|
|
|
Stack
Fig- 9: Block flow of ammonia injection environmental system
Reference: P-95 of Journal (No.649: Oct. /2010): TENPES
3.Dust collection
3.1Summery of dust collection technology
The dust collection system for the thermal power plant facility for business use is shown in Fig-10. The dry type EP as the ammonia injection method is adopted for heavy-oil fired thermal power plant and the wet type EP in the wake of the wet desulfurization equipments have been used depending on the concentration of sulfur in the fuel. The low temperature dust collection method, very low temperature dust collection method and high temperature dust collection method for the coal-fired thermal power plant. The very low temperature EP has become mainstream in new coal-fired power plants, the method to provide wet type electrostatic precipitator in the wake of the wet desulfurization equipments have been used.
15
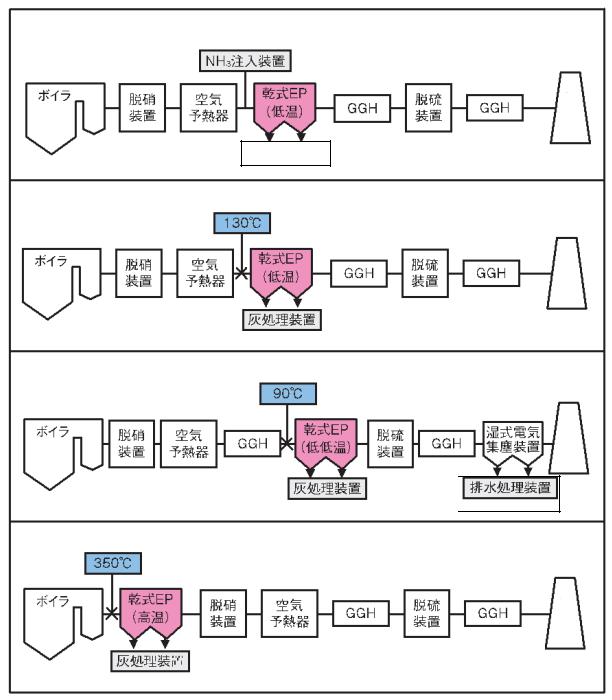
(1) Heavy Oil Fired NH3 Injection Dust Collection System
|
|
|
|
|
NH3 Injection |
|
|
|
|
|
|
|||
|
|
|
|
|
|
|
|
|
|
|
|
|
|
|
|
|
|
|
|
|
|
|
|
|
|
|
|
|
|
Boiler |
|
|
|
|
|
|
Dry Ep |
|
|
|
|
|
|
|
|
De- |
|
|
AH |
GGH |
|
De- |
|
GGH |
|||||
|
|
|
|
|
(L/Temp.) |
|
|
|
||||||
|
|
NOx |
|
|
|
|
|
SOx |
|
|||||
|
|
|
|
|
|
|
|
|
|
|
|
|
||
|
|
|
|
|
|
|
|
|
|
|
|
|
|
|
|
|
|
|
|
|
|
|
|
|
|
|
|
|
|
Ash Treatment
(2) Coal Fired Low Temperature Dust Collection System
Stack
Boiler |
|
|
|
|
|
|
Dry Ep |
|
|
|
|
|
|
|
De- |
|
|
|
|
De- |
|
|
|||||
|
AH |
GGH |
GGH |
||||||||||
|
|
NOx |
|
|
|
(L/Temp.) |
|
|
SOx |
|
|||
|
|
|
|
||||||||||
|
|
|
|
|
|
|
|
|
|
|
|
||
|
|
|
|
|
|
|
|
|
|
|
|
|
|
|
|
|
|
|
|
|
|
|
|
|
|
|
|
|
|
|
|
|
|
|
|
|
|
|
|
|
|
|
|
|
|
|
|
Ash Treatment |
|
|
|
|
|
||
|
|
|
|
|
|
|
|
|
|
|
|
|
|
(3) Coal Fired Very Low Temperature Dust Collection
Stack
Boiler |
|
|
|
|
|
|
|
Dry Ep |
|
|
|
|
|
|
|
|
|
|
|
|
|
|
|
|
|
|
De- |
|
|
|
|
|
|
|
|||
|
De- |
|
AH |
|
GGH |
|
GGH |
|
|
Wet EP |
|
|||||||
|
|
|
|
|
(VL/Temp.) |
|
|
|
|
|
||||||||
|
||||||||||||||||||
|
|
NOx |
|
|
|
|
|
|
|
|
SOx |
|
|
|
|
|
|
|
|
|
|
|
|
|
|
|
|
|
|
|
|
|
|
|
|
||
|
|
|
|
|
|
|
|
|
|
|
|
|
|
|
|
|
|
|
|
|
|
|
|
|
|
|
|
|
|
|
|
|
|
|
|
|
|
|
|
|
|
|
|
|
|
|
|
|
|
|
|
|
|
|
|
|
|
|
|
|
|
|
|
Ash Treatment |
|
|
|
|
|
Waste-water |
|||||
|
|
|
|
|
|
|
|
|
|
|
|
|
|
|
|
Treatment |
||
|
|
|
|
|
|
|
|
|
|
|
|
|
|
|
|
|||
Stack
(4) Coal Fired High Temperature Dust Collection System
Boiler |
|
|
Dry Ep |
|
|
|
|
|
|
|
|
|
|
|
De- |
|
AH |
|
GGH |
|
De- |
|
GGH |
||||||
|
|
|
(H/Temp.) |
|
|
|
|
|
|
|||||
|
|
|
|
NOx |
|
|
|
SOx |
|
|||||
|
|
|
|
|
|
|
|
|
|
|
|
|
||
|
|
|
|
|
|
|
|
|
|
|
|
|
|
|
|
|
|
|
|
|
|
|
|
|
|
|
|
|
|
|
|
|
|
|
|
|
|
|
|
|
|
|
|
|
|
|
Ash Treatment |
|
|
|
|
|
|
|
|
|
|
||
|
|
|
|
|
|
|
|
|
|
|
|
|
|
|
Stack
Fig10: Dust collection technology for commercial thermal power plants
Reference: P-96 of Journal (No.649: Oct. /2010): TENPES
3.2Trends in dust collection technology
(1)EP for coal-fired thermal power plant
Coal used in the coal-fired power generation facility is more than 99% overseas coal, and is imported from Australia, Indonesia, China and Russia. Recently, a change of type of fuel coal for thermal power plants is carried out in the short time. The electrical resistivity of fly ash dust generated when
16
burning overseas coal is higher than 1011Ωcm. An abnormal performance degradation of dust collection due to the reverse ionization in the electric precipitator is experienced even in very lower temperature depending on the type of coal. It is necessary measures such as selection and blending of coal. Inlet and outlet damper system and moving electrode system is used as the EP for the coal-fired thermal power plant, since an instantaneous increase of dust concentration at the time of dust collection becomes a problem when hammering (re-scattering due to hammering) to suit the requirement to decrease the outlet dust concentration.
1)Inlet and outlet damper system
The no-charge hammering method which providing the dampers in inlet and outlet of electric precipitator, stopping gas flow in the dust collection chamber by hammering and hammering after stop to charging of the discharge electrode is used in order to prevent a momentary increase in dust concentration due to hammering. The dust collection performance after hammering can be expected to improve, since the effect of dust removal on dust collecting plate is improved by no-charge hammering.
2)Moving electrode system
The schematic structure of the moving electrode system is shown in Fig-11 and 12. Dust collection is performed by the moving electrode connected divided into dust collection electrode strips in the final zone, connecting by a chain and collecting dust while moving at a speed of about 0.5m/min. Re-entrainment is hard to occur, since collected dust on the dust collection electrode will be removed by scraping brush provided in hopper rather than by hammering. In addition, it is possible to achieve high performance regardless of the electrical resistivity of dust and miniaturize the electric precipitator by completely brushing off. In principle, there is no re-entrainment in moving electrode system due to hammering. It is possible to halve the outlet dust concentration compared with the traditional fixed-electrode system by means of applying the moving electrode method to the final zone of electric precipitator.
17
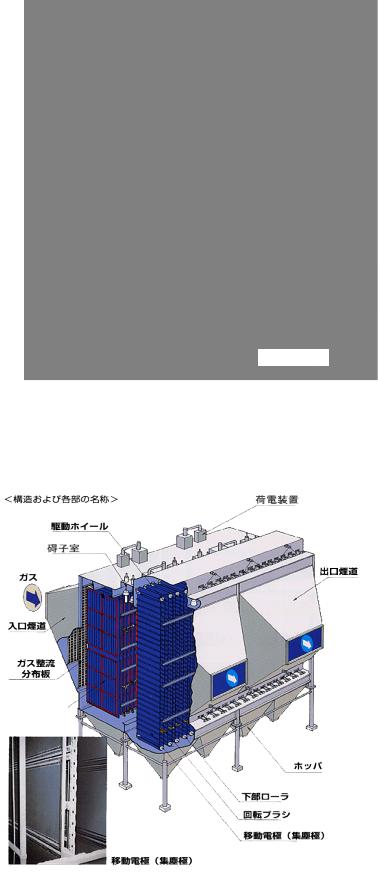
|
|
|
|
|
|
|
|
Dust Collection |
|||
|
|
Chain |
|
|
|
|
|
|
Electrode |
||
|
|
|
|
|
|
|
|
|
Drive Unit |
||
|
|
|
|
|
|||||||
|
|
Dust |
|
|
|
|
|
|
|
|
|
|
|
|
|
|
|
|
|
|
|
||
|
|
|
|
|
Dust Collection |
|
|
||||
|
|
Collection |
|
|
|
|
|||||
|
|
|
|
|
Electrode |
|
|
||||
|
|
Plate |
|
|
|
|
|||||
|
|
|
|
|
Drive Wheel |
|
|
||||
|
|
Element |
|
|
|
|
|||||
|
|
|
|
|
|
|
|
|
|
||
|
|
|
|
|
|
|
|
|
|
||
|
|
|
|
|
|
|
|
|
|
|
|
|
|
|
|
|
|
|
|
|
|
|
|
|
|
|
|
|
|
Discharge Electrode |
|
||||
|
|
|
|
|
|
|
|
|
|
||
|
|
|
|
|
|
|
|
|
|
|
|
|
Rotary Brush |
|
|
|
|
|
|
|
|||
|
|
|
|
|
|
|
|
|
Rotary Brush |
||
|
|
|
|
|
|||||||
|
|
|
|
|
|
|
|
|
Drive Unit |
||
Lower Roller
Fig11: Moving electrode system (Hitachi)
Reference: P-97 of Journal (No.649: Oct. /2010): TENPES
|
|
|
|
|
|
|
|
|
|
Charged Equipment |
|
|
|
|
|
|
|
|
|
|
|
|
|
|
|
|
|
|
|
|
|
|
|
|
|
|
|
|
|
|
|
|
|
Drive Wheel |
|
|
|
|
|
||
|
|
|
|
|
|
|
|
|
|
|||
|
|
|
Insulator Chamber |
|
|
|
|
|
|
|||
|
|
|
|
Outlet |
||||||||
|
|
|
|
|
|
|
|
|
|
|
|
|
|
|
|
|
|
|
|
|
|
|
|
Flue Duct |
|
|
|
|
Gas |
|
|
|
|
|
|
|
||
|
|
|
|
|
|
|
|
|
|
|
||
|
|
|
|
|
|
|
|
|
|
|
|
|
|
|
Inlet |
|
|
|
|
|
|
|
|
||
Flue Duct |
|
|
|
|
|
|
|
|
||||
|
|
|
|
|
|
|
|
|
||||
|
|
|
Gas |
|
|
|
|
|
|
|||
|
|
Rectifier |
|
|
|
|
|
|
||||
Fixed Electrode
(Dust Collection
Electrode)
|
|
|
|
Hopper |
|
||
|
|
|
|
|
|||
|
|
|
Lower Roller |
|
|||
|
|
|
|
||||
|
|
|
Rotary Brush |
|
|||
|
|
|
|||||
Moving Electrode |
|
|
Moving Electrode |
||||
(Dust Collection |
|
|
(Dust Collection Electrode) |
||||
|
|
|
|||||
Electrode) |
|
|
|
|
|
|
|
|
|
|
|
|
|
|
|
Fig12: Moving electrode system (Hitachi)
http://www.hitachi-pt.co.jp/products/energy/dustcollection/dry_type/mobile_electrode.html
18

Discharge |
|
|
|
|
Insulator Chamber |
|
|||
Electrode |
|
|
||
|
|
|
||
Charged Equipment |
||||
|
|
|||
Dust Collection
Electrode
Gas
Rectifier
Inlet
Flue Duct
Outlet
Flue Duct
Discharge Electrode
Hammering Device
Collecting Electrode
Hopper Hammering Device
Fig13: Fixed electrode system (Hitachi)
http://www.hitachi-pt.co.jp/products/energy/dustcollection/dry_type/index.html
(2)Bag filter for coal-fired thermal power plant
Bag filter is the device for collecting dust in the flue gas by woven and non woven filter cloth as shown in Fig-14. It is called the bag filter because a cylindrical filter cloth is hung. A number of cylindrical filtration cloths have been installed in the each room of the large bag filter to separate the dust collection chamber and the dust collection hopper is arranged at the bottom of the dust collection chamber to collect removed dust. The principle of dust collection of the bag filter is to filtrate and collect dust contained in the processed flue gas by deposited dust layer deposited on the surface of the filter cloth or inside of filter cloth (the primary dust layer). Generally, the filtration rate of flue gas through the filter cloth is about 0.3~2mm/min, pressure loss is 1~2kPa. Since the pressure loss increases if collected dust layer on the filter cloth becomes thick, the collected dust must be brush off intermittently. Dust removal is performed by 1) to flow gas from the back of filter cloth, 2) to concussion, etc. In the most cases, it can be achieved more than 99% of dust collection rate and about 10mg/m3N of the outlet dust concentration.
19
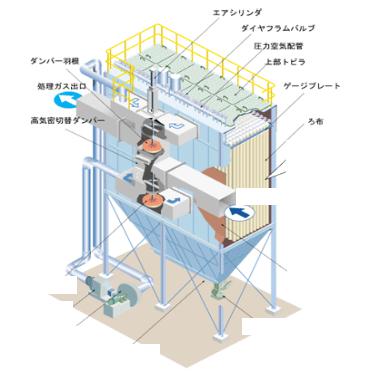
|
|
|
|
|
|
Air Cylinder |
|
|
|
|||||||
|
|
|
|
|
|
|
|
|||||||||
|
|
|
|
|
|
|
Diaphragm Vaives |
|
||||||||
|
|
|
|
|
|
|
|
|
|
|
|
|
|
|
|
|
|
|
|
|
|
|
|
|
Compressed Air Piping |
||||||||
|
Damper Blade |
|
|
|
|
|
||||||||||
|
|
|
|
|
|
|
|
|
|
|
|
|
|
|||
|
|
|
Roof Door |
|
|
|
||||||||||
|
|
|
|
|
|
|
|
|
|
|
|
|||||
|
|
|
|
|
|
|
|
|
|
|
|
|
|
|||
|
|
|
|
|
|
|
|
|
|
|
|
|
|
|
|
|
Clean Gas Outlet |
|
|
|
|
|
|
|
|
|
|
|
|
|
|||
|
|
|
|
|
Gauge Plate |
|
||||||||||
|
|
|
|
|
|
|
|
|
|
|
|
|
|
|
|
|
|
|
|
|
|
|
|
|
|
|
|
|
|
|
|
|
|
|
|
Airtight Damper |
|
|
|
|
|
|
|
Bag Fillter |
|
|||||
|
|
|
|
|
|
|
|
|
|
|
|
|
|
|
|
|
Gas Inlet
Buffle Plate
Damper Blade
Bag Fillter
Humidizer Lock Valve
Fan
Screw Conveyor
Fig14: Bag filter system (Hitachi)
http://www.hitachi-pt.co.jp/products/energy/bugfilter/architecture/index.html
(3)Co-firing of woody biomass
In an effort to suppress emissions of CO2, coal-fired power generations facilities which are implementing of are planning co-firing woody biomass have been increased. Woody biomass which wood chips or sawdust is processed to pellets is mixed with coal on a conveyor to transport coal, pulverized in a mill and used as fuel. In coal-fired power plants that are currently co-firing woody biomass, which can be operated without special modifications. It is necessary to focus the effect of co-firing to dust collection of woody biomass in future.
(4)Firing of residual oil and petroleum coke
The use of residual oil containing 3~5% sulfur and petroleum coke has increased in the private power generation facilities incidental to petroleum refining facility. The method to collect sulfur as ammonium sulfate powder (ammonia sulfate) by the ammonia injection for residual oil combustion, the method to use the dry type EP for dust collection and the wet type EP for sulfuric acid mist in the flue gas from desulfurizer is applied. In the ammonia injection method, the gas temperature control system by water spray has been taken, since an adherence problem if the gas temperature in dust concoctions is too high causes deterioration of ammonia sulfate, altering of the discharge electrode and deposition of dust on collection plate.
20

Article 221. Principle of effluent treatment
Article 221-1. Principle of effluent treatment
1.Wastewater discharged from each process is made based on the water coming into that process, chemicals, fuel oil, combustion products are added to, corrosion products is added from the surface in contact with water, in addition, the indirect contacting is contaminated by leaked materials and is contaminated from dust by contacting with air. On the other hand, only the amount of leaked water is reduced, further evaporation to the atmosphere, to be reduced by the deposition of the contact surface. In case of rain, contamination from contacted objects on the way to a stream of rain is added and an amount of water equivalent to evaporation and percolation is reduced.
Wastewater from washing water is based on the raw water, in addition to it, chemicals used in chemical cleaning is added and corrosion products or scale from cleaning surface is added. On the other hand, water equivalent amount of evaporation and leakage is reduced. The direction of wastewater discharged from the emission source is shown in Fig-15. In addition to the suburban drainage, there must be disposed of as industrial waste in the form of sludge cake other than lost due to evaporation into the atmosphere, infiltration to underground and absorption to absorbent.
|
|
|
|
|
to Air |
|
|
|
|
to the Surface and Underground |
|
|||||||
|
|
|
|
|
|
|
|
Natural |
|
|
Natural |
|
|
|||||
|
|
|
|
|
|
|
|
|
|
|||||||||
|
|
|
|
|
|
|
|
Evaporation, |
|
Penetration, |
|
|||||||
|
|
|
|
|
|
|
|
Watering |
|
Watering |
|
|||||||
|
|
|
|
|
|
|
|
|
|
|
|
|
|
|
|
|
|
|
|
|
|
|
|
|
|
|
|
|
|
|
|
|
|
|
|
|
|
|
|
|
|
|
|
|
|
|
|
|
|
|
|
|
|
|
Drinage outside |
|
Drinage |
|
|
|
|
|
|
|
|
|
|
|
|||||||
|
|
|
|
|
|
|
|
|
|
|
|
|
|
|
|
|
|
the Premises |
|
|
|
|
|
|
|
|
|
|
|
|
|||||||
|
|
|
|
|
|
|
|
|
|
|
|
|
|
|
|
|||
|
|
|
|
Waste-water |
|
|
|
|
|
|
|
|
|
|
||||
|
|
|
|
|
|
|
|
|
|
|
|
|||||||
|
|
|
|
Treatment |
|
|
|
|
|
|
|
|
|
|
|
|||
|
|
Absorbent |
|
|
|
|
|
|
|
Sludge Cake |
|
|
|
Recovery and Reuse |
|
|
||
|
|
|
|
|
|
|
|
|
|
|
|
|
|
|||||
|
|
|
|
|
|
|
|
|||||||||||
|
|
|
|
|
|
|
|
|
|
|
|
|
|
|
|
|
|
|
|
|
|
|
|
|
|
|
|
|
|
|
|
|
|
|
|
|
|
Fig15: Direction of drainage
Reference: P-39 journal of (No.609: Jun. /2007): YEMPES
2.Nature and treatment of wastewater
Wastewater is discharged from the various process and quality and amount discharged from there varies significantly depending on operation conditions as whether that the process is operating or stop, degree of load. In addition, the water temperature for processing as a major factor is up to something high. There is a huge range for the concentration of contained oil depending on the emission conditions such as discharge source, rain operation even if oil-containing wastewater. Then, the wastewater treatments to treat wastewater discharged to have a certain quality regardless of its
21

volume or quality.
3.Operation unit of wastewater treatment
(1)Neutralization and pH adjustment
Neutralization is performed in order to conform to emission standard of pH. Neutralization means the reaction to produce water and salts by adding acid and alkali, treatment of wastewater must be within a pH range of emission standard. On the other hand, it is called pH adjustment in order to proceed with a particular reaction in the wastewater treatment process; it is performed to remove the metal ions as mainly hydroxides. In this case, it must be noted that the results vary widely depending handled by adjusting pH. If developing the wastewater neutralization curves, it can be know the characteristics of the wastewater other than determination of the amount of chemicals required for neutralization and pH adjustment. Neutralization curve describes the variation as an amount of neutralization agent for the horizontal axis and pH value of the effluent taken up for the vertical axis. Fig-16-І shows the notarization hydrochloric acid with caustic soda; Fig-16 shows the case that containing metal ions and rise in pH has become loose under the influence of containing metal ion. Actually, pH adjustment of wastewater is an operation that metal ions in the wastewater can be aggregated and precipitated as hydroxide. In fact, Fig-16 shows an example neutralization curve of wastewater. Typically, hydrated lime, caustic soda, sulfuric acid and hydrochloric acid are used as neutralization agent used in the neutralization and pH adjustment.
pH
HCl+NaOH
HCl+Cu+Zn+NaOH
Production of
Zink hydroxide (Zn(OH2))
Production of copper hydroxide (Cu(OH2))
pH
Amount of added sodium hydroxide |
|
Amount of added sodium hydroxide (mg/l) |
|
|
|
Fig16: Neutralization curve
Reference: P-41 of Journal (No.609: Oct. /2007): TENPES
(2)Coagulation
Flocculation is a method for generating flock by adding a coagulant in water, removing SS or colloidal turbidity constituents which cannot be removed by filtration. Fig-17 shows the particle aggregation model. In the coagulation of the wastewater, hydroxide may be generated by adjusting pH in order to remove metal ions. Fig-18 shows the relationship between pH and each hydroxide.
22
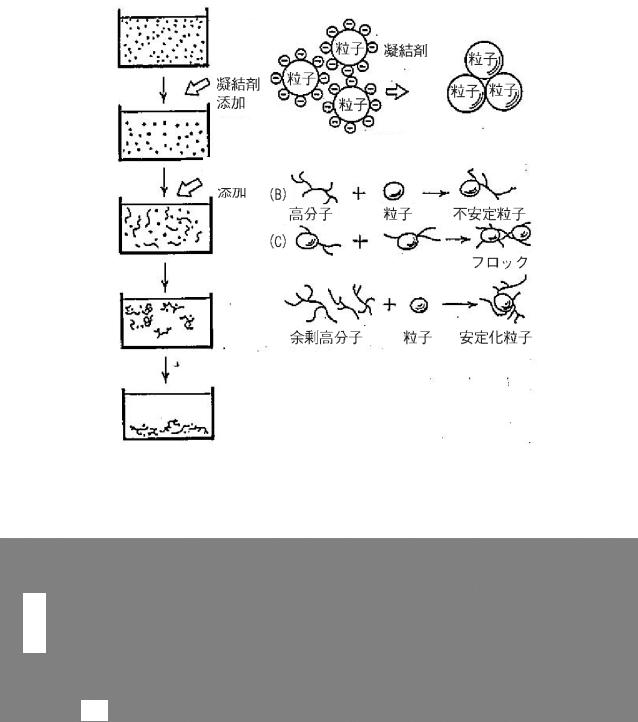
Recently, the circular sedimentation tank which has high efficient precipitation performance is used, though there is a transverse type and circular type for the flocculation sedimentation tank. A structural example of thickener is shown in Fig-19 and 21. Wastewater containing a cohesive flock is flow into the center. It has the construction to overflow supernatant from top circle catchment; sludge has been scraped to center bottom by rake and discharge sludge.
(A) Condensation
(C) Precipitation (B) Bridging absorption
Solubility
pH
The suspension
|
|
|
|
|
|
|
|
|
|
|
|
|
|
|
|
|
|
|
|
|
|
|
|
|
|
|
|
|
|
|
|
|
|
|
|
|
|
|
|
|
|
|
|
|
|
|
|
|
|
|
|
|
|
|
|
|
|
|
|
|
|
|
|
|
|
|
|
|
|
|
|
|
|
|
|
|
|
|
|
|
|
|
|
|
|
|
|
|
|
|
|
|
|
|
|
|
|
|
|
|
|
|
|
|
|
|
|
|
|
|
|
|
|
|
|
|
|
|
|
|
|
|
|
|
|
|
|
|
|
|
|
|
|
|
coagulant |
|
|
|
|
Particle |
|
|
|
|
|
|
|
|
|
|
|
|
|
|
|
|
|
|
|
|
|
|||
|
|
|
|
|
Particle |
|
Coagulant |
|
Particle |
|||||
Addition |
|
Particle |
|
|
|
|
|
Particle |
Particle |
|||||
of |
|
|
|
|
|
|
|
|
|
|
|
|
|
|
|
|
|
|
|
|
|
|
|
|
|
|
|
|
|
(A) Condensation
Addition of high polimer
Coagulant |
|
|
|
|
|
|
|
|
|
|
|
|||
|
|
|
|
|
|
|
|
|
|
|
|
|
|
|
|
|
|
|
|
|
|
|
Unstable particle |
|
|||||
|
|
High polimer |
|
|
Particle |
|
|
|
||||||
|
|
|
|
|
|
|
|
|
|
|
|
|
|
|
|
|
|
|
|
|
|
|
|
|
|
|
|
|
|
|
|
|
|
|
|
|
|
|
|
|
|
|
||
|
|
|
|
|
|
|
|
|
|
|
|
Flock |
|
|
|
|
|
|
|
|
|
|
|
|
|
|
|
||
|
|
|
|
|
|
|
|
|
|
|
|
|
|
|
|
|
|
|
|
|
|
|
|
|
|
|
|
||
|
|
Excess high polimer |
|
|
Particle |
|
|
Stable particle |
||||||
|
|
|
|
|
|
|
|
|
|
|
|
|
|
|
|
|
|
|
|
|
|
|
|
|
|
|
|
|
|
|
|
|
|
|
|
|
|
|
|
|
|
|
|
|
Fig17: Particle aggregation model
Reference: P-41 of Journal (No.609: Oct. /2007): TENPES
pH |
|
pH |
|
pH |
|
pH |
|
|
|
|
|
|
|
Fig18: Relationship between pH and hydroxide
Reference: P-42 of Journal (No.609: Oct. /2007): TENPES
23

(3)Filtration
Usually, filtration is performed in order to further removal of traces of SS which cannot be removed by flocculation. There is a form of pressure type, gravity type, upward flow type, downward flow type, single-layer type and dual-layer type as the filter for filtration, the pressure type, downward flow type and dual-layer type filter is often used for wastewater treatment facility in the power plant. Fig-20 and Photo-1 shows a construction example. Wastewater will be fed at the top and traces of the SS are removed during filtration through the layer. When the differential pressure rises to catch a SS, backwash water is put from the bottom, wash out filtration layer to remove the SS and it makes allow water passage again.
Fig19: Typical construction of thickener |
Fig20: Typical construction of filter |
Reference: P-42 of Journal (No.609: Oct. /2007): TENPES
24
|
|
|
|
|
|
Local |
|
|
|
|
|
|
|
|
|
|
|
|
|
|
|
|
|
|
|
control |
|
|
|
|
|
|
|
|
|
|
|
||
|
|
|
|
|
|
Planetary gear box |
|
|
|
|
|||||||||
|
|
|
|
|
|
panel |
|
|
|
|
|
||||||||
|
|
|
|
|
|
|
|
|
|
|
|
|
|
|
|
|
|
||
|
|
|
|
|
|
|
|
|
|
|
|
|
|
|
|
|
|
|
|
|
|
|
|
|
|
|
|
|
|
|
|
|
|
Hydraulic power unit |
|
||||
|
|
Velocity |
|
|
|
|
|
|
|
|
|
|
|
|
|||||
|
|
|
|
|
|
|
|
|
|
|
|
|
|
|
|||||
|
|
|
|
|
|
|
Feedwell |
|
|
||||||||||
|
|
break |
|
|
|
|
|
|
|
|
|
|
|
|
|
|
|||
|
|
|
|
|
|
|
|
|
|
|
|
|
|
|
|||||
|
|
box |
|
|
|
|
|
|
|
|
|
|
|
|
|
||||
|
|
|
|
|
|
|
|
|
|
|
|
|
|
|
|
|
|
|
|
|
Overflow |
|
|
|
|
|
|
|
|
|
|
|
|
|
|
||||
|
collection |
|
|
|
|
|
|
|
|
|
|
|
|
|
|
||||
|
|
launder |
|
|
|
|
|
|
|
|
|
|
|
|
|
|
|||
|
|
|
|
|
|
|
|
|
|
|
|
|
|
|
|
|
|
|
|
|
|
|
|
|
Rakes |
|
|
|
Underflow cone |
|
|
Underflow pipe |
|
|
|||||
|
|
|
|
Fig21: Thickener |
Photo- 1: Filter |
||||||||||||||
http://www.mclanahan.com/content/australasia/how-it-works-thicken |
http://www.eg.aktio.co.jp/product/kan/dojyou/dj |
||||||||||||||||||
|
|
|
|
|
|
|
|
er |
o08/index.html |
||||||||||
(4)Activated carbon absorption
Activated carbon has ability to absorb and remove organic, oil, coloring ingredient, odor components from wastewater and used for advanced treatment of higher wastewater treatment. This has been adopted in some cases of advanced wastewater treatment for COD and oil in thermal power plant wastewater. It is important to understand the absorption capacity of activated carbon when applying the activated carbon to wastewater treatment. This is the reason why the organic matter cannot be removed by activated carbon depending on the type of organic matter. Usually, absorption properties of activated carbon are presented in the form of absorption isotherm. When collecting wastewater in an Erlenmeyer flask, shaking for 24~72hours with changing the amount of addition of activated carbon, measuring the water side concentration after saturation, calculating the absorbed amount, plotting them as shown in Fig-22, usually it is obtained a linear relationship. This figure reveals the following. Measurement examples for wastewater are shown in Fig-22.
1)It is possible to estimate the necessary amount (kg/m3-wastewater) of activated carbon from the value of the equilibrium absorption concentration correspondents to the CO concentration of wastewater.
2)It indicates that easy to absorb if the slope of A-B is smaller and hard to absorb if A-B is greater.
3)The steep slope in the lower concentration side less than the equilibrium refraction point “B”indicates that the hard absorptive components exist.
General wastewater is a multi-component system, in which some components are easy to absorb and some are difficult to absorb. In extreme cases, sometimes it rises vertically like BD, “Crit” at the inflection point may be the limit of water quality, which is non-absorptive in case less than “Crit”.
25

Inflection point “B” may be moved due to type of activated carbon or pretreatment of wastewater as shown Fig-24. The breakthrough curve is obtained by flowing water through the column filled with activated carbon in order to find the amount of water and time to pass in the activated carbon equipment as shown in Fig-23. The construction of activated carbon tower is filled with granular activated carbon in stead of filter material similar to the filter.
Concussion (24~72h)
Wastewater |
L (ℓ) |
Wastewater |
L (ℓ) |
|
|
|
|
|
|
Initial |
Co (mg/ℓ) |
Equilibrium |
Co (mg/ℓ) |
|
concentration |
concentration |
|||
|
|
|||
|
|
|
|
|
Activated |
W1 (g) |
Activated |
C1 |
|
|
|
|||
W2 (g) |
C2 |
|||
carbon |
carbon |
|||
|
|
|||
W3(g) |
C3 |
|||
|
|
|||
|
|
|
|
Fig22: Measurement of equilibrium
Reference: P-43 of Journal (No.609: Oct. /2007): TENPES
Equilibrium absorption
q1 = L(C0 −C1)×10−3 w1
q2 = L(C0 −C2 )×10−3 w2
q3 = L(C0 −C3 )×10−3 w3
26
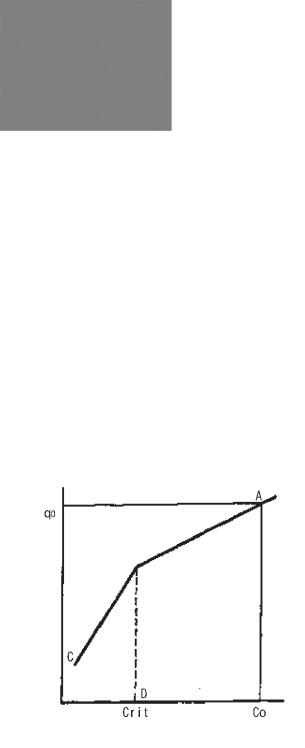
Equilibrium relation (absorption isotherm)
Fig23: Equilibrium relation q vs. c
Reference: P-43 of Journal (No.609: Oct. /2007): TENPES
Freund lich formula q − AC1/ n
(5)Synthetic absorbent treatment
It is known that COD in the desulfurization wastewater is the dithionite acid which is generated as byproduct when producing gypsum in the desulfurization facility and N-S compound which is generated in the reaction process of NOx and SOx, since there may be several 10mg/ℓ of matters which cannot be removed by coagulation and absorption. An absorption-regeneration system by a synthetic absorbent absorption may be adopted in order to process this COD which is hard to treat. The concentrated COD wastewater caused by regeneration is processed by thermal acid decomposition.
Amount of absorption (g/g)
B
Concentration (mg/l)
Fig24: Equilibrium for wastewater
Reference: P-43 of Journal (No.609: Oct. /2007): TENPES
(6)Gravity type separation and emerging
The gravity separation applying the buoyancy of the floating oil is used for the treatment, since the
27

effluent from power plant contains oil. Rate of rise of the oil droplets is expressed as following Stokes equation as in the case of sinking particles.
V = g(ρw − ρo )D2
18µ
Where |
|
|
V |
: emerging speed of particles |
(cm/sec) |
g |
: acceleration of gravity |
(cm/se2) |
ρw |
: density of drainage |
(g/cm3) |
ρo |
: density of emerged particles |
(g/cm3) |
D |
: diameter of particles |
(cm) |
μ |
: viscosity coefficient of therrainage |
(g/cm sec) |
Top View
Inlet
Inlet
Side View
1.Trash trap inclined rods)
2.Oil retention baffles
3.Flow distributors (vertical rods)
4.Oil layer
5.Slotted pipe skimmer
6.Adjustable overflow weir
7.Sludge sump
8.Chain and flight scraper
Skimmed Oil |
|
|
|
|
|
|
|
|
|
|
|
|
|
|
|
|
||
|
|
|
|
|
|
|
|
|
|
|
|
Adjustable |
|
|||||
|
|
|
|
|
|
|
|
|
|
|
|
|
||||||
to Sump |
|
|
Inlet |
|
|
Adjustable Weir |
|
|
|
|
|
|
|
Outlet |
||||
|
|
|
|
|
|
Oil |
|
|
|
|||||||||
|
|
|
|
|
|
|
|
Weir |
||||||||||
|
|
|
|
|
|
|
|
|
|
|
|
|
|
|
||||
|
|
|
|
|
|
|
|
|
|
|
|
|||||||
|
|
|
|
|
|
|
|
|
Oil Layer |
|
Skimmer |
|
|
|
|
|
|
|
|
|
|
|
|
|
|
|
|
|
|
|
|
||||||
|
Outlet |
|
|
|
|
|
|
|
|
|
|
|
|
|
||||
|
|
|
|
|
|
|
|
|
|
|
|
|
|
|||||
|
|
|
|
|
|
|
|
|
|
|
|
|
|
|
|
|||
|
|
|
|
|
|
|
|
|
|
|
|
|
|
|
|
|
|
|
|
|
|
|
|
|
|
|
|
|
|
|
Oil |
|
|
|
|
||
|
|
|
|
|
|
|
|
|
|
|
|
Globules |
|
|
|
|
||
|
|
|
|
|
|
|
Grid |
|
|
|
|
|
|
|||||
|
|
|
|
|
|
|
trap |
|
|
|
|
|
|
|
|
|
|
|
|
|
|
|
|
|
|
|
|
|
|
|
|
|
|
|
|
|
|
|
Outlet |
|
|
|
|
|
|
|
|
|
|
|
|
|
|
|
|
|
|
|
|
|
Parallel Plate |
Sludge |
|
|
|||||||||||
|
|
|
|
|
|
|
|
|
|
|||||||||
|
|
|
|
|
|
|
|
|
|
|||||||||
Assembly
Fig25: API type oil separator |
Fig26: CPI type oil separator |
http://en.wikipedia.org/wiki/File:API_Separator.png |
http://en.wikipedia.org/wiki/File:Parallel_Plate_Sep |
|
arator.png |
28
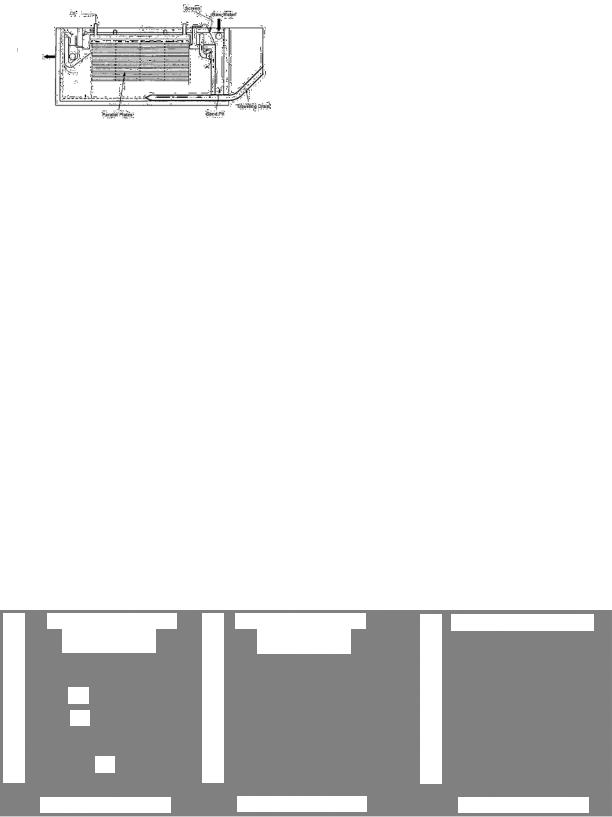
|
Screen |
|
Raw Water |
|
|
Oli |
|
|
|
||
|
|
|
|
|
|
Treated
Water
|
|
|
|
Travelling Drain |
|
Parallel Plates |
|
Sand Pit |
|
||
|
Fig27: PPI type oil separator
http://tegalrejo.indonetwork.co.id/1909715/oil-separa tor-crossflow-ppi.htm
There are API type (established by American Petroleum Institute), PPI type (established by Shell), CPI (improved machine of PPI) as the oil floating separation device and the typical construction is shown in Fig-25, 26 and 27. The limit of removable oil diameter is 150μ in API, 60μ in PPI and CPI as shown in Table-9. An example of particle size of oil droplets in the wastewater is shown in Fig -28.
Table- 9: List of gravity type floating separation operation
Operation |
|
|
Summery |
|
|
|
|
Footprint |
Limit removal |
Floating |
unit |
|
|
|
|
|
|
particle size |
rate |
||
|
|
|
|
|
|
|
|
|||
|
|
|
|
|
|
|
|
|
|
|
API Type |
Separation |
of liquid flowing |
in a |
laminar |
flow |
i |
1 |
150μ |
0.9mm/sec |
|
rectangular tank. |
|
|
|
|
||||||
|
|
|
|
|
|
|
|
|||
|
|
|
|
|
|
|
|
|
||
PPI Type |
Making |
it |
short distance by |
installing a |
number |
1/2 |
60~30μ |
0.2 mm/sec |
||
parallel plates into the tank. |
|
|
|
|
||||||
|
|
|
|
|
|
|
|
|||
|
|
|
|
|
|
|
|
|
||
CPI Type |
Placing |
Colgate parallel plates |
in |
45 degree to |
|
the |
60~30μ |
0.2 mm/sec |
||
direction of flow considering coursing. |
|
|
|
1/3 |
||||||
|
|
|
|
|
|
|
||||
|
|
|
|
|
|
|
|
|
|
|
Distribution of particle size (%)
(a) Thermal power plant
Oil content of wastewater: 210mg/l
Oil droplet diameter (μ)
Distribution of particle size (%)
(b) Thermal power plant
Oil content of wastewater: 210mg/l
Oil droplet diameter (μ)
Distribution of particle size (%)
(c) Petroleum refinery plant
Oil droplet diameter (μ)
Fig28: Example of particle size of oil droplets in the wastewater
Reference: P-44 of Journal (No.609: Oct. /2007): TENPES
29
(7)Activated sludge method
Organic matter in drainage is decomposited by the effect of aerobicgradation in activated sludge.
When continuing to blow air in the long-term into drainage, brown and hazy suspended solids is caused, it will be precipitated immediately after stopping of aeration and supernatant water is left. If removing precipitated sludge (activated sludge) and adding new wastewater and aerating, wastewater will be cleaned in the relatively short time. That allows the continuous purification is the activated sludge process. This process is caused by microorganisms, which are described as follows;
Chios + O2 → CO2 + H2O Q …………(1)
Chios + O2 → (cellular material) + CO2 + H2O Q …………(2)
(cellular material) + O2 → CO2 + H2O + NH3 Q ……………(3)
Here, CxHyOz shows the organic matter in wastewater. Equation (1) shows oxidation of organic matter, equation (2) shows synthesis of cellular material, equation (3) shows oxidation of cellular material. In other word, contaminant in wastewater will eventually become carbon dioxide gas, water and cellular body of aerobic organisms. Much type of organisms appears into activated sludge depending on the type of wastewater. Generally, the basic group of organisms of activated sludge is classified into the following four groups.
1)Bacteria
2)Fungi
3)Protozoa
4)Metazoan animal
The activated sludge is complicated matter which aerobic bacteria, organic or inorganic suspended solids and colloid are added, in addition, adhering to the surface of various protozoan, metazoan animals and algae, although the activated sludge is formed mainly by aerobic bacteria. Majority is the very small flock; it will become larger flock, is aggregated and precipitated immediately, if leaving quietly. Smells is almost odorless and slightly earthy smell. It must be conformed to the “construction standard for human septic waste tank” based on Building Standard Law, which details of processing method and structure are descried in that if processing wastewater by activated sludge method.
1.3 Basic drainage and wastewater treatment
1.3.1Types, quantity and quality of wastewater
There is the regular wastewater that discharges with the constant daily operation of the plant and the irregular discharge with periodic inspection and repair work in the power plant. Fig-29 shows the system of thermal power plant, source of wastewater and name of wastewater. If it can be understand
30

the water quality of each wastewater, it can be treated properly and manage proactively.
|
|
|
|
|
|
|
|
|
|
|
|
|
|
|
Stack |
|
|
|
|
|
|
|
|
|
|
|
|
|
De-SOx |
|
|
|
|
|
|
|
||
|
|
|
EP |
|
AH |
|
|
BLR |
|
|||
|
|
|
|
|
|
|
|
|
||||
|
|
|
|
Wet |
|
|
|
|
|
|
|
|
|
|
|
|
|
|
|
|
|
|
|
||
|
|
|
|
|
|
|
|
|
|
|
|
|
|
|
|
|
|
|
|
|
|
|
|
|
|
|
|
|
|
|
|
|
|
|
|
|
||
|
|
|
|
|
|
Ash treatnent |
|
|
|
Eco. |
||
|
|
|
|
|
|
|
|
|
|
|
|
|
|
|
|
|
|
|
|
|
|
|
|
||
|
|
|
|
|
|
|
|
|
|
|
|
|
|
|
|
|
|
|
|
|
|
|
|
|
|
Dea.
Storage TK
HP heater
|
|
|
|
|
|
|
|
Turbine |
|
|
|
|
|
|
|
|
|
|
|
|
|
|
|
|
|
|
|
|
|
|
|
|
|
|
|
|
|||
|
|
|
Cond. |
|
|
|
|
|
|
|
|
|
|
|
|
|
|
||
|
|
|
|
Deionizer |
|
|
Industrial water |
|
|
||||||||||
|
|
|
|
|
|
|
|
|
|
|
|
||||||||
|
|
hotwell |
|
|
|
|
|
|
|
|
|||||||||
|
|
|
|
|
|
|
|
|
|
|
|
|
|
|
|
||||
|
|
|
|
|
|
|
|
|
|
|
|
|
|||||||
|
|
|
|
|
|
|
|
|
|
|
|
|
|
|
|
|
|
|
|
|
|
|
|
|
|
|
|
|
|
|
|
|
|
|
|
|
|
|
|
|
|
|
|
|
|
|
|
|
|
|
|
Settlements |
|
|
Drinking water |
||||
|
|
|
|
Condemi. |
|
|
|
|
|
|
|
|
|
|
|
|
|
|
|
|
|
|
|
|
|
|
|
|
|
|
|
|
|
|
|
|
|
|
|
heater |
|
|
|
|
|
|
|
|
|
|
|
|
|
|
|
|
|
|
|
|
|
|
|
|
Coal yard or tank yard |
|
|||||||||||||
|
|
|
|
|
|
|
|
|
|
|
|
|
|
||||||
LP |
|
|
|
|
|
|
|
|
|
|
|
|
|
|
|
|
|
|
|
|
|
|
|
|
|
|
|
|
|
|
|
|
|
|
|
|
|
|
|
|
|
|
|
|
|
|
|
|
|
|
|
|
|
|
|
|
|
|
|
|
|
|
|
|
|
|
|
|
|
|
|
|
|
|
|
|
|
|
|
1. |
Desulfurization wastewater |
5. |
Chemical cleaning wastewater |
8. Condenser leak test |
|
(regular) |
|
(irregular) |
wastewater (irregular) |
|
|
|
|
|
2. |
EP washing wastewater |
5.Boiler blow water |
9. Water demineralizer |
|
|
(irregular) |
|
(irregular) |
regeneration wastewater |
|
|
|
|
(regular) |
|
|
|
|
|
3. |
Ash treatment wastewater |
6. |
Unit drain wastewater |
10. Drainage |
|
(regular) |
|
(regular) |
(regular) |
|
|
|
|
|
4. |
AH washing wastewater |
7. |
Condensate demineralizer |
11. Rainwater from coal yard |
|
(irregular) |
regeneration wastewater |
and tank yard |
|
|
|
|
(regular) |
|
|
|
|
|
|
Fig29: Types of wastewater in thermal power plant
Reference: P-45 of Journal (No.609: Oct. /2007): TENPES
(1)Regular drainage
1)Drainage
An amount of drainage is said 50ℓ/person-day for flush toilets, 10~15ℓ/serving-day for kitchen, and 15~190m3/day as the result of survey. Table-10 shows an example of water quality.
31

Table10: Example of kitchen drainage
|
|
A |
B |
C |
|
|
|
|
|
pH |
— |
4.5 |
7.2 |
7 |
|
|
|
|
|
SS |
ppm |
98 |
48 |
300 |
|
|
|
|
|
BOD |
ppm |
262 |
200 |
400 |
|
|
|
|
|
COD |
ppm |
60 |
200 |
— |
|
|
|
|
|
Oil |
ppm |
21 |
30 |
100 |
|
|
|
|
|
Reference: P-45 of Journal; (No.609: Oct. /2007): TENPES
2)Water demineralizer regeneration wastewater
An amount of wastewater is said 6~15% and 10~360m3/day as the result of survey. Table-11 shows an example of water quality.
Table11: Example of water demineralizer regeneration wastewater
pH |
10~12 |
|
|
SS |
800 ~ 1,000ppm |
|
|
COD |
20 ~ 40ppm |
|
|
Note: SS=about 100ppm at pH6
Reference: P-45 of Journal (No.609: Oct. /2007): TENPES
3)Condensate demineralizer regeneration wastewater
An amount of wastewater is said 100~250m3/ tower-time for a 350MW class, usually 3~4 towers are re-generated once every 4~5 days in H-OH type and once every 25~30 days in NH4-OH type. It was 15~570m3/day as the result of survey. Table-12 shows an example of water quality.
Table12: Example of condensate demineralizer regeneration wastewater
pH |
3~10 |
|
|
SS |
30 ~ 50ppm |
|
|
NH4 |
800 ~ 1,000ppm |
|
|
Reference: P-45 of Journal (No.609: Oct. /2007): TENPES
4)Desulfurization wastewater
An amount of wastewater is said 0.5~1.0m3/day-MW for oil-fired and 0.7~2.3m3/day-MW for coal-fired in thermal power plant. It was 50~960m3/day as the result of survey. Table-13 shows an example of water quality. A high T-N is characterized for heavy oil, Orimulsion, residual oil and high metal such as Mg, Hg, Aℓ ion for coal-fired, which is characterized by high F.
32

Table13: Water quality example of desulfurization wastewater
|
|
Oil Fired Thermal Power |
Coal Fired Thermal Power |
|
|
|
|
pH |
― |
2.6 |
1.6 |
|
|
|
|
SS |
ppm |
43 |
115 |
|
|
|
|
COD |
ppm |
32 |
18 |
|
|
|
|
Fe |
ppm |
8 |
38 |
|
|
|
|
Mn |
ppm |
0.8 |
5 |
|
|
|
|
Mg |
ppm |
― |
122 |
|
|
|
|
Ni |
ppm |
0.7 |
0.9 |
|
|
|
|
Al |
ppm |
― |
255 |
|
|
|
|
Zn |
ppm |
1.2 |
3 |
|
|
|
|
F |
ppm |
1.3 |
327 |
|
|
|
|
T-N |
ppm |
632 |
40 |
|
|
|
|
Reference: P-46 of Journal (No.609: Oct. /2007): TENPES
5)Ash treatment wastewater
Dry type ash treatment is being applied as water-free method in oil-fired plant. Water recirculation tends to applied in coal-fired plant. An amount of wastewater was 4~450m3/day for wastewater from EP, 50~8,000m3/day for wastewater from coal ash treatment as the result of survey.
6)Miscellaneous wastewater
It is impossible to grasp amount and quality of miscellaneous wastewater from turbine room floor, boiler room floor and cooling water system. It was 27~1,737m3/day as the result of survey.
(2)Irregular drainage
1)AH washing wastewater AH
An amount of wastewater is 1,000~2,000m3/time and 4,000m3/time at large, is said to be discharged in three to five hours. It was 200~4,000m3/time as the result of survey. Fig-30 shows the change in water quality in the time after the start of washing.
33

Concentration (ppm)
Washing time (min)
Fig30: Water quality example of AH washing
Reference: P-46 of Journal (No.609: Oct. /2007): TENPES
2)EP washing wastewater
An amount and quality of wastewater is similar to AH washing wastewater. An amount of wastewater was 400~3,000m3/time as the result of survey.
3)Wastewater after equipment standby and startup
An amount of wastewater in storing boiler and clean-up at the star-up is said 200~4,000m3/day. It was 190~1,600m3/time for wastewater from devices reservation and 350~10,000m3/time for wastewater from start-up as the result of survey. Water quality is about that containing several tens to several hundreds mg/ℓ hydrazine (N2H4) in the pure water, the COD will be approximately 1/2 concentration of N2H4.
4)Chemical cleaning wastewater
An amount of wastewater is generally complementary capacity to about 10 times the boiler, which is said to be discharged to several tens of hours. It was 300~2,700m3/time as the result of survey. Table-14 shows an example of wastewater due to hydrochloric acid and organic cleaning.
34
Table14: Water quality example of chemical cleaning drainage
|
|
Hydrochloric |
Organic |
|
|
acid drainage |
acid drainage |
|
|
|
|
pH |
― |
< 1 |
< 4 |
|
|
|
|
SS |
ppm |
< 100 |
< 100 |
|
|
|
|
COD |
ppm |
500 ~ 30,000 |
20,000 ~ 50,000 |
|
|
|
|
Fe |
ppm |
100 ~ 20,000 |
1,000 ~ 10,000 |
|
|
|
|
Cu |
ppm |
0 ~ 2,000 |
0 ~ 1,000 |
|
|
|
|
Color |
― |
Black-brown |
Black-yellow |
|
|
|
|
Odor |
― |
Pungent odor |
Specific odor |
|
|
|
|
Reference: P-46 of Journal (No.609: Oct. /2007): TENPES
(3)Rainwater
An amount of rainwater from tank yard or coal stock yard is determined by yard area and rainfall. In the tank yard, almost all rainwater will be discharged, since floor is usually made of concrete, however, in the cal stock yard, it is often used for sprinkle water within the system, since runoff coefficient is different due to ground, gravel and concrete floor.
1.3.2Wastewater treatment system and equipment management
Power plant has many types of wastewater, an amount and quality of wastewater is also uneven. Therefore, it is difficult for the wastewater treatment system to treat all in a single batch process and some equipment is often uniformed. However, there are some patterns, since wastewater treatment system is not uniformed unlike the feed-water system or boiler water system. The example to divide depending on the nature of wastewater is described in this section. It is important to manage to be able to demonstrate its ability always by understanding equipment in order to perform wastewater treatment properly.
(1)Common wastewater treatment system
Common wastewater treatment system is shown in Fig-31. All of variety of wastewater are led to effluent storage tank, amount and quality of water is equalized after storing primary. In the wastewater storage tank, the precipitation of SS is prevented along with iron and sulfur to oxidize and aeration. Then, the flock is formed in the flocculation tank and precipitated in the sedimentation tank while adjusting pH in the pH adjusting No.1 tank, adding coagulant and performing air oxidation. The treated water is discharged through a flow meter after neutralization, if necessary, conducting an activated carbon absorption filtration. In addition, wastewater is circulated back to the reservoir, if treated water quality is poor. Precipitated flock is dehydrated and removed as sludge cake after concentration in the thickener. Operation of processing device is carried out controlling the changes in wastewater capacity, the amount of chemicals for coagulation and sedimentation, pH
35

condition, state of the flock of flocculation tank and sludge in the sedimentation tank. Sludge is withdrawn intermittently from the sedimentation tank to the thickener and operation of dehydrator is carried out to measure the amount of sludge in the thickener. The operation conditions of dehydrator are set depending on the water content of sludge cake.
|
|
Filter |
Activated carbon |
|
NaOH |
Flocculant aid |
absorption tower |
NaOH |
|
|
|
|
|
|
|
|
Acid |
|
|
|
|
from oil contained |
|
|
|
|
|
|
|
Acid |
|
|
|
|
|
||||||
|
|
|
|
|
|
|
|
|
|
|
|
wastewater |
|
|
|
|
|
|
|
|
|
|
|
|
|
||||
|
|
|
|
Flocculant |
|
|
|
|
|
|
|
|
|
|
|
|
|
|
|
|
|||||||||
|
|
|
|
|
|
|
|
treatment system |
|
|
|
|
|
|
|
|
|
|
|
|
|
||||||||
|
|
|
|
|
|
|
|
|
|
|
|
|
|
|
|
|
|
|
|
|
|
|
|
|
|
|
|
|
|
|
|
|
|
|
|
|
|
|
|
|
|
|
|
|
|
|
|
|
|
|
|
|
|
|
|
|
|
|
|
|
|
|
|
|
|
|
|
|
|
|
|
|
Acid |
|
|
|
|
|
|
|
|
|
|
|
|
|
|
||
|
|
|
|
|
|
|
|
|
|
|
|
|
|
|
|
|
|
|
|
|
|
|
|
|
|
|
|
|
|
|
|
|
Wastewater tank |
|
|
|
|
Sedimentation |
|
|
|
|
|
|
|
|
|
|
|
|
|
|
|||||||
|
|
|
|
|
|
|
|
|
|
|
|
tank |
|
|
|
|
|
|
|
|
|
|
|
|
|
|
|||
|
|
|
|
|
|
|
|
|
|
|
|
|
|
|
|
|
|
|
|
|
|
|
|||||||
|
|
|
|
|
|
|
|
|
|
|
|
|
|
|
|
|
|
|
|
|
|
|
|
Flow measurement |
|
||||
|
|
|
|
|
|
|
|
|
|
|
|
|
|
|
|
|
|
|
|
|
|
|
|
|
|||||
|
|
|
|
|
|
|
|
|
|
|
|
|
|
|
|
|
|
|
|
|
|
|
|
|
|
|
|
|
|
|
|
|
|
|
|
|
|
|
|
|
|
|
|
|
|
|
|
|
|
|
|
|
|
|
|
|
|
|
|
|
|
|
|
|
|
|
|
|
|
|
|
|
|
|
|
|
|
|
|
|
|
|
|
|
|
|
|
||
|
General |
|
|
|
|
|
|
|
|
|
|
|
|
|
|
|
|
|
|
|
|
|
|
|
|
|
|
||
|
|
|
|
|
|
|
|
|
|
|
|
|
|
|
|
|
|
|
|
||||||||||
wastewater |
|
|
|
|
|
|
|
|
|
|
|
|
|
|
|
|
|
|
|
|
|
|
|
|
|
|
|||
|
|
|
|
|
|
|
|
|
|
|
|
|
|
|
|
|
|
Discharge |
|||||||||||
|
|
|
|
|
|
|
|
|
|
|
|
|
|
|
|
|
|
|
Backwash |
|
|
|
|
|
|
|
|||
|
|
|
|
|
|
|
|
|
pH adjustment tank-1 |
|
|
pH adjustment tank-2 |
|
|
Discharge tank |
|
|
|
|
||||||||||
|
|
|
|
|
|
|
|
|
|
|
|
water tank |
|
|
|
|
|
||||||||||||
|
|
|
|
|
|
|
|
|
collection tank |
|
|
|
|
|
|
collection tank |
|
|
|
|
|
|
|
|
|
|
|||
|
|
|
|
|
|
|
|
|
|
|
|
|
|
|
|
|
|
|
|
|
|
|
|
||||||
|
|
|
|
|
|
|
|
|
|
|
|
|
|
|
|
|
Final pH adjustment tank |
|
|
|
|
|
|||||||
|
|
|
|
|
|
|
|
|
|
|
|
|
|
|
|
|
|
||||||||||||
|
|
|
|
|
|
|
|
|
|
|
|
|
|
|
|
|
|
|
|
|
|
|
|
|
|||||
|
|
|
|
|
|
|
|
|
|
|
|
|
|
|
|
|
|
|
|
|
|
|
|
|
|||||
|
|
|
|
|
|
|
|
|
|
|
|
|
|
|
|
|
|
|
|
|
|
|
|
|
|
|
|
|
|
|
|
Sludge |
|
|
|
|
|
|
|
|
|
|
|
|
|
|
|
Extractor |
|
|
|
|
|
|
|
|
|
|
|
|
|
|
|
|
|
|
|
|
|
|
|
|
Sludge |
|
|
|
|
|
|
|
|
|
|
|
|
|
|
|
|
|
|
|
|
|
Wastewater tank |
|
|
||||||||||
|
|
|
|
|
|
Conveyor |
|
|
|
|||
|
|
|
|
|
|
|
|
|
|
|||
|
|
|
|
|
|
|
|
|
|
|||
|
|
|
|
|
|
|
|
|
|
|
||
|
|
|
|
|
|
|
|
|
|
|
|
|
|
|
|
|
|
|
|
|
|
|
|
|
|
|
|
|
|
|
|
|
|
|
|
Cake Tank |
|
|
|
|
|
|
|
|
|
|
|
|
|
|
|
|
|
|
|
|
|
|
|
|
|
|
|
|
|
|
|
|
|
|
|
|
|
|
|
Carrying-out of cake |
|
|
|
|
|
|
|
|
|
|
|
|
|
|
Thickener
Fig31: Example of general wastewater treatment system
Reference: P-47 of Journal (No.609: Oct. /2007): TENPES
(2)Oil-containing wastewater treatment system
Example of oilcontaining wastewater treatment system is shown in Fig-32. Wastewater is separated by API gravity separation method at first, in addition is separated by PPI or CPI method. The treated water is discharged through a flow meter after making activated carbon absorption filtration, if necessary. In addition, wastewater is circulated back to the reservoir, if treated water quality is poor. The oil separated by the gravity separation device is recovered. The operation of processing device is usually carried out to be capable to accept continuously and the separated oil on the water surface is extracted by API or CPI intermittently. It is possible to remove oil droplet sufficiently by the gravity separation, since oil droplet diameter of actual wastewater in the power plants has at least 60~120μ as shown in Table-9. Therefore, it is important to grasp the changing state of the oil flowing when the oil removal performance is deteriorated.
36

|
|
|
|
Activated carbon |
|
|
Filter |
||
|
|
|
absorption tower |
|
|
|
|
|
|
|
|
|
|
|
Oil recovery
|
|
|
|
Skimmer |
|
|
|
||
|
|
Skimmer |
|
|
|
||||
Flow |
|||||||||
|
|
|
|
|
|
|
|||
|
|
|
|
|
|
|
|||
|
|
|
|
|
|
measurement |
|
||
|
|
|
|
|
|
|
|||
|
|
|
|
|
|
|
|
|
|
|
|
|
|
|
|
|
|
|
|
|
|
|
|
|
|
|
|
|
|
Oil containing
wastewater Oil separator equivalent to simple API
High performance oil seperator |
|
Discharge |
|
Discharge |
equivalent to API, CPI |
|
tank |
|
|
|
||||
|
|
|
||
|
|
|
|
|
Filter and activated carbonabsorption tower may be shared with general wastewater treatment facility in alump.
Fig32: Example of oil-containing wastewater treatment system
Reference: P-47 of Journal (No.609: Oct. /2007): TENPES
(3)Drainage treatment system
Drainage treatment system is shown in Fig-33. Wastewater from various places is led to the aeration tank after removing large suspended solids in the wastewater or floating material on the surface by screen first, storing temporary in the adjusting tank and adjusting amount and quality of water. It is well processed by activated sludge processing by feeding air to the aeration tank and returning sludge from the sedimentation tank. Then, activated sludge is sent to precipitation tank and precipitated. The top clear water is discharged after filtration, activated carbon absorption and final chlorine disinfection as the tertiary treatment through a flow meter. The sediment in the precipitation tank will be led to sludge storage tank and concentrated, and then it will be transported and disposed by the vacuum transporter. Operation of processing equipment is usually able to keep it always accept drainage and increase the amount of work to do if water level rises adjustment tank. The screen is always inspected in order to ensure the state of scraping of sediments. The aeration state is monitored in order to supply sufficient air for activated sludge and keep uniform aeration by inspecting the clogging of aeration tube, etc. in the aeration tank. The sedimentation is monitored and the amount of sludge is controlled in the sedimentation tank. In addition, MLSS (SS in the aeration tank), SV (sludge volume), SVI (sludge volume index) are calculated to determine the quality of activated sludge. These studies are performed according to the test method of sewer.
37

|
|
|
|
|
|
|
|
|
|
|
|
|
|
|
|
|
|
|
|
|
Activated carbon |
|
|
|
|
|
|
||||
|
|
|
|
|
|
|
|
|
|
|
|
|
|
|
|
|
Filter |
|
|
absorption tower |
|
|
|
|
|
|
|
|
|||
|
|
|
|
|
|
|
|
|
|
|
|
|
|
|
|
|
|
|
|
|
|
|
|
|
|
|
|
||||
|
|
|
|
|
|
Sewage |
|
|
Return sludge |
|
|
|
|
|
|
|
|
|
|
|
|
|
|
|
|
||||||
|
|
|
|
|
|
weighing tank |
|
weighing tank |
|
|
|
|
|
|
|
|
|
|
|
|
|
|
|
|
|||||||
|
|
|
|
|
|
|
Flow |
|
|
|
|
||||||||||||||||||||
|
|
|
|
|
|
|
|
|
|
|
|
|
|
|
|
|
|
|
|
|
|
|
|
|
|
|
|
|
|
||
|
|
|
|
|
|
|
|
|
|
|
|
|
|
|
|
|
|
|
|
|
|
|
|
|
|
|
|
|
|
||
|
|
|
|
|
|
|
|
|
|
|
|
|
|
|
|
|
|
|
|
|
|
|
|
|
|
measurement |
|
|
|
|
|
|
|
|
|
Screen |
|
|
|
|
|
|
|
|
|
|
|
|
|
|
|
|
|
|
|
|
|
|
|
||||
|
|
|
|
|
|
|
|
|
|
|
|
|
|
|
|
|
|
|
|
|
|
|
|
|
|
|
|
|
|||
|
|
|
|
|
|
|
|
|
|
|
|
Precipitation tank |
|
|
|
|
|
|
|
|
|
|
|
|
|
||||||
|
|
|
|
|
|
|
|
|
|
|
|
|
|
|
|
|
|
Sterili- |
|
|
|
|
|
|
|||||||
|
|
|
|
|
|
|
|
|
|
|
|
|
|||||||||||||||||||
|
|
|
|
|
|
|
|
|
|
|
|
|
|
|
|
|
|
|
|
|
|
zation |
|
|
|
|
|
|
|||
|
|
|
|
|
|
|
|
|
|
|
|
|
|
|
|
|
|
|
|
|
|
Discharge |
|||||||||
|
|
|
|
|
|
|
|
|
|
|
|
|
|
|
|
|
|
|
|
|
|
|
|
|
|
|
|
|
|
||
|
|
|
|
|
|
|
|
|
|
|
|
|
|
|
|
|
|
|
|
|
|
|
|
|
|
|
|
|
|
||
|
Human |
|
|
|
|
|
|
|
|
|
|
|
|
|
|
|
|
|
|
|
|
|
|
|
|
|
|
|
|||
|
|
|
|
|
|
|
|
|
|
|
|
|
|
|
|
|
|
|
|
|
|
|
|||||||||
|
seawage |
|
|
|
|
|
|
|
|
|
|
|
|
|
|
|
|
|
|
|
|
|
|
|
|
|
|
|
|||
|
|
|
|
|
|
|
|
|
|
|
|
|
|
|
|
|
|
|
|
|
|
|
|
|
|||||||
|
|
|
|
|
|
|
|
|
|
|
|
|
|
|
|
Collection |
|
Backwash water tank |
|
|
|
|
|
||||||||
|
|
|
|
|
|
|
|
|
|
|
|
|
|
|
|
tank |
|
|
|
|
|
|
|
|
|
|
|
|
|
|
|
|
|
|
|
|
|
|
|
|
|
|
|
|
|
|
|
|
|
|
|
|
|
|
|
|
|
|
|
|
|
||
|
|
|
|
|
|
|
|
|
|
|
|
|
|
|
|
|
|
|
|
Discharge tank |
|
|
|
|
|
||||||
|
|
|
|
|
|
|
|
|
|
|
|
|
|
|
|
|
|
|
|
|
|
|
|
|
|
||||||
|
|
|
|
|
|
Adjustment |
|
|
|
|
|
|
|
|
|
|
|
|
|
|
|
|
|
|
|
|
|
|
|
|
|
|
|
|
|
|
|
|
|
|
|
|
|
|
|
|
|
|
|
|
|
|
|
|
|
|
|
|
|
|
|||
|
|
|
|
|
|
tank |
|
Aeration tank |
|
|
|
|
|
|
|
|
|
|
|
|
|
|
|||||||||
|
|
|
|
|
|
|
|
|
|
(2series) |
|
|
|
|
|
|
|
|
|
|
|
|
|
|
|
|
|
|
|
||
|
|
Activated carbonabsorption tower may be shared |
|
|
with general wastewater treatment facility in alump. |
Sludge tank |
|
|
|
|
|
|
||
|
|
|
Fig33: Example of drainage treatment system
Reference: P-48 of Journal (No.609: Oct. /2007): TENPES
(4)Desulfurization wastewater treatment system
Desulfurization wastewater treatment system for coal-fired power plant is shown in Fig-34. The coagulation and sedimentation or membrane process is usually performed for fluoride removal prior to the coagulation system in coal-fired plant. The desulfurization wastewater is reserved temporary, uniformed water amount and quality aims to prevent the precipitation of SS such as gypsum by aeration. The process is performed by removal of COD components by absorption such as Jiochin acid or N-S compounds in the absorption tower after removal of fluorine, iron, calcium by coagulation and sedimentation and filtration. Recently, Selen treatment, nitrogen treatment fluorine absorption treatment will be established in that process. The treated water is finally discharged through a flow meter by neutralizing and adjusting pH. In addition, wastewater is circulated back to the reservoir, if quality of treated water is poor. The precipitated sludge in the sedimentation tank is led to thickener and concentrated, dehydrated in dehydrator to sludge cake, and then it is taken out. Operation of processing device is performed continuously and the management of amount of chemical injection, processing pH, state of the flock of flocculation tank, amount of sludge in the sedimentation tank is performed similar to common wastewater treatment facility. Apart from this, backwash and regeneration of filter and COD absorption tower, management of decomposition conditions for regeneration wastewater is performed. It is important to perform daily operation with a good understanding of desulfurization method in order to carry out fluoride treatment, COD treatment, nitrogen treatment, selenium treatment, etc. which is not included in conventional wastewater treatment.
38

Selenium reducing tower
|
|
|
|
|
|
|
|
|
|
|
|
|
|
|
|
|
|
|
|
|
|
|
|
|
|
|
|
|
|
|
|
|
|
|
|
|
|
|
|
|
|
Desulfulization |
|
|
|
|
|
|
|
|
|
|
|
|
|
|
|
|
|
|
||
|
|
|
|
|
|
|
|
|
Reaction |
|
|
|
|
|
|
|
pH adjustment |
|||
wastewater |
|
Reaction |
|
Flocculation |
|
|
|
|
|
Flocculation |
|
|
|
|
||||||
|
|
|
|
tank |
|
tank |
|
|
|
|
tank |
|
tank |
|
|
|
|
tank |
||
|
|
|
|
|
|
|
Sludge |
|
|
|
Sludge |
|||||||||
|
|
|
|
|
|
|
|
|
|
|||||||||||
|
|
|
|
|
|
|
|
|
|
|
|
|||||||||
|
|
|
|
|
|
|
|
|
|
|||||||||||
|
|
|
|
|
|
|
||||||||||||||
|
|
|
|
|
|
|
|
|
|
|
|
|
|
|
|
|
|
|
||
|
|
|
|
|
|
|
|
|
|
|
|
|
|
|
|
|
|
|
||
|
|
|
|
|
|
|
Precipitation |
|
|
|
|
|
Precipitation |
|
|
|
||||
|
|
|
|
|
|
|
|
|
|
|
|
|
|
|
|
|
||||
|
|
|
|
|
|
|
|
|
|
|
|
|||||||||
|
|
|
|
|
|
|
tank |
|
|
|
|
|
|
tank |
|
|
|
|
||
|
|
|
|
|
|
|
|
|
|
Filter |
|
|
|
|
|
|
|
|
|
|
|
|
|
|
|
|
|
|
|
|
|
|
|
|
|
|
|
|
|
|
|
|
|
|
|
|
|
|
|
|
|
|
|
|
|
|
|
|
|
|
|
|
|
|
|
|
|
|
|
|
|
|
|
|
|
|
|
|
|
|
|
|
|
|
|
|
Treated |
||
|
|
|
|
|
|
|
|
|
|
|
|
|
|
|
water |
||
|
|
|
|
|
|
Denitrifi- |
|
|
|
|
|
|
|
||||
|
Activate |
|
|
Fluorine |
|
|
|
|
|
|
|
|
|||||
|
COD |
|
|
|
|
|
|
|
|
|
|||||||
|
|
|
|
|
|
|
|
|
pH adjustment |
|
|
||||||
|
|
|
cation |
Re- |
|
|
|
|
|
|
|
||||||
Filter |
|
|
|
|
|
||||||||||||
carbon |
absorption |
|
absorption |
|
|
|
|
|
|
tank |
|
|
|||||
|
Sludge |
|
|
|
|
||||||||||||
|
absorption |
tank |
|
tank |
Nitrification |
tank |
aeration |
Denitrification |
|
|
|
|
|||||
|
|
||||||||||||||||
|
tank |
|
|
|
tank |
tank |
precipitation |
|
|
|
|
|
|
|
|
|
|
|
|
|
|
|
|
|
|
|
|
|
|
|
|||||
|
|
|
|
|
|
|
|
|
|
|
|
|
|||||
|
|
|
|
|
|
|
|
|
|
|
|
|
|||||
tank
Fig34: Example of desulfurization wastewater treatment system
Reference: P-48 of Journal (No.609: Oct. /2007): TENPES
Article 222. Discharge standard of effluent
Article 222-1. Value of the Parameters of Pollution in Industrial Wastewater
4.1.2.2. Environmental regulations to be applied to thermal power project
(1)National technical regulation on industrial wastewater QCVN 24/2009/BTNMT
There is no dedicated wastewater regulation for the thermal power plant in Vietnam; it is regulated by common national technical regulation for a common industrial effluent limit. This regulation is also applied for the effluent from coal yard, ash pond effluent other than thermal effluent. The maximum allowable contaminants in the industrial wastewater (Cmax) is calculated as follows (however, Cmax=C is applied for the temperature, pH, odor, color, coliform count, total α radioactivity, total β radioactivity).
Cmax = C × Kq × Kf
“C” is the emission level of pollutants in the industrial wastewater as shown in Table-15.
39
Table15: National technical regulation on industrial wastewater (QCVN 24/2009/BTNMT)
Parameter |
Unit |
C values |
||
|
|
|||
A |
B |
|||
|
|
|||
|
|
|
|
|
Temperature |
0C |
40 |
40 |
|
pH |
|
6.0-9.0 |
5.5-9.0 |
|
|
|
|
|
|
Odor |
|
Not unendurable |
Not unendurable |
|
|
|
|
|
|
Color (Co-Pt in pH=7) |
|
20 |
70 |
|
|
|
|
|
|
BOD5 (at 200C) |
mg/l |
30 |
50 |
|
COD |
mg/l |
50 |
100 |
|
|
|
|
|
|
Suspended Solids |
mg/l |
50 |
100 |
|
|
|
|
|
|
Arsenic |
mg/l |
0.05 |
0.1 |
|
|
|
|
|
|
Hydragyrum |
mg/l |
0.005 |
0.01 |
|
|
|
|
|
|
Lead |
mg/l |
0.1 |
0.5 |
|
|
|
|
|
|
Cadmium |
mg/l |
0.005 |
0.01 |
|
|
|
|
|
|
Chromium(VI) |
mg/l |
0.05 |
0.1 |
|
|
|
|
|
|
Chromium(III) |
mg/l |
0.2 |
1 |
|
|
|
|
|
|
Copper |
mg/l |
2 |
2 |
|
|
|
|
|
|
Zinc |
mg/l |
3 |
3 |
|
|
|
|
|
|
Nickel |
mg/l |
0.2 |
0.5 |
|
|
|
|
|
|
Manganese |
mg/l |
0.5 |
1 |
|
|
|
|
|
|
Forrum |
mg/l |
1 |
5 |
|
|
|
|
|
|
Stannum |
mg/l |
0.2 |
1 |
|
|
|
|
|
|
Cyanide |
mg/l |
0.07 |
0.1 |
|
|
|
|
|
|
Phenol |
mg/l |
0.1 |
0.5 |
|
|
|
|
|
|
Mineral oil |
mg/l |
5 |
5 |
|
|
|
|
|
|
Vegetable animal oil |
mg/l |
10 |
20 |
|
|
|
|
|
|
Excess chloride |
mg/l |
1 |
2 |
|
|
|
|
|
|
PCB |
mg/l |
0.003 |
0.01 |
|
|
|
|
|
|
Chemical plant protection |
mg/l |
0.3 |
1 |
|
organic phosphorus |
|
|
|
|
|
|
|
|
|
Chemical plant protection organic chloride |
mg/l |
0.1 |
0.1 |
|
|
|
|
|
|
Sulfur |
mg/l |
0.2 |
0.5 |
|
|
|
|
|
|
Fluoride |
mg/l |
5 |
10 |
|
|
|
|
|
|
Chloride |
mg/l |
500 |
600 |
|
|
|
|
|
|
Ammonium (calculated by Nitrogen) |
mg/l |
5 |
10 |
|
|
|
|
|
|
T-N |
mg/l |
15 |
30 |
|
|
|
|
|
|
T-P |
mg/l |
4 |
6 |
|
|
|
|
|
|
Coliform |
MPN/100ml |
3,000 |
5,000 |
|
|
|
|
|
|
Total of radioactivity α |
Bq/l |
0.1 |
0.1 |
|
|
|
|
|
|
40

Parameter |
Unit |
|
C values |
|
|
|
|
||
A |
|
B |
||
|
|
|
||
|
|
|
|
|
Total of radioactivity β |
Bq/l |
1.0 |
|
1.0 |
|
|
|
|
|
- Column A is the regulated “C” value parameters of pollution in industrial wastewater when discharged into a receiving source which is a water source for used by people;
- Column B is the regulated C value parameters of pollution in industrial wastewater when discharged int receiving source which is not a water source for used by people ;
- Chloride parameters do not apply to any receiving source which is salt water and or brackish water.
Where, column A is applied, if the industrial wastewater is discharged to the area of the water source for domestic water. In addition, column B is applied, if the industrial wastewater is not discharged to the area of the water source for domestic water. In case the discharge of industrial wastewaterto saline or brackish water area, the chloride level is not applied. Kq is defined as follows according to the destination of discharge of industrial wastewater.
Table16: Kq in case releasing industrial wastewater to river, spring canal, channel, stream and trench (QCVN 24/2009/BTNMT)
Flow rate in the place where |
|
industrial wastewater is discharge to |
Kq |
Q (m3/s) |
|
Q ≤ 50 |
0.9 |
|
|
50 < Q ≤ 200 |
1.0 |
|
|
200 < Q ≤ 1,000 |
1.1 |
|
|
1,000 < Q |
1.2 |
|
|
“Q” as shown in Table-16 is the average flow rate of 3 months of most dry season in the river, spring, canal, stream and trench where industrial wastewater is discharge to(base on the data of weather stations). “Kq=0.9” is applied if there is no data about flow rate of such river, spring, canal, stream and trench, or Kp is decided by means of determination the flow rate of the 3 monthin most dry season by the agency specified by the epartmentD of Natural Resources and Environment in such region.
Table17: Kp in case releasing industrial wastewater to pond or lake (QCVN 24/2009/BTNMT)
Capacity in the place where |
|
industrial wastewater is discharge to |
Kq |
V (m3) |
|
V ≤ 10x106 |
0.6 |
10x106 < V ≤ 100x106 |
0.8 |
100x106 < V |
1.0 |
41
“V” as shown in Table-17 is the average flow rate of 3 months of most dry season in the pond or lake where industrial wastewater is discharge tobase( on the data of weather stations)“.Kq=0.6” is applied if there is no data about flow rate suchof pond or lake, or Kq is decided by means of
determination the flow rate of the 3 month in most dry season by the agency specified by the Department of Natural Resources and Environment in such region. In case of coastal area in the place
where industrial wastewater is discharged to, Kq=1.3 is applied to the coastal area where are not available for the protection of marine life, water sport and activity, Kq=1.0is applied to the coastal area where are available for the protection of marine life, water sport.
(2)National Technical Regulation on Domestic Waste Water QCVN 14/2008/BTNMT
National technical regulation on domestic wastewater QCVN14/2008/BTNMT is applied to the drainage from power plantThe. maximum allowable contaminants in thedrainage (Cmax) is calculated as follows (however, Cmax=C is applied for the temperature, pH, coliform count).
Cmax = C × K
“C” is the emission levels of pollutants in the drainage as set out in Table-18.
Table18: Emission regulation for pollutants in wastewater C (QCVN 14/2008/BTNMT)
No. |
Parameter |
Unit |
|
C values |
|
|
|
|
|||
A |
|
B |
|||
|
|
|
|
||
|
|
|
|
|
|
1 |
pH |
― |
5-9 |
|
5-9 |
|
|
|
|
|
|
2 |
BOD5 (20oC) |
mg/l |
30 |
|
50 |
3 |
Total suspended solid (TSS) |
mg/l |
50 |
|
100 |
|
|
|
|
|
|
4 |
Dissolved solid |
mg/l |
500 |
|
1,000 |
|
|
|
|
|
|
5 |
Sulfur (H2S conversion) |
mg/l |
1.0 |
|
4.0 |
6 |
Ammonia (Nitrogen conversion) |
mg/l |
5 |
|
10 |
|
|
|
|
|
|
7 |
Nitrate (NO3- : Nitrogen conversion) |
mg/l |
30 |
|
50 |
8 |
Animal and plant fat |
mg/l |
10 |
|
20 |
|
|
|
|
|
|
9 |
Surface active agent |
mg/l |
5 |
|
10 |
|
|
|
|
|
|
10 |
Phosphate(PO43-:Phosphate conversion) |
mg/l |
6 |
|
10 |
11 |
Coliform count |
MPN/100ml |
3,000 |
|
5,000 |
|
|
|
|
|
|
“K” is stipulated depending on the type of facility such as service facilities, public facilities, housing, business type, size and required area as shown in Table-19.
42
Table19: Coefficient K corresponding to the type of service facility, public facility and complex housing (QCVN 14/2008/BTNMT)
|
Type of facility |
Size and required area of facility |
K |
|
|
|
|
|
|
1. |
Hotels and restaurants |
hotel in 50 rooms, 3 stars and more |
1.0 |
|
|
|
|||
Less than 50 rooms |
1.2 |
|||
|
|
|||
|
|
|
|
|
2. |
Representative institutions, office, school |
10,000m2 and more |
1.0 |
|
and research facility |
Less than 10,000m2 |
1.2 |
||
3. |
Department stores and supermarket |
5,000m2 and more |
1.0 |
|
Less than 5,000m2 |
1.2 |
|||
|
|
|||
4. |
Market |
1,500m2 and more |
1.0 |
|
Less than 1,500m2 |
1.2 |
|||
|
|
|||
5. |
Restaurants and food shops |
500m2and more |
1.0 |
|
Less than 500m2 |
1.2 |
|||
|
|
|||
6. |
Production facilities and military camps, |
500 peoples and more |
1.0 |
|
etc. |
|
|
||
Less than 500 peoples |
1.2 |
|||
|
|
|
|
|
7. |
Multifamily residential |
50 units and more |
1.0 |
|
|
|
|||
Less than 50 units |
1.2 |
|||
|
|
|||
|
|
|
|
|
(3)National Technical Regulation on Surface Water Quality QCVN 08/2008/BTNMT Table-20 shows water quality regulation for surface water quality.
Table20: Water quality regulation for surface water (QCVN 08/2008/BTNMT)
|
|
|
|
|
Allowable Value |
|
|
|
|
|
|
|
|
|
|
|
|
No. |
Parameter |
Unit |
A |
|
|
B |
||
|
|
|
|
|
|
|
|
|
|
|
|
A1 |
|
A2 |
B1 |
|
B2 |
|
|
|
|
|
|
|
|
|
1 |
pH |
― |
6-8.5 |
|
6-8.5 |
5.5-9 |
|
5.5-9 |
|
|
|
|
|
|
|
|
|
2 |
Dissolved oxygen (DO) |
mg/ℓ |
≥ 6 |
|
≥ 5 |
≥ 4 |
|
≥ 2 |
|
|
|
|
|
|
|
|
|
3 |
Total suspended solid (TSS) |
mg/l |
20 |
|
30 |
50 |
|
100 |
|
|
|
|
|
|
|
|
|
4 |
COD |
mg/l |
10 |
|
15 |
30 |
|
50 |
|
|
|
|
|
|
|
|
|
5 |
BOD5 (20oC) |
mg/l |
4 |
|
6 |
15 |
|
25 |
6 |
Ammonia (NH+4 : calculated |
mg/ℓ |
0.1 |
|
0.2 |
0.5 |
|
1 |
by Nitrogen) |
|
|
|
|
|
|
||
|
|
|
|
|
|
|
|
|
|
|
|
|
|
|
|
|
|
7 |
Chloride (Cl-) |
mg/ℓ |
250 |
|
400 |
600 |
|
― |
|
|
|
|
|
|
|
|
|
8 |
Fluorine (F-) |
mg/ℓ |
1 |
|
1.5 |
1.5 |
|
2 |
|
|
|
|
|
|
|
|
|
9 |
Nitrite (NO--2: calculated by |
mg/ℓ |
0.01 |
|
0.02 |
0.04 |
|
0.05 |
Nitrogen) |
|
|
|
|
|
|
||
|
|
|
|
|
|
|
|
|
|
|
|
|
|
|
|
|
|
10 |
Nitrate (NO3-) |
mg/ℓ |
2 |
|
5 |
10 |
|
15 |
43
|
|
|
|
|
Allowable Value |
|
|
|
|
|
|
|
|
|
|
|
|
No. |
Parameter |
Unit |
|
A |
|
B |
||
|
|
|
|
|
|
|
|
|
|
|
|
A1 |
|
A2 |
B1 |
|
B2 |
|
|
|
|
|
|
|
|
|
11 |
Phosphate (PO43-) |
mg/l |
0.1 |
|
0.2 |
0.3 |
|
0.5 |
12 |
Cyanide (CN-) |
mg/l |
0.005 |
|
0.01 |
0.02 |
|
0.02 |
13 |
Arsenic (As) |
mg/l |
0.01 |
|
0.02 |
0.05 |
|
0.1 |
|
|
|
|
|
|
|
|
|
14 |
Cadmium (Cd) |
mg/l |
0.005 |
|
0.005 |
0.01 |
|
0.01 |
|
|
|
|
|
|
|
|
|
15 |
Lead (Pb) |
mg/l |
0.02 |
|
0.02 |
0.05 |
|
0.05 |
|
|
|
|
|
|
|
|
|
16 |
Chrome (Cr3+) |
mg/l |
0.05 |
|
0.1 |
0.5 |
|
1 |
17 |
Chrome (Cr6+-) |
mg/l |
0.01 |
|
0.02 |
0.04 |
|
0.05 |
18 |
Copper (Cu) |
mg/l |
0.1 |
|
0.2 |
0.5 |
|
1 |
|
|
|
|
|
|
|
|
|
19 |
Zinc (Zn) |
mg/l |
0.5 |
|
1.0 |
1.5 |
|
2 |
|
|
|
|
|
|
|
|
|
20 |
Nickel (Ni) |
mg/l |
0.1 |
|
0.1 |
0.1 |
|
0.1 |
|
|
|
|
|
|
|
|
|
21 |
Iron (Fe) |
mg/l |
0.5 |
|
1 |
1.5 |
|
2 |
|
|
|
|
|
|
|
|
|
22 |
Mercury (Hg) |
mg/l |
0.001 |
|
0.001 |
0.001 |
|
0.002 |
|
|
|
|
|
|
|
|
|
23 |
Surface active agent |
mg/l |
0.1 |
|
0.2 |
0.4 |
|
0.5 |
|
|
|
|
|
|
|
|
|
24 |
Oils and grease |
mg/l |
0.01 |
|
0.02 |
0.1 |
|
0.3 |
|
|
|
|
|
|
|
|
|
25 |
Phenol |
mg/l |
0.005 |
|
0.005 |
0.01 |
|
0.02 |
|
|
|
|
|
|
|
|
|
|
Organochlorine insecticide |
|
|
|
|
|
|
|
|
Aldrin+Dieldrin |
μg/ l |
0.002 |
|
0.004 |
0.008 |
|
0.01 |
|
Endrin |
μg/ l |
0.01 |
|
0.012 |
0.014 |
|
0.02 |
|
BHC |
μg/ l |
0.05 |
|
0.1 |
0.13 |
|
0.015 |
26 |
DDT |
μg/ l |
0.001 |
|
0.002 |
0.004 |
|
0.005 |
Endosulfan |
μg/ l |
0.005 |
|
0.01 |
0.01 |
|
0.02 |
|
|
|
|
||||||
|
(Thiodan) |
|
|
|
|
|
|
|
|
Lindan |
μg/ l |
0.3 |
|
0.35 |
0.38 |
|
0.4 |
|
Chlordane |
μg/ l |
0.01 |
|
0.02 |
0.02 |
|
0.03 |
|
Heptachlor |
μg/ l |
0.01 |
|
0.02 |
0.02 |
|
0.05 |
|
|
|
|
|
|
|
|
|
|
Organophosphate insecticide |
|
|
|
|
|
|
|
27 |
Paration |
μg/ l |
0.1 |
|
0.2 |
0.4 |
|
0.5 |
|
Mlathiion |
μg/ l |
0.1 |
|
0.32 |
0.32 |
|
0.4 |
|
|
|
|
|
|
|
|
|
|
Herbicide chemical |
|
|
|
|
|
|
|
28 |
2,4D |
μg/ l |
100 |
|
200 |
450 |
|
500 |
2,4,5T |
μg/ l |
80 |
|
100 |
160 |
|
200 |
|
|
|
|
||||||
|
Paraquat |
μg/ l |
900 |
|
1,200 |
1,800 |
|
2,000 |
|
|
|
|
|
|
|
|
|
29 |
Total radioactive active α |
Bq/ l |
0.1 |
|
0.1 |
0.1 |
|
0.1 |
|
|
|
|
|
|
|
|
|
30 |
Total radioactive active β |
Bq/ l |
1.0 |
|
1.0 |
1.0 |
|
1.0 |
|
|
|
|
|
|
|
|
|
31 |
E.Coli |
MPN/100ml |
20 |
|
50 |
100 |
|
200 |
|
|
|
|
|
|
|
|
|
44
|
|
|
|
|
|
Allowable Value |
|
|
|
|
|
|
|
|
|
|
|
|
|
No. |
Parameter |
|
Unit |
A |
|
|
B |
||
|
|
|
|
|
|
|
|
|
|
|
|
|
|
A1 |
|
A2 |
B1 |
|
B2 |
|
|
|
|
|
|
|
|
|
|
32 |
Coliform |
|
MPN/100ml |
2,500 |
|
5,000 |
7,500 |
|
10,000 |
|
|
|
|
|
|
|
|
|
|
Note: |
|
|
|
|
|
|
|
|
|
A1: This is applied to daily life water and use for A2, B1 and B2. |
|
|
|
|
|||||
A2: This is applied to daily life water (after appropriate treatment), protection of underwater flora |
|||||||||
|
and fauna, and use for B2 and B2. |
|
|
|
|
|
|
|
|
B1: This is applied to irrigation water or other uses that require equivalent water quality, and use |
|||||||||
|
for B2. |
|
|
|
|
|
|
|
|
B2: This is applied to water transportation or other use that do not require high water quality. |
|||||||||
|
|
|
|
|
|
|
|
|
|
(4)National Technical Regulation on Coastal Water Quality QCVN 10/2008/BTNMT National Technical Regulation on Coastal Water Quality is shown in Table-21.
Table21: National Technical Regulation on Coastal Water Quality (QCVN 10/2008/BRNMT)
|
|
|
|
Allowable Value |
|
|
|
|
|
|
|
|
|
|
Aquaculture, |
Seaside |
Other areas |
No. |
Parameter |
Unit |
aquatic |
resort, water |
|
|
|
|
creatures |
sport area |
|
|
|
|
protection |
|
|
|
|
|
area |
|
|
|
|
|
|
|
|
1 |
Temperature |
oC |
30 |
30 |
― |
2 |
pH |
― |
6.5-8.5 |
6.5-8.5 |
6.5-8.5 |
|
|
|
|
|
|
3 |
Dissolved oxygen (DO) |
mg/l |
≥ 5 |
≥ 4 |
― |
|
|
|
|
|
|
4 |
Total suspended solid (TSS) |
mg/l |
50 |
50 |
― |
|
|
|
|
|
|
5 |
COD (KMnO4) |
mg/l |
3 |
4 |
― |
6 |
Ammonia (NH+4 : calculated |
mg/l |
0.1 |
0.5 |
0.5 |
by Nitrogen) |
|
|
|
||
|
|
|
|
|
|
|
|
|
|
|
|
7 |
Fluorine (F-) |
mg/l |
1.5 |
1.5 |
1.5 |
|
|
|
|
|
|
8 |
Sulfide (S2-) |
mg/l |
0.005 |
0.01 |
0.01 |
9 |
Cyanide (CN-) |
mg/l |
0.005 |
0.005 |
0.01 |
|
|
|
|
|
|
10 |
Arsenic (As) |
mg/l |
0.01 |
0.04 |
0.05 |
|
|
|
|
|
|
11 |
Cadmium (Cd) |
mg/l |
0.005 |
0.005 |
0.005 |
|
|
|
|
|
|
12 |
Lead (Pb) |
mg/l |
0.05 |
0.02 |
0.1 |
|
|
|
|
|
|
13 |
Chrome (Cr3+) |
mg/l |
0.1 |
0.1 |
0.2 |
14 |
Chrome (Cr6+) |
mg/l |
0.02 |
0.05 |
0.05 |
15 |
Copper (Cu) |
mg/l |
0.03 |
0.5 |
1 |
|
|
|
|
|
|
16 |
Zinc (Zn) |
mg/l |
0.05 |
1.0 |
2.0 |
|
|
|
|
|
|
17 |
Manganese (Mn) |
mg/l |
0.1 |
0.1 |
0.1 |
|
|
|
|
|
|
18 |
Iron (Fe) |
mg/l |
0.1 |
0.1 |
0.3 |
|
|
|
|
|
|
45
|
|
|
|
Allowable Value |
|
|
|
|
|
|
|
|
|
|
|
|
Aquaculture, |
Seaside |
Other areas |
|
No. |
Parameter |
Unit |
aquatic |
resort, water |
|
|
|
|
|
creatures |
sport area |
|
|
|
|
|
protection |
|
|
|
|
|
|
area |
|
|
|
|
|
|
|
|
|
|
19 |
Mercury (Hg) |
mg/l |
0.001 |
0.002 |
0.005 |
|
|
|
|
|
|
|
|
20 |
Oil and grease |
mg/l |
0 |
0 |
― |
|
|
|
|
|
|
|
|
21 |
Mineral oil |
mg/l |
Not |
0.1 |
0.2 |
|
detectable |
|
|
||||
|
|
|
|
|
||
|
|
|
|
|
|
|
22 |
Phenol (total) |
mg/l |
0.001 |
0.001 |
0.002 |
|
|
|
|
|
|
|
|
|
Organochlorine insecticide |
|
|
|
|
|
|
Aldrin+Dieldrin |
μg/ l |
0.008 |
0.008 |
― |
|
|
Endrin |
μg/ l |
0.014 |
0.014 |
― |
|
|
BHC |
μg/ l |
0.13 |
0.13 |
― |
|
23 |
DDT |
μg/ l |
0.004 |
0.004 |
― |
|
Endosulfan |
μg/ l |
0.01 |
0.01 |
― |
||
|
||||||
|
(Thiodan) |
|
|
|
|
|
|
Lindan |
μg/ l |
0.38 |
0.38 |
― |
|
|
Chlordan |
μg/ l |
0.02 |
0.02 |
― |
|
|
Heptachlor |
μg/ l |
0.06 |
0.06 |
― |
|
|
|
|
|
|
|
|
|
Organophosphate insecticide |
|
|
|
|
|
24 |
Paration |
μg/ l |
0.40 |
0.40 |
― |
|
|
Mlathion |
μg/ l |
0.32 |
0.32 |
― |
|
|
|
|
|
|
|
|
|
Herbicide chemical |
|
|
|
|
|
25 |
2,4D |
μg/ l |
0.45 |
0.45 |
― |
|
2,4,5T |
μg/ l |
0.16 |
0.16 |
― |
||
|
||||||
|
Paraquat |
μg/ l |
1.80 |
1.80 |
― |
|
|
|
|
|
|
|
|
26 |
Total radioactive active α |
Bq/ l |
0.1 |
0.1 |
0.1 |
|
|
|
|
|
|
|
|
27 |
Total radioactive active β |
Bq/ l |
1.0 |
1.0 |
1.0 |
|
|
|
|
|
|
|
|
28 |
Coliform |
MPN/100ml |
1,000 |
1,000 |
1,000 |
|
|
|
|
|
|
|
Article 222-2. Maximum allowable value parameter
1.Maximum allowable value of the parameters of wastewater must bereferred to prescribe in the Table-15, 18, 20 and 21.
Article 223. Facility to prevent noise
(1)National Technical Regulation on Noise : QCVN 26/2010/BTNMT The environmental regulation for noise is shown in Table-22.
46
Table22: Environmental regulation for noise (dB (A))
No. |
Zones |
06:00~21:00 |
21:00~06:00 |
|
|
|
|
1 |
Special zones |
55 |
45 |
|
|
|
|
2 |
Normal zones |
70 |
55 |
|
|
|
|
Special zones Medical facilities, libraries, nurseries, schools, churches, meetingplace, the inner area of the temple surrounded by a fence and the defined in separately and specially.
Normal zones Multifamily housing or adjacent house, hotels, rest houses, including an area of government agencies.
(2)Standard related to the allowable noise level in the work place TCVN 3985: 1999
This standard stipulates maximum allowable noise level in the work place such as factory and office. This is applied to control noise level generated during the process of work andworkers affected by plant and machinery. Generally, the allowable noise level must not exceed 85dBA during 8 hour work shift and 115dBA at maximum. In addition, itmust not exceed following allowable limitas shown in Table-23 for the entire period.
Table23: Allowable noise level |
|
|
|
Hours |
Allowable noise level (dBA) |
|
|
4 |
90 |
|
|
2 |
95 |
|
|
1 |
100 |
|
|
30 minutes |
105 |
|
|
15 minutes |
105 |
|
|
― |
Maximum 115 |
|
|
Non-working hour of the work day |
Less than 80 |
|
|
2.Noise prevention measure
2.1Noise control plan
There are a number of sources in the thermal power plant and the propagation paths and their impact
is complicated. Therefore, comprehensive study is needed as a whole power plant when planning not only a single source. The generalprocedures for noise control plan of the power plant areshown in Fig-35. The most effective and economical plan is advanced in the form of determination the amount
of each source volume to satisfy all the objectives in terms of the power plant site boundary repeating the loop within the dotted line in Fig34-. In providing noise control plan, selection of equipments to be taken measure and proposed measures is particularlyimportant and enough effects
47
may not obtain if failed it. It is preferable to use a definite value of noise as possible, sinceth measurement accuracy becomes as the precision of predicted.
Start
Setting of noise level targets
Determin noise level targets at the site boundary according to regulation regional agreement of the region.
Setting of noise level of noise source device
Determin according to noise data from manufacturer, similar specification and similar reduction measures result.
Calculation of noise distribution |
Study of layout |
|
Obtain overall noise distribution from all |
Aim to decrease noise level at the place |
|
noise sources performed on the premises |
||
by reviewing arrengement of devices and |
||
by cluculating noise propagation |
||
buildings. |
||
calculations including screening by power |
||
|
||
plant building. |
|
|
|
Decision of noise reduction targets |
|
|
Determine allowable noise level of devices |
|
|
and required noise reduction to achieve |
|
|
overall target noise level. |
|
|
Impact study of each devices |
|
Reached to |
Examin effect of each devices at the place |
|
target value? |
inorder to investigate cause of exceeding |
|
|
targrt noise level. |
|
|
Noise control of devices |
|
Plan has completed. Create |
Design specific measures such as |
|
application of low-noise device, muting and |
||
noise distribution map. |
||
sound insulation to obtain required noise |
||
|
||
|
reduction. |
Fig35: Practices of noise control plan
Reference: P-61 of Journal (No.557: Feb. /2003): TENPES
2.2 Noise prevention technology
2.2.1Concept of measures
Sound waves emitted from the source is propagated as a change in air pressure, the sound is perceived to the human ear as pressure changes. The nature of noise that is already apparent in the field of audio engineering in this propagation process is used for noise prevention techniques and is taken advantage of mixing and combination of this. Measures are divided into 3 kinds ad follows;
48

1)Measures for noise source
2)Measures for propagation paths
3)Measures for noise receiving side
and is considered as shown in Fig-36 and 37.
2.2.2Measures for noise source
This is a measure to reduce noise and vibration itself from sound device and is the basic for noise control. Noise generation, which are divided into the generated sound by vibration of object and the generated sound due to the flow, mechanism and basic measures of these are as follows;
(1)Noise generated by flow (air sound)
This is a major cause of noise such as fan, air compressors, valves, etc., pressure fluctuations caused by the flow of fluid in the fluid and the sound is generated.
|
|
|
|
|
|
|
|
|
|
|
|
|
|
|
Soundproof |
|
|
|
|
|
|
|
|
||
|
|
|
|
|
|
|
|
|
|
Sound |
|
|
|
|
|
|
|
||||||||
|
|
|
|
|
|
|
|
|
|
|
|
|
|
|
|
|
|
|
|
||||||
|
|
|
|
|
|
|
|
insulation |
|
|
wall |
|
|
|
|
|
|
|
|
||||||
|
|
|
|
|
|
|
|
|
|
|
|
Obstacle |
Site |
|
|
||||||||||
Power |
|
|
|
|
|
||||||||||||||||||||
|
|
|
|
|
|
|
|
|
|
|
|
|
|
|
|
|
|
|
|||||||
|
|
|
|
|
|
|
|
|
|
|
|
|
|
|
|
|
|
|
|
boundaries |
|
|
|||
|
|
|
|
|
|
|
|
|
|
|
|
|
|
|
|
|
|
|
|
|
|||||
|
Silencer |
|
|
|
|
|
|
|
|
|
|
|
|
|
|
|
|
|
|
||||||
|
Sound |
|
|
|
|
|
|
|
|
|
|
|
|
|
|||||||||||
|
|
|
Closing |
|
|
|
|
|
|
|
|
|
|
||||||||||||
Station |
|
|
|
absorption |
|
|
|
|
|
|
|
|
|
|
|
|
|
|
|||||||
|
|
|
|
|
|
|
|
|
|
|
|
|
|
|
|||||||||||
|
|
|
|
of |
|
|
|
|
|
|
|
|
|
|
|
|
Private house |
||||||||
|
|
|
|
|
|
|
|
Warehouse |
|
|
|
||||||||||||||
|
|
|
|
|
|
|
|
|
|
|
|
|
|
|
|
|
|
||||||||
|
|
|
|
|
|
|
|
|
|
|
opening |
|
|
|
|
|
|
|
|||||||
|
|
|
|
|
|
|
|
|
|
|
|
|
|
|
|
|
|
|
|
|
|
|
|
||
|
|
|
|
|
|
|
|
|
|
|
|
|
|
|
|
|
|
|
|
|
|
||||
|
|
|
|
|
|
|
|
|
|
|
|
|
|
|
|
|
|
|
|
|
|
||||
|
|
|
|
|
|
|
|
|
|
|
|
|
|
|
|
|
|
|
|
|
|
|
|
||
|
|
|
|
|
|
|
|
|
|
|
|
|
|
|
|
|
|
|
|
|
|
|
|
|
|
|
|
|
|
Sound source |
|
|
|
|
Distance decay |
|
|
|
|
|
|
||||||||||
|
|
|
|
|
|
|
|
|
|
|
|
|
|
|
|
|
|
|
|
|
|
|
|
||
|
|
|
|
|
|
|
|
|
|
Measure at propagation paths |
|
|
|
|
|||||||||||
|
|
|
|
|
|
|
|
|
|
|
|
|
|
||||||||||||
|
Enclosure |
|
|
|
|
|
|
||||||||||||||||||
|
|
|
|
|
|
|
|
|
|
|
|
|
|
|
|
|
|
|
|
||||||
|
|
|
|
|
|
|
|
|
|
|
|
|
|
|
|
|
|
|
|
||||||
|
|
|
|
|
|
|
|
|
|
|
|
|
|
|
|
|
|
|
|
|
|
|
|
|
|
Fig36: Concept of noise prevention measures
Reference: P-62 of Journal (No.557: Feb. /2003): TENPES
It is effective in lowering velocity to reduce generated sound, since power of generated sound is proposed to the velocity.
(2)Noise generated by vibrating objects
Pressure fluctuations are excited by the vibrations in the fluid in contact with object and sound is generated. Power “W”of generated sound is generally given by equation (1).
W ρcu2s U2R………(1)
Here, “u” is the vibration velocity at radiation surface, “s” is the area of radiation, “c” is the speed of sound,“ρ” is air density,“U (=us)”is the volume velocity,“R (=ρc/s)” is the radiation resistance. A reduction of radiated noise is supposed according to the equation (1) as
49

follows;
2)Reduction of vibration velocity “u”
a.To reduce excitation force (impact force, imbalanced force, friction force and electromagnetic force, etc.).
b.To reduce transmission power.
c.To increase rigidity and weight of body.
d.To suppress the vibration.
3)Reduction of radiation area “s”
There is measure such the change of operation method of device other than 1) and 2) (changes on operation pattern, stopping at night) among these.
|
How to prevent noise |
|
Measure at sound source |
Measure at propagation paths |
|
The basic measure to reduce |
The measure to reduce sound |
|
energy emitted from sound |
||
noise or vibration from sound |
||
device in the process of reaching |
||
device itself. |
||
receiving point |
||
|
Measure at sound receiving side
The measure to reduce noise that reached sound receiving point before human detect by ear.
|
Direct |
|
|
Indirect |
|
|
|
Building structure |
|
Distance |
decay |
|
Obstacle |
|
Directivity |
|
Wearing ear plugs |
|
receivingside |
|
audiencearea |
||||||
|
|
|
|
|
|
|
|
|
|
|
|
|
|
|
|
|
|
|
|||||||||
|
|
|
|
|
|
|
|
|
|
|
|
|
|
|
|
|
|
|
Sound insulation at buiding |
|
Soundproof box for an |
||||||
Improvement of device itself |
Soundproof lagging |
Silencer |
|
Enclosure |
Soundproof & damping treatment |
|
Acaustic treatment |
|
Sound insulation |
|
|
Closing of opening |
|
Building |
Fence |
|
|
||||||||||
|
|
|
|
|
|
|
|
|
|
|
|
|
|
|
|
|
|
|
|
|
|
|
|
|
|
|
|
Fig37: Method to prevent noise
Reference: P-62 of Journal (No.557: Feb. /2003): TENPES
2.2.3Measure for propagation paths
This is the measure to reduce the sound energy reaching the receiving point in the process of propagation of sound waves emitted from a source device, if it is difficult to implement sound source measure. There are the propagation in the air as air pressure fluctuation and the propagation in the
50

solids as vibration as for the noise propagation, there are the following manner as measures to prevent;
1)To reflect the energy of sound and vibration which have been propagated. (isolation, prevention of vibration)
2)To absorb sound and vibration energy as heat energy. (sound absorption, acoustic damping)
3)To change direction of sound propagation. (directional)
4)To take bigger distance from the boundary. (with the attenuation characteristic)
There are general prevention techniques for each as shown in Fig-38;
|
|
Fan |
|
|
|
|
Airborne sound |
|
|
|
|
|
|
|
|
|
Secondary individual sound |
|
|
|
|
|
|
|
|
||||
Air |
|
|
|
|
|
||||
|
|
|
|
|
|
|
|
|
|
|
|
|
|
Air |
|
|
Primary individual sound |
|
|
|
|
||||||||
|
|
|
|
|
|
|
|
|
|
|
|
|
|
|
|
|
|
|
|
Noise generation
Silencer or muffler chamber
Fan |
Soundproof lagging |
Silencer |
Isolator
Acaustic treatment
Enclosure
Soundproof wall
Damping material
Fig38: Method to apply measures preventing noise
Reference: P-63 of Journal (No.557: Feb. /2003): TENPES
51
1)Air noise measurement
a.Noise insulation by building exterior wall
b.Acoustic treatment of interior
c.Enclosure (soundproof cover)
d.Soundproof lagging
e.Soundproof wall
f.Silencer
2)Measure for solid noise
a.Vibration (vibration isolation)
b.Damping (vibration damping)
These application methods are shown in Fig-38.
2.2.4Measures for noise receiving side
This is considered only in a passive measure and a last action, sincethse measures is to reduce perceived by the ear before the sound reaches to the soundreceiving point. There are methods such as measures to prevent in Fig-37.
2.3Noise prevention technology for thermal power plant
Though there are many configuration equipments for thermal power plants, major equipment causing the noise that affects to the outside is as follows;
1)Boiler (including coal mill)
2)Turbine building
3)Transformer
4)Fan (FDF, De-Sox fan)
5)Pump
6)Coal handling facility (unloader, etc.)
7)Others
For these major equipments, measures according to the respective devices are taken in order to meet the target value at boundary. Causes and countermeasures for the current status of this noise level are described as below.
2.3.1Boiler
Boiler noise contains peripheral noise of fan, pump, coal pulverizer, etc. other than the noise of main
52

boiler (furnace wall sound transmission such as combustion sound and gas, air, steam flow sound). When considering the noise reduction of the boiler, the plan is established as for this comprehensive sound, since it is impossible to separate it. Boiler noise of many of the boiler is 85db (A) at the bottom, 75~80dB (A) at the top, which varies by type. Almost modern boilers have been considerably reducing noise by storing in the boiler building, soundproof walls and soundproof lagging. Fig-39 shows the example of measures for turbine building.
2.3.2Turbine building
Noise from the turbine building is a large number of sound transmissions of sound equipment that is installed inside such as the turbine, generator, and feed-water pump. Noise level of the turbine building surface is between 65~70dB (A), since it does not change significantly by the output of a turbine generator and each plant has almost identical building wall structure. Fig-39 shows the example of measures for turbine building.
Boiler house
|
|
|
Wall structure |
|
|
|
|
|
|
|
Sound insulation effect |
|||||
|
|
|
|
|
|
|
|
|
|
|
|
|
|
|
|
|
|
|
|
|
|
|
|
|
|
|
|
|
|
||||
|
|
Sealing material |
|
|
|
|
|
|
|
|
|
|
|
|||
|
|
|
|
|
|
|
|
|
|
|
|
|
|
|
|
|
|
|
|
|
|
|
|
|
|
|
|
|
|
|
|
|
|
Glass fibre reinforced cement |
|
|
|
|
|
|
|
|
|
|||||||
|
|
|
|
|
|
|
|
about 25dB(A) |
||||||||
|
|
|
Stud |
|
||||||||||||
|
|
board |
|
|
|
|
|
(incase no sound |
||||||||
|
|
|
|
|
|
|
|
|
|
|||||||
|
|
|
|
|
|
|
|
|
||||||||
|
|
|
|
|
|
|
|
|
|
|
|
|
|
|
|
insulation material: |
|
|
|
|
|
|
|
|
|
|
|
|
|
|
|
|
|
|
|
|
|
|
|
|
|
|
|
|
|
Airspace |
|
|
||
|
|
Acaustic material |
|
|
|
|
|
|
|
|
||||||
|
|
|
|
|
|
|
|
about 29dB(A)) |
||||||||
|
|
(Glass wool) |
|
|
|
|
|
|
|
|
|
|
||||
|
|
|
|
|
|
|
|
|
|
|
||||||
|
|
|
|
|
|
|
|
|
|
|
|
|
|
|
|
|
|
|
|
|
|
|
|
|
|
|
|
|
|
|
|
|
|
|
|
|
|
Outside |
|
|
|
|
|
Inside |
|
|
|
|
||
|
|
|
|
|
|
|
|
|
|
|
|
|
|
|
|
|
Turbine house
|
|
|
|
|
|
|
|
|
|
|
|
|
|
|
|
|
|
|
|
|
|
|
|
|
|
Turbin building wall |
|
|
|
|
|
|
Top of turbin building wall |
|
|
|
|
||||||||||
|
|
|
|
|
|
|
|
|
|
|
|
|
|
|
|
|
|
|
|
|
|
|
|
|
|
|
|
|
|
|
|
|
|
|
|
|
|
|
|
|
|
|
|
|
|
|
|
|
|
|
|
|
|
|
|
|
|
|
|
|
Column |
|
|
||||||||
|
|
|
|
|
|
|
|
|
|
|
|
Furring |
|
|
|
|
|
||||||
|
PC board |
|
|
|
|
|
|
|
|
|
|
|
|||||||||||
|
|
|
|
|
|
|
Acaustic |
|
|
||||||||||||||
|
Acaustic |
|
|
|
|
|
|
|
|
|
strip |
|
|
|
|
|
|||||||
|
|
|
|
|
|
|
|
|
|
|
|
|
|
||||||||||
|
|
|
Extruded |
|
|
|
|
|
|
|
|
|
|
|
material |
|
|
||||||
|
material |
|
|
|
|
|
|
|
|
|
|
|
|
|
|
|
about 30dB(A) |
||||||
|
|
|
|
|
|
|
|
|
|
|
|
|
|
|
|
||||||||
|
|
|
|
cement |
|
|
|
|
|
|
|
|
|
|
|
|
|
|
|
||||
|
|
|
|
|
|
|
|
|
|
|
|
|
|
|
|
|
|
||||||
|
Column |
|
|
|
|
|
|
|
|
Wall |
|
|
|
Extruded |
|
||||||||
|
|
|
|
board |
|
|
|
|
|
|
|
|
|
|
|||||||||
|
|
|
|
|
|
|
|
|
|
|
(Metal |
|
|
|
cement |
|
|
||||||
|
|
|
|
|
|
|
|
|
|
|
|
|
|
||||||||||
|
Alminium |
|
|
|
|
|
|
|
|
|
|
|
|
||||||||||
|
|
|
|
|
|
|
|
|
|
|
|
|
|
|
|||||||||
|
|
|
|
|
|
|
|
|
|
pannel) |
|
|
|
board |
|
|
|||||||
|
Acaustic |
|
|
|
|
|
|
|
|
|
|
|
|||||||||||
|
rattle |
|
|
|
|
|
|
|
|
|
|
|
|
|
|
|
|
|
|
||||
|
|
|
|
|
|
|
|
|
|
|
|
|
|
|
|
|
|||||||
|
|
material |
|
|
|
|
|
|
|
|
|
|
|
|
Stud |
|
|
|
|||||
|
|
|
|
|
|
|
|
|
|
|
|
|
|
|
|
||||||||
|
|
|
|
|
|
|
|
|
|
|
|
|
|
|
|
|
|
|
|
||||
|
|
|
|
|
|
|
|
|
|
|
|
|
|
|
|
|
|
|
|
|
|
|
|
|
|
|
|
|
|
|
|
|
|
|
|
|
|
|
|
|
|
|
|
|
|
|
|
|
Outside |
|
|
Inside |
|
|
|
|
|
Outside |
|
|
Inside |
|
|
||||||||
|
|
|
|
|
|
|
|
|
|
|
|
|
|
|
|
|
|
|
|
|
|
|
|
Fig39: Measures for noise prevention of boiler and turbine building
Reference: P-64 of Journal (No.557: Feb. /2003): TENPES
53

2.3.3Transformer
Noise of transformer is due to magnetostriction and cooling fan, noise from the former appear generally higher and its frequency of the main component is the harmonics of 50 and 60Hz. Noise level is 80~85Hz at unit side. The method shown in Fig-40 is selected as measures to reduce noise of transformer itself depending on the reduction level. In addition, noise reduction of cooling fan is measured by 1) lowering the fan speeds, 2) installing the duct silencer.
Noise reduction method |
|
|
|
Noise reduction |
|
|
|
||||
|
|
|
(dB(A)) |
|
|
|
|
|
|
|
|
|
|
|
|
|
|
|
|
|
|
|
|
Soundproof wall
system 5 10
Steel plate
soundproof tank 10 20 system
Concrete pannel
soundproof tank 20 30 system
Concrete
soundproof 30 40 building
system
Structure
Soundproof wall
Transformer body
|
|
|
|
|
|
Steel |
|
|
||
|
|
|
|
|
|
soundproof tank |
|
|
||
|
|
|
|
|
|
|
|
|
|
|
|
|
|
|
|
|
|
|
|
|
|
Trans- |
|
|
|
|
|
|
|
|
|
|
|
|
|
|
Sound |
|
|
||||
former |
|
|
|
|
|
|
||||
|
|
|
|
absorption |
|
|
||||
|
body |
|
|
|
|
|
|
|||
|
|
|
|
|
material |
|
|
|||
|
|
|
|
|
|
|
|
|||
|
|
|
|
|||||||
|
|
|
|
|
|
|
||||
|
Concrete pannel soundproof tank |
|
|
|||||||
|
|
|
|
|
|
|
|
|
|
|
|
|
|
|
|
|
|
|
|
|
|
|
|
|
|
|
|
Concrete |
|
|
|
|
|
|
|
|
|
|
|
frame |
|
|
|
|
|
|
|
|
|
|
|
|
||
|
Trans- |
|
|
|
||||||
|
|
|
|
|
|
|
|
|
|
|
former |
|
|
|
|
|
Iron |
|
|
||
|
body |
|
|
|
|
|
|
|
||
|
|
|
|
|
|
|
|
|
|
|
|
|
|
|
|
|
|
|
|
|
|
|
|
Sound absorption material |
|||
|
|
|
|
|
|
|
|
|
Concrete |
|
|
|
|
|
soundproof |
|
|
|
|
|
builing |
|
|
Trans- |
|
|
|
|
|
|
|
|
|
|
|
|
|
Sound absorption |
|
||
former |
|
|
|
||
|
|
material |
|
||
body |
|
|
|
||
|
|
|
|
|
|
|
|
|
|
|
|
Fig40: Measures for noise prevention of transformer
Reference: P-64 of Journal (No.557: Feb. /2003): TENPES
54
2.3.4Fan
Noise of fan can be classified into two, which comes from the drive system for rotating blades and hydrodynamically and occurs by rotating blades hydrodynamically. Usually, the latter is a major source. Noise generation has been bigger due to the increase of flow volume and pressure of fan in the power plant. Therefore, measures as shown in Fig-41 are taken for most of large fan at present and the noise level has been around 80~85dB (A) at unit side. Generally, the occurrence of the fan noise level that is not taken any action is given by the equation (2).
Fig41: Measures for noise prevention of main fans
Reference: P-65 of Journal (No.557: Feb. /2003): TENPES
55
Table24: Specific sound level
|
|
|
Specific sound level |
|
||
|
|
|
|
|
|
|
Type |
LSAdB(A) |
|
LSCdB(A) |
|
||
|
|
|
|
|
|
|
|
upper~lower |
|
range |
upper~lower |
|
range |
|
|
|
|
|
|
|
Turbo fan |
14~26 |
|
12 |
15~27 |
|
12 |
|
|
|
|
|
|
|
Airfoil blower |
4~19 |
|
15 |
12~27 |
|
15 |
|
|
|
|
|
|
|
Radial blower |
10~24 |
|
14 |
16~28 |
|
12 |
|
|
|
|
|
|
|
Multi-blade fan |
13~23 |
|
10 |
23~31 |
|
8 |
|
|
|
|
|
|
|
Axial blower |
21~38 |
|
17 |
26~42 |
|
16 |
|
|
|
|
|
|
|
Reference: P-65 of Journal (No.557: Feb. /2003): TENPES
LPA LSA 10logQ PT………(2)
Here, LSA is specific sound level dB (A) (shown in Table-24), “Q” is flow rate (m3/min) and “PT” is total pressure (mmAq). As can be seen from the equation (2), it is difficult to lower the generated sound, since the outline of noise level is determines if the fan specifications (Q, PT) are determined. However, it is possible to reduce LSA (noise reduction) by including the follows;
1)To change shape of blades, the exit angle and numbers
2)To increase the clearance of tongue
3)To incline the tongue into skew shape
4)To change shape of casing
A variety of research and development have been performed in each manufacturer.
2.3.5Pump
A wide variety of pumps are used in the power plant and those which affects impact to outside are the circulation pump when installing near the boundary. Those of 60~70dB (A) has been a lot due to the application of low noise motor and installation of the enclosure, though noise of the circulation pump which does not take any action is around 90~95dB (A) at the unit side. Noise level of pump is given by the equation (3).
LPA LSA 10logQ H………(3)
Here, “Q”is flow rate (m3/min); “H” is total head (m). Measure as for the pollution source is same as fans.
56
2.3.6Coal handling facility
In coal-fired thermal power plant, mechanical noise such as coal unloader, stacker, reclaimer and conveyor which is installed outdoor has a relatively large extent 75~85dB (A). Measures such as installation of enclosure at noise generation part, application of low noise rollers, and application of damping steel sheet have been taken.
3.Low-frequency noise measure
3.1Low-frequency noise and its effects
Generally, it is said that the ultrasonic frequency sound audible to human ears is approximately 20Hz~20,000Hz. On the other hand, sound waves below 20Hz are called ultra-low-frequency sound. The low-frequency sound which is added the sound of the area that is not perceived as very low sound with ultra-low-frequency sound, the sound with frequency approximately 1Hz~100Hz is called the low-frequency sound. There are effects of low-frequency sound such as “physical impact” which rattletraping of joinery, “sleep impact” which interfereing sleep, “psychological and physiological impact “which sensing of tightness, vibration, headaches, nausea due to the perception of low-frequency sound.
3.2Low-frequency noise prevention plan
3.2.1Development of low-frequency noise prevention plan
Study and planning of prevention measure is advanced in the same manner as in Fig-43. It is necessary to perform the sufficient prediction beforehand, to consider the removal of the causes and to consider of acoustic ways such as installation of silencers if this is difficult. Especially a study of the economic measures will be a point of sound source, since wavelength of low-frequency sound is too long to avoid large prevention device in the acoustically reduction,
3.2.2Prospect of low-frequency noise
It is similar as noise except the excess attenuation (attenuation due to air absorption or ground surface absorption) and the directional attenuation, though the prediction is made using a computer in the calculation as part of preventive measures.
3.2.3Target value of measure
The goal of prevention measure is to be reduced rattletraping of the windows and doors. However, it is set by reference to such measures and past examples in Fig-42 and 43 in general, since the legal regulation of noise so as not established at present.
57

Sound Pressure Level (dB)
Sliding paper door
Wooden sash
Weatherboarding
Alminium sash
Iron sash
Frequency (Hz)
Fig42: Value that window and door begin to rattletrap
Reference: P-66 of Journal (No.557: Feb. /2003): TENPES
Any physiological effects can not occur below this sound pressure level.
Sound Pressure Level (dB)
Okai
Particularly susceptible persons
Yamada
Frequency (Hz)
Fig43: Sensitivity threshold of extremely low-frequency silence
Reference: P-66 of Journal (No.557: Feb. /2003): TENPES
58

3.3 Cause and prevention of low-frequency sound
3.3.1Cause of generation
Generally, low frequency sound is often emitted by the mechanism as shown in Fig-44. One is the case that sound is emitted by the vibration of objects or flow. The other one is the case that sound waves are propagated in the air or through the structure body, it resonates with air column or structure and amplified sound is emitted.
|
|
|
Radiation |
|
|
|
Radiation |
|
|
|
Vibration |
|
|
|
|
|
|
|
|
|
|
|
|
Generation |
|
Transmission |
|
Resonance |
|
|
|
|
|
|
|
|
|
||
of Vibration |
|
|
|
|
|
||
|
|
|
|
|
|
|
|
|
|
|
|
|
|
|
|
Fig44: Radiation mechanism of low-frequency air vibration
Reference: P-66 of Journal (No.557: Feb. /2003): TENPES
Generally, sound arising from such machine often belongsto the former and those arising from the structure often belong to the latter.
3.3.2Prevention
Sources of ultra-low frequency sound have become apparent that a particular machine or structure. Ultra-low frequency sound is caused by malfunction such as resonance mostly, though sound occurs mechanically as a compressors and diesel engines. Therefore, the prevention measures to remove the cause may be main measure, which is differs from the sound source abatement technology. Generally, the following methods are adopted;
1)Removal and improvement of defects
2)Removal of cause of generation
3)Change and improvement of operating conditions
If ultra-low frequency sound is generated mechanically, the muffler is installed.Fig-45 shows an example of a silencer which is used for anti-resonant low-frequency sound. It must be noted that audible effects by the measure on the propagation path such as providing fence or enclosing in the building is not expected, since the wavelength of low-frequency sound is long unlike the noise. Table-25 shows the main causes and technology to prevent of low-frequency sound.
59

Sound
Side Branch
Transmission Loss (dB)
(a) Side Branch Type
kl (radian)
(a) Side Branch
Transmission Loss (dB)
f/fo
(b)
Fig45: Example of a resonance type silencer
Reference: P-67 of Journal (No.557: Feb. /2003): TENPES
Table25: Protection technology for low-frequency air vibration
Type |
Cause of generation |
|
|
Soundproof technology |
||
|
|
|
|
|
|
|
|
Vibration of |
duct |
wall |
,etc, |
Silencers, bypass pipes, stall prevent |
|
Fan |
surging, |
rotating |
|
stall |
reinforced ducts, rectifier plates |
|
|
fluctuating flow |
|
|
|
|
|
|
|
|
|
|
||
|
Compression |
and |
expansion |
Side branch type, expansion type silencer |
||
Compressor |
airing the |
cylinder |
due |
to |
the |
|
|
rotation |
|
|
|
|
|
|
|
|
|
|||
Vacuum pump |
Air vibration caused by rotation |
|
Side branch type, expansion type silencer |
|||
|
|
|
|
|
|
|
|
|
|
|
|
||
Diesel engine |
Compression |
and expansion |
due Expansion type silencer, modification of pipe |
|||
to the rotation of combustion gas |
|
|||||
|
|
|
|
|
||
Vibrating screen |
Structural |
vibration |
due |
Reduction of vibration area, air bala |
||
rotation |
|
|
|
|
reinforcement |
|
|
|
|
|
|
||
|
|
|
||||
Various furnaces |
Air vibration due to combustio |
Anti-resonance baffle, change of combustion |
||||
or resonance, |
|
|
|
|
state, muffler |
|
|
|
|
|
|
||
|
|
|
|
|
|
|
60
Type |
Cause of generation |
|
Soundproof technology |
|
|
||||
|
|
|
|
|
|
|
|||
Boiler |
Karman vortex resonance |
Modification |
after |
removal |
of |
|
|||
|
|
|
anti-resonance baffle |
|
|
|
|||
|
|
|
|
|
|
|
|||
|
|
|
|
|
|
|
|
||
Dum |
Vibration |
of |
water, |
Prevention |
of |
water vibration, preventionof |
|
||
resonance |
|
|
resonance |
|
|
|
|
|
|
|
|
|
|
|
|
|
|
||
|
|
|
|
|
|
|
|
|
|
Bridge |
Vibration resonance |
|
Changing |
the |
mode |
of vibration, |
remova |
|
|
|
|
|
of excitation force |
|
|
|
|||
|
|
|
|
|
|
|
|||
|
|
|
|
|
|
|
|
||
Tunnel |
Pressure change of air |
|
Absorber |
of |
pressure |
change, reduction |
of |
||
|
|
|
power speed of train |
|
|
|
|||
|
|
|
|
|
|
|
|||
|
|
|
|
|
|
|
|||
Large structures |
Resonance of structures |
|
Excitation force |
|
|
|
|||
(Soundproof |
|
|
|
|
|
|
|
|
|
fence e.g.,) |
|
|
|
|
|
|
|
|
|
|
|
|
|
|
|
|
|
|
|
Reference: P-67 of Journal (No.557: Feb. /2003): TENPES
3.4 Low-frequency sound measures of thermal power plants
Exhaust of Compressor, fan, diesel engine, etc. and the surface vibrationof large equipment and structure are considered as a source of low-frequency noise in the thermal power plant. As these measures, the installation of side branch type or expansion type silencer, reinforcement of duct and structure (increasing stiffness) and the like. Since the silencer can be obtained reduction of noise 10~40dB, problems are solved approximately. If the cause of noise is rotating stall and surging, the installation of the bypass tube or rectifier plate, changing the method of operation (speed control) is taken.
3.5Noise originates from workplace sites with high-powered equipment such asthe steam turbine, generator, and high-pressure steam. The noise from these sources is continuous and averages about
90~105 |
decibel |
acoustic dB (A) in the production area. The |
noise is |
reduced by a thick cover of |
insulating material and dispersed by soft insulating material. The |
impact of noise is negligible |
|||
beyond |
500 m |
from the generation site. The noise from |
highpressure- |
valves is intermittent and |
intentionally designed to attract the attention of the operators. The noise generated can be as high as 110~120 dB (A) and last for 5~10 minutes. A computer simulation model was used to capture the noise dispersion. The radius of the area with noise levels of 60dB (A) or higher is less than 250 m from the center of the Project. However, the Project will be equipped with noise reduction equipment for steam exhaust valves. With this equipment, the noise level within 50m of the generation site is 45~60 dB (A). Viet Nam’s noise standard (TCVN 59491995)– allows the maximum noise level in public and residential areas at60 dB (A) from 6 a.m. to 18 p.m., 55 dB (A) from 18 p.m. to 22 p.m., and 45 dB (A) from 22 p.m. to 6 a.m. The World Bank standard allows 70 dB (A) for industrial zones at all times (as shown in Table 25 and 26).
61
Table26: World Bank Standard for Noise
|
|
|
Maximum allowable log equivalent |
||||
|
Receptor |
|
(hourly measurement in db(A)) |
||||
|
|
|
|
|
|
|
|
|
|
Day |
|
|
Night |
||
|
|
|
|
|
|||
|
|
(07:00~22:00) |
|
(22:00~07:00) |
|||
|
|
|
|
|
|
|
|
|
Residential, industrial, educational |
|
55 |
|
|
45 |
|
|
|
|
|
|
|
|
|
|
Industrial, commercial |
|
70 |
|
|
70 |
|
|
|
|
|
|
|
|
|
|
Note-1: dB (A) =decibel acoustic |
|
|
|
|
|
|
|
Source: World Bank Handbook for Pollution Prevention and Control |
|
|
|
|
|
|
|
Table27: Permissible Noise Level (db (B)) (TCVN 5949-1998) |
|
|
||||
|
|
|
|
|
|
|
|
|
Area |
|
Time of Day |
|
|
||
|
|
|
|
|
|
||
|
06:00~1800 |
18:0022:00 |
|
22:00~06:00 |
|||
|
|
|
|
||||
|
|
|
|
|
|
||
|
Quiet Areas (hospitals, libraries, senatorial, school, etc.) |
50 |
45 |
|
40 |
||
|
|
|
|
|
|
|
|
|
Residential Areas (houses, administrative offices, hotels, |
60 |
55 |
|
45 |
||
|
apartments, etc.) |
|
|||||
|
|
|
|
|
|
||
|
|
|
|
|
|
||
|
Commercial and Service Areas |
70 |
70 |
|
50 |
||
|
|
|
|
|
|
|
|
|
Small Industrial Factories Intermingled with Residential |
75 |
70 |
|
50 |
||
|
Areas |
|
|||||
|
|
|
|
|
|
||
|
|
|
|
|
|
|
|
|
Note-1: dB (A) =decibel acoustic |
|
|
|
|
|
|
|
Source: World Bank Handbook for Pollution Prevention and Control |
|
|
|
|
|
|
Article 224. Facility to prevent vibration
1.Target equipment
Sources of vibration from the facility installed in the power plant may be as follows;
1)Compressor
2)Mill and crasher
3)Screen and classifier
4)Emergency diesel generator
2.Anti-vibration
The measures are taken to cut off the source of vibration in order to prevent the resonance due to transmitting vibration to the foundation and building. Therefore,the measures are taken to absorb vibration from equipments by means of isolating equipments with foundation by spring type or air absorber type isolator as shown in Photo-2, 3, 4, 5, 6, 7 and Fig-46 and 47.
62
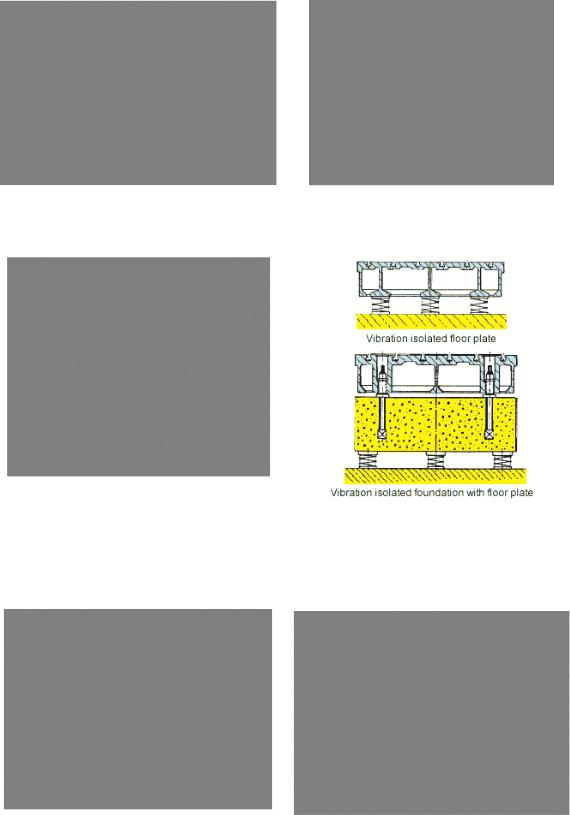
Photo- 2: Isolated base for compressor |
Photo- 3: Isolated base for compressor |
http://www.boushin.co.jp/products/01_sangyo.html http://www.boushin.co.jp/products/01_sangyo.html
Photo- 4: Anti-vibration spring mounts |
Fig46: Vibration isolator |
http://www.engrreview.com/Editorial_pages/2011/01_januar http://www.itbona.com/itbona/stolle/vibrationisolation.htm y_11/products_07.html
Photo- 5: Vibration isolator for gen. set |
Fig47: Vibration isolator for gen. set |
|
http://vibrationisolators.blogspot.com/2011/03/vibration-iso |
http://www.farrat.com/products/alternative_arrangements.ht |
|
lators-for-genset-in.html |
||
ml |
63

Photo- 6: Coal mill spring mount |
Photo- 7: Coal screen base |
http://www.gerb.co.jp/index.php?id=575&no_cache=1&tx_ |
http://vibratingscreen.en.china.cn/selling-leads/detail,11095 |
photogals_elementid=1575&tx_photogals_image=4&MP=5 |
73717,WZSM-Pulverized-Coal-Screen.html |
03-507
3.National Technical Regulation on Vibration: QCVN 27/2010/BTNMT
The environmental regulation for vibration of construction work level is shown as below. Sources of vibration and shock must not exceed the prescribed value in the Table-28.
Table28: Maximum allowable value of vibration acceleration level for construction work
No. |
Zones |
Applying time in a day |
Allowable vibration |
|
acceleration (dB) |
||||
|
|
|
||
|
|
|
|
|
1 |
Special zones |
06:00 ~ 18:00 |
75 |
|
|
|
|||
18:00 ~ 06:00 |
Base level |
|||
|
|
|||
|
|
|
|
|
2 |
Normal zones |
06:00 ~ 21:00 |
75 |
|
|
|
|||
21:00 ~ 06:00 |
Base level |
|||
|
|
|||
|
|
|
|
Moreover, sources of vibration and shock of production and service activities must not exceed the prescribed value in the Tabl-29.
Table29: Maximum allowable value of vibration acceleration for production and service activities
|
|
Applying time in a day and |
|
No. |
Zones |
allowable vibration acceleration (dB) |
|
|
|
|
|
|
|
06:00 ~ 21:00 |
21:00 ~ 06:00 |
|
|
|
|
1 |
Special zones |
60 |
55 |
|
|
|
|
2 |
Normal zones |
70 |
60 |
|
|
|
|
The vibration acceleration of the provisions in Table-28 and 29 must be vibration levels measured at the stable state, mean value of the maximum value measured at periodical or intermittent shaking,
64
mean value of the figures measured 10 times every 5 seconds when shaking happened rather than a stably or equivalent (L10). In addition, the definition of a special zone, a normal zone and basic level are as follows;
Special zones |
Medical facilities, libraries, nurseries, schools, churches, meeting place, |
|
the inner area of the temple surrounded by a fence and the defined in a |
|
separately and specially. |
|
|
Normal zones |
Multifamily housing or adjacent house, hotels, rest houses, including an |
|
area of government agencies. |
|
|
Basic level |
Vibration acceleration level that has measured during no activities such |
(background level) |
as production, commerce, service and construction in areas subject to |
|
evaluation. |
|
|
Article 225. Measures for effluent
Article 225-1.Dust prevention in coal yard
1.Measures to prevent coal dust scattering
1.1Environmental impact of coal dust
The construction of coal-fired thermal power plant has been promoting in the recent construction of thermal power plants in terms of diversification. Therefore, it is necessary prediction and prevention measures of coal dust scattering in the process of dealing coal. Environmental impact of coal dust is
given to environment such as air, soil and water, its main problem is to egivhuman physiological |
|
|
changes |
in air quality. The coal dust changes to dust and alters air quality, affecting the respiratory |
|
tract of |
the human body through air. The smaller the particle size of dust, an influence is |
large. |
Dust with particle size10μ or less is defined as suspended particulate matter, which |
is set |
|
environmental regulation. |
|
|
1.2Occurrence of coal dust
The coal handling and occurrence of coal dust in the coal-fired thermal power plant is shown in Fig-48.
1)Unloading by unloader
2)Transportation by conveyor
3)Stacking by stacker
4)Coal storage
5)Discharging by reclaimer
6)Others (replacement or compression by bulldozer, etc.)
65

The coal handling is consisted by above works. (It is called “unloading, storing and transportation of coal “summarized these. Other than a closed system of these to the atmosphere (for example, such as those of the continuous unloader, tube type conveyor and conveyor enclosed by gallery) is candidate when predicting atmospheric dispersion.
Coal Bulk
Carrier
|
|
|
|
|
|
|
|
|
|
|
|
|
|
|
|
Coal Dust Occurrence |
|
|||
|
|
|
|
Conveyorof |
|
|
|
|
|
|
|
|
|
|
|
|
|
|
|
|
|
|
Unloader |
|
|
|
|
Stacker |
|
|
|
Reclaimer |
|
|
|
|
|
|
|
||
|
|
|
|
|
|
|
|
|
|
|
|
|
|
|
|
|||||
|
|
|
|
|
|
|
|
|
|
|
|
|
Wind |
|
|
|
|
|||
|
|
|
|
|
|
|
|
|
|
|
|
|
|
|
|
|
|
|||
|
|
|
|
|
|
|
|
|
|
|
|
|
|
|
||||||
|
|
|
|
|
|
|
|
|
|
|
|
|
|
|
|
|
|
|
|
|
|
|
|
|
|
|
|
|
|
|
|
|
|
|
|
|
|
|
|
|
|
|
|
|
|
|
|
|
|
|
|
|
|
|
|
|
|
|
|
|||
|
|
|
|
Joint |
|
|
|
|
|
|
|
|
|
|
Wind break Net |
|
|
|||
Hopper |
|
|
|
|
|
|
|
|
|
|
|
|
|
|||||||
|
|
|
|
|
|
|
|
|
|
|
|
|
|
|
|
|
|
|
||
|
|
|
|
|
|
|
|
|
|
|
|
|
|
|
|
|
|
|
||
|
|
|
|
|
|
|
|
|
|
|
|
|
|
|
|
|
Discharge System |
|
||
|
|
|
|
|
|
|
|
|
|
|
|
|
|
|
|
|
|
|||
|
|
|
|
|
|
|
|
|
|
|
|
|
|
|
|
|
|
|
||
|
|
|
|
|
|
|
|
|
|
|
|
|
|
|
|
|
|
|
|
|
|
|
|
|
|
|
|
|
|
|
|
|
|
|
|
|
|
|
|
|
|
|
|
|
|
|
|
|
|
|
|
Water Spray |
|
|
|
|
|
|
|
|
|
|
|
|
|
|
Water Spray |
|
Water Spray |
|
|
|
|
|
|
|
|
|
|
|
|
||
|
|
|
|
|
|
|
|
|
|
|
|
|
|
|
|
|
|
|
|
|
|
|
|
|
|
|
|
|
|
|
|
|
|
|
|
|
|
|
|
|
|
|
|
|
|
|
|
|
|
|
|
|
|
|
|
|
|
|
|
|
|
|
Fig48: Overview of coal handling and coal dust occurrence
Reference: P-68 of Journal (No.557: Feb. /2003): TENPES
1.3Prevention of coal dust scattering
The primary cause and process of coal scattering is shown in Fig-49. The point of measures to prevent coal dust scattering is the measures for pollution source in same manner as other environmental measures. Measure to prevent coal dust generation such as removal or reduction of dust generation factors is important, since it is almost impossible to prevent the spread and to collect if they have once occurred.
1)To reduce the wind speed
2)To sprinkle
3)To enclose
Basically, measures as described above are taken. The typical prevention measure for coal dust scattering in the coal-fired thermal power plant are described and shown in Table-30.
66

|
(Internal Factor) |
|
|
|
|
(External Factor) |
|
|
(Process) |
|
|
|||||||||
|
|
|
|
|
|
|
|
|
|
|
|
|
|
|
|
|
|
|
|
|
|
|
|
|
|
|
|
|
|
|
|
|
|
|
|
|
|||||
|
Characterization of |
|
|
|
|
|
|
|
Dusting |
|
|
|
|
|||||||
|
|
|
Coal Dust |
|
|
|
|
|
|
|
|
|
|
|||||||
|
|
|
|
|
|
|
|
|
|
|
|
|
|
|
|
|
||||
|
|
|
Granularity |
|
|
|
|
|
Weather |
|
|
|
|
|
|
|
|
|
||
|
|
|
Specific Gravity |
|
|
|
|
|
|
|
|
|
|
|
|
|
|
|
||
|
|
|
(Density) |
|
|
|
|
|
Wind Direction |
|
|
|
|
|
|
Sedimentation |
|
|||
|
|
|
|
|
Moisture Content |
|
|
|
|
|
|
|
|
in Yard |
|
|||||
|
|
Moisture Content |
|
|
|
Wind Speed |
|
|
|
|
|
|
|
|||||||
|
|
|
at Stock |
|
|
|
|
|
|
|
|
|
|
|
||||||
|
|
|
at Stock |
|
|
|
Moisture |
|
|
Scattering |
|
|
|
|
||||||
|
|
|
|
|
|
|
Temperature |
|
|
|
|
|
|
|||||||
|
|
|
|
|
|
|
|
|
|
|
|
|
|
|
|
|||||
|
|
|
|
|
|
|
|
|
|
|
Sunny Situation |
|
|
|
|
|
|
|
|
|
|
|
Sape of Coal Pile |
|
|
|
|
|
|
|
Floating |
|
|||||||||
|
|
|
|
|
|
Rainy Situation |
|
|
|
|
|
|
|
|||||||
|
|
|
Generation of |
|
|
|
|
|
|
|||||||||||
|
|
|
|
|
|
|
|
|
|
|
|
|
|
|
|
|
|
|
|
|
|
|
|
|
|
|
|
|
|
|
|
|
|
|
|
|
|
|
|
|
|
|
|
|
|
|
|
|
|
Turbulance |
|
|
|
|
|
|
|
|
|
|
|
|
Acceptance Condition |
|
|
|
|
|
|
|
|
|
|
Aggregation |
|
||||||||
|
|
|
|
|
|
|
|
|
|
|
|
|||||||||
Withdrawal Condition |
|
|
|
|
|
|
|
Sedimentation |
|
|
|
|
||||||||
|
|
|
|
|
|
|
|
|
|
|
||||||||||
|
|
|
|
|
|
|
|
|
|
|
|
|
|
|
|
|
||||
|
|
|
|
|
|
|
|
|
|
|
|
|
|
|
|
|
|
|
||
|
|
|
Conveyor |
|
|
|
|
|
|
|
|
|
|
|
|
|
|
|
|
|
|
|
|
|
|
|
|
|
|
|
|
|
|
|
|
|
|
|
|
|
|
|
|
|
Tripper |
|
|
|
|
|
|
|
|
|
|
|
|
|
|
|
|
|
|
|
|
Recraimer |
|
|
|
|
|
|
|
|
|
|
|
|
|
|
|
|
|
|
|
|
|
|
|
|
|
|
|
|
|
|
|
|
|
|
|
|
|
|
Fig49: Factors and processes of coal dust scattering
Reference: P-68 of Journal (No.557: Feb. /2003): TENPES
Table30: Examples of measures to prevent coal dust scattering
Facility |
Main Measure to |
|
|
|
|
|
|
|
|
|
|
|
|
|
|
|
|
|
|
|
|
|
Concept |
|
|
|
|
|
|
|
|
|
|
|
|
|||
Prevent Coal Dust |
|
|
|
|
|
|
|
|
|
|
|
|
|
|
|
|
|
|
|
|
|
|
|
|
|
|
|
|
|
|
|
|
|
|||||
|
|
|
|
|
|
|
|
|
|
|
|
|
|
|
|
|
|
|
|
|
|
|
|
|
|
|
|
|
|
|
|
|
|
|
|
|
|
|
|
|
|
|
|
|
|
|
|
|
|
|
|
|
|
|
|
|
|
|
|
|
|
|
|
|
|
|
|
|
|
|
|
|
|
|
|
|
|
|
|
|
|
|
|
|
|
|
|
|
|
|
|
|
|
|
|
|
|
|
|
|
|
|
|
|
|
|
|
|||||||||
|
-Wind break fence |
|
|
Grabbucket-type |
|
|
|
|
|
|
|
|
|
Continuous-type |
|
|
|
|
|
|
|
|
|
|||||||||||||||
|
|
|
|
|
|
|
|
|
|
|
|
|
|
|
|
|
|
|
|
|
|
|
|
|
|
|
|
|
|
|
|
|
|
|
|
|
|
|
|
|
|
|
|
|
|
|
|
|
|
|
|
|
|
|
|
|
|
|
|
|
|
|
|
|
|
|
|
|
|
|
|
|
|
|
|
|
|
Un-loader |
|
|
|
|
|
|
|
|
|
|
|
|
|
|
|
|
|
|
|
|
|
|
Windbreak |
|
|
|
|
|
|
|
|
|
|
|
|
|
|
|
|
|
|
|
|
|
|
|
|
|
|
|
|
|
|
|
|
|
|
|
|
|
|
|
|
|
|
|
|
|
|
|
|
|
|
|
|
||
-Water spray equipment |
|
|
|
|
|
|
|
|
|
|
|
|
|
|
|
|
|
|
|
|
|
|
Plate |
|
|
|
|
|
|
|
|
|
|
|
|
|
|
|
|
|
|
|
|
|
|
|
|
|
|
|
|
|
|
|
|
|
|
|
|
|
|
|
|
|
|
|
|
Water |
|
|
|
|
|||||
|
|
|
|
|
|
|
|
|
|
|
|
|
|
|
|
|
|
|
|
|
|
|
|
|
|
|
|
|
|
|
|
|
||||||
|
|
|
|
|
|
|
|
|
|
|
|
|
|
|
|
|
|
|
|
|
|
|
|
|
|
|
|
|
|
|
|
Spray |
|
|
||||
|
|
|
|
|
|
|
|
|
|
|
|
|
|
|
|
|
|
|
|
|
|
|
Water Spray |
|
|
|
|
|
|
|||||||||
|
|
|
|
|
|
|
|
|
|
|
|
Hopper |
|
|
|
|
|
|
|
|
|
|
|
|
|
|
|
|||||||||||
|
|
|
|
|
|
|
|
|
|
|
|
|
|
|
|
|
|
|
|
|
|
|
|
|
|
|
|
|||||||||||
|
|
|
|
|
|
|
|
|
|
|
|
|
|
|
|
|
|
|
|
|
|
|
|
|
|
|
|
|
|
|
|
|
|
|
|
|
|
|
|
|
|
|
|
|
|
|
|
|
|
|
|
|
|
|
|
|
|
|
|
|
|
|
|
|
|
|
|
|
|
|
|
|
|
|
|
|
|
|
|
|
|
|
|
|
|
|
|
|
|
|
|
|
|
|
|
|
|
|
|
|
|
|
|
|
|
|
|
|
|
|
|
|
|
|
|
|
|
-Wind break fence |
|
|
|
|
|
|
|
|
|
|
|
|
|
|
|
|
|
|
|
|
|
|
|
|
|
|
|
Sealbelt-type |
|
|
|
|
|
|
|
||
|
|
Open-type |
|
|
|
|
|
|
|
|
|
|
|
|
Gallery-type |
|
|
|
|
|
|
|
|
|
||||||||||||||
|
|
|
|
|
|
|
|
|
|
|
|
|
|
|
|
|
|
|
|
|
|
|
|
|
|
|
||||||||||||
|
|
|
|
|
|
|
|
|
|
|
|
|
|
|
|
|
|
|
|
|
|
|
|
Sealbelt |
|
|||||||||||||
|
|
|
|
|
|
|
|
|
|
|
|
|
|
|
|
Windbreak |
|
|
|
|
|
|
|
|
|
|
|
|
|
|
|
|
|
|||||
|
|
|
|
|
|
|
|
|
|
|
|
|
|
|
|
|
|
|
|
|
|
|
|
|
|
|||||||||||||
|
|
|
|
|
|
|
|
|
|
|
|
|
|
|
|
|
|
|
|
|
|
|
|
|||||||||||||||
Conveyor |
-Gallery-type, Tube-type |
|
|
|
|
|
|
|
|
|
|
|
|
|
|
|
|
Plate |
|
|
|
|
|
|
|
|
|
|
|
|
|
|
|
|
|
|
|
|
|
|
|
|
|
|
|
|
|
|
|
|
|
|
|
|
|
|
|
|
|
|
|
|
|
|
|
|
Windbreak |
|
|
||||||||
|
|
|
|
|
|
|
|
|
|
|
|
|
|
|
|
|
|
|
|
|
|
|
|
|
|
|
|
|
|
|
|
|
|
|||||
|
|
|
|
|
|
|
|
|
|
|
|
|
|
|
|
|
|
|
|
|
|
|
|
|
|
|
|
|
|
|
|
|
|
|
Plate |
|
|
|
|
-Seal-belt-type |
|
|
|
|
|
|
|
|
|
|
|
|
|
|
|
|
|
|
|
|
|
|
|
|
|
|
|
|
|
|
|
|
|
|
|
|
|
|
|
|
|
|
|
|
|
|
|
|
|
|
|
|
|
|
|
|
|
|
|
|
|
|
|
|
|
|
|
|
|
|
|
|
|
|
|
|
|
-Stowage chute |
|
|
|
|
|
|
|
|
|
|
|
|
|
|
|
|
|
|
|
|
|
|
|
|
|
|
|
|
|
|
|
|
|
|
|
|
|
|
|
|
Stacker |
|
|
|
|
|
|
|
|
|
|
|
|
|
|
|
|
|
|
|
|
|
|
|
|
|
|
|
|
|
|
|
||||
|
|
|
|
|
|
|
|
|
|
|
|
|
|
|
|
|
|
|
|
|
|
|
|
|
|
|
|
|
|
|
|
|
|
|
||||
Stacker |
-Water spray equipment |
|
|
|
|
|
|
|
|
|
|
|
|
|
|
|
|
|
|
|
|
|
|
|
|
|
|
|
|
|
|
|
|
|
|
|
|
|
|
|
|
|
|
|
|
|
|
|
|
|
|
|
|
|
|
|
|
|
|
|
|
|
|
|
|
|
|
|
|
|
|
|
|
|
|
||
|
|
|
|
Stowage Chute |
|
|
|
|
|
|
|
|
|
|
|
|
|
|
|
|
|
|
|
|
|
|
|
|
|
|
||||||||
|
|
|
|
|
|
|
|
|
|
|
|
|
|
|
|
|
|
|
|
|
|
|
|
|
|
|
|
|
|
|
|
|||||||
|
|
|
|
|
|
|
|
|
|
|
|
|
|
|
|
|
|
|
|
|
|
|
|
|
|
|
|
|
|
|
|
|
|
|
|
|
|
|
|
-Constant head control |
|
|
|
|
|
|
|
|
|
|
|
|
|
|
|
|
|
|
|
Constant Head Control |
|
|
|
|
|
|
|
|
|
|
|
|
|||||
|
|
|
|
|
|
|
|
|
|
|
|
|
|
|
|
|
|
|
|
|
|
|
|
|
|
|
|
|
|
|
|
|
|
|
|
|
|
|
|
|
|
|
|
|
|
|
|
|
|
|
|
|
|
|
|
|
|
|
|
|
|
|
|
|
|
|
|
|
|
|
|
|
|
|
|
|
|
|
-Wind break fence |
|
|
|
|
|
|
|
|
|
|
|
|
|
|
|
|
|
|
|
|
|
|
|
|
|
|
|
|
|
|
|
|
|
|
|
|
|
|
|
|
Outdoor Wind break Fence |
|
|
|
|
|
|
|
|
|
|
|
|
Indoor Type |
|
|
|
|
|
|
|
|
||||||||||||||
|
|
|
Water Spray |
|
|
|
|
|
|
|
|
|
|
|
|
|
|
|
||||||||||||||||||||
Coal storage |
-Water spray equipment |
|
|
|
Anti-scattering |
|
|
|
|
|
|
|
|
|
||||||||||||||||||||||||
|
|
|
|
|
|
|
|
|
|
|
|
|||||||||||||||||||||||||||
|
|
|
|
|
|
|
|
|
|
|
|
|
|
|
|
|
|
|
|
|
|
|
Agents Injection |
|
|
|
|
|
|
|
|
|
|
|
|
|||
|
|
|
|
|
|
|
|
|
|
|
|
|
Pile |
|
|
|
|
|
|
|
|
|
|
|
|
|
|
|
|
|
|
|
||||||
|
|
|
|
|
|
|
|
|
|
|
|
|
|
|
|
|
|
|
|
|
|
|
|
|
|
|
|
|
|
|
|
|
|
|
||||
|
-Indoor Coal Storage |
|
|
|
|
|
|
|
|
|
|
|
|
|
|
|
|
|
|
|
|
|
|
|
|
|
|
|
|
|
|
|
|
Silo |
|
|||
|
|
|
|
|
|
|
|
|
|
|
|
|
|
|
|
|
|
|
|
|
|
|
|
|
|
|
|
|
|
|
|
|
||||||
|
|
|
|
|
|
|
|
|
|
|
|
|
|
|
|
|
|
|
|
|
|
|
|
|
|
|
|
|
|
|
|
|
|
|
|
|
|
|
|
|
|
|
|
|
|
|
|
|
|
|
|
|
|
|
|
|
|
|
|
|
|
|
|
|
|
|
|
|
|
|
|
|
|
|
|
|
|
|
|
|
|
|
|
|
|
|
|
|
|
|
|
|
|
|
|
|
|
|
|
|
|
|
|
|
|
|
|
|
|
|
|
|
|
|
|
|
|
|
|
|
|
|
|
|
|
|
|
|
|
|
|
|
|
|
|
|
|
|
|
|
|
|
|
|
|
||||||||||
|
-Wind break cover |
|
|
Recraimer |
|
|
|
|
|
|
|
|
|
|
|
|
|
|
|
|
|
|
|
|
|
|
|
|||||||||||
|
|
|
|
|
|
|
|
|
|
|
|
|
|
|
|
|
|
|
|
|
|
|
|
|
|
|
|
|
|
|
|
|
|
|
|
|
|
|
|
|
|
|
|
|
|
|
|
|
|
|
|
|
|
|
|
|
|
|
|
|
|
|
|
|
|
|
|
|
|
|
|
|
|
|
|
|
|
Reclaimer |
|
|
|
|
Dustproof Cover |
|
|
|
|
|
|
|
|
|
|
|
|
|
|
|
|
|
|
|
|
|
|
|
|
|||||||||
|
|
|
|
|
|
|
|
|
|
|
|
|
|
|
|
|
|
|
|
|
|
|
|
|
|
|||||||||||||
-Water spray equipment |
|
|
|
|
|
|
|
|
|
|
|
|
|
|
|
|
|
|
|
|
|
|
|
|
|
|
|
|
|
|
|
|
|
|
|
|
|
|
|
|
|
|
|
|
|
|
|
|
|
|
|
|
|
|
|
|
|
|
|
|
|
|
|
|
|
|
|
|
|
|
|
|
|
|
|
||
|
|
|
|
|
|
|
|
|
|
|
|
|
|
|
|
|
|
|
|
|
|
|
|
|
|
|
|
|
|
|
|
|
|
|
|
|
|
|
|
|
|
|
|
|
Water Spray |
|
|
|
|
|
|
|
|
|
|
|
|
|
|
|
|
|
|
|
|
|
|
|
|
||||||||
|
|
|
|
|
|
|
|
|
|
|
|
|
|
|
|
|
|
|
|
|
|
|
|
|
|
|
|
|||||||||||
|
|
|
|
|
|
|
|
|
|
|
|
|
|
|
|
|
|
|
|
|
|
|
|
|
|
|
|
|
|
|
|
|
|
|
|
|
|
|
|
|
|
|
|
|
|
|
|
|
|
|
|
|
|
|
|
|
|
|
|
|
|
|
|
|
|
|
|
|
|
|
|
|
|
|
|
|
|
Reference: P-69 of Journal (No.557: Feb. /2003): TENPES |
|
|
|
|
|
|
|
|
|
|
|
|
|
|
|
|
|
|
||||||||||||||||||||
67
1.3.1Measure for coal unloading facility
In case of the club bucket type unloader which is often used conventionally for unloading coal from carrier, coal dust scattering occurs due to taking up in the wind while coal was dropped, since coal is
grasped |
in |
the hold and is |
brought up |
to a hopperabout 20m in height.Therefore, the sprinkler |
system |
and |
wind breaking |
plate has |
beenistalled in the hopper. The continuous unloader has |
recently come to be adopted, since it is possible to enclose except for the excavation part in the hold. The sprinkle equipment has been provided for the excavation part and transit part of conveyor in the machine.
1.3.2Measure for conveyor line
Gallery type which enclose whole conveyor, tube type and seal belt type if it is not applied these are adopted for a conveyor line. The sprinkler system or bag filter dust collector is installed for transit portion of the conveyor.
1.3.3Measure for stacker
The stacking chute, sprinkler, constant control is adopted for the measures, since the part of coal falling is exposed to wind on the stacking stacker and coal dust scattering occurs.
1.3.4Measure for coal stock yard
The coal dust scattering causes from stored coal surface by wind in the outdoor type coal stock yard. Measures such as installation of the wind break fence and establishment of the tree belt are taken in order to weaken wind in the coal stock yard. Also, the tree belt has the supplement effect to catch coal dust. In addition to the sprinkle facility, the spraying equipment for coating a surface of stored coal by anti-flying agent (surfactant) may be provided as a measure against strong winds. Not only from the standpoint of preventing coal dust scattering, the indoor type coal storage yard (dome, silo, etc.) has been adopted, even if not enough coal storage area.
1.3.5Measure for reclaimer, etc.
A new coal surface which is easy to scatter appears when discharge coal by reclaimer or bulldozer by cutting out the coal pile. Measures installing windproof cover, sprinkler systems and other are taken, since there is leakage from reclaimer bucket, scattering due to movement and rising and lowering of the blade portion of the bulldozers, other than scattering from here.
1.3.6About anti-scattering agent (surface activate agent)
When dealing with the foreign coal, some coal rejects water due to high water-repellent. If adding surfactant in the spray water, wetting to the surface of coal particle is accelerated to promote by the reduction effect of surface tension and penetration, as the result it triggered further fine coal aggregation and scattering effect is exerted. There are two types of surfactant, the permeability type which is used when handling coal and coating type which is used during storing coal.
1.4Forecasting of coal dust scattering
It is necessary to select effective arrangement of coal storage yard and measures to prevent coal dust scattering for much less environmental impact on lowering the amount of coal dust to the
68

surrounding area by means of forecasting of coal dust made airborne when constructing coal-fired thermal power plant. It is necessary to forecast the scattering phenomenon (coal dust scattering from unloading, storing and transportation facility), diffusion, sedimentation and deposition phenomena (advection and descent to the ground to the surrounding areas of airborne coal dust) and wind forecasting approach to affect these phenomena is required. The prediction of wind is difficult to generalize, since it varies greatly depending on the terrain, building and arrangement of coal yard. It is required to predict by wind tunnel experiments, etc. depending on the individual subjects. It is possible to predict with a general purpose numerical analysis of diffusion, sedimentation, deposition phenomenon. The outline for forecasting method of coal dust scattering is shown in Fig-50.
|
Selection of Applied Coal and |
|
|
Layout of Major Equipment, |
|||||
|
|
|
Selection of |
||||||
|
Managing Water Quantity |
|
|
||||||
|
|
|
Storage Type & System |
||||||
|
|
|
|
|
|||||
|
|
|
|
|
|
|
|
|
|
|
|
|
|
|
|
|
|
||
|
|
|
|
|
Prediction of Wind Speed |
|
|
||
|
|
|
|
|
Characteristics |
|
|||
|
|
|
|
|
(Wind Tunnel Experiments) |
|
|||
|
|
|
|
|
|
|
|
|
|
|
|
|
|
|
|
|
|
|
|
|
|
|
|
|
Predictio Calculation of Coal |
|
|||
|
|
|
|
|
Dust Scattering |
|
|||
|
|
|
|
|
(Generating and Faiiling |
|
|||
|
|
|
|
|
|
Amount) |
|
||
|
|
|
|
|
|
|
|
|
|
|
Prevention Measure of |
|
|
|
|
|
|
|
|
|
|
|
|
|
Comparison |
|
|
|
|
|
Coal Dust Scattering |
|
|
|
|
|
|||
|
|
|
|
|
|
|
|
||
|
|
|
|
|
|
|
|
|
|
|
|
|
|
|
|
|
|
|
|
|
|
|
|
|
|
|
|
|
|
|
|
|
|
|
Selection of Storage |
|
|
||
|
|
|
|
|
System and Layout |
|
|
||
|
|
|
|
|
|
|
|
|
|
Understanding of
Weather Data
Selection of Predictive Month
(Wind Direction and Speed)
Target Value Limits of the amount of Falling Coal Dust
Investigation in the view point of Coal Starage Facility
Fig50: Summery of coal dust scattering prediction method
Reference: P-70 of Journal (No.557: Feb. /2003): TENPES
Article 225-2. Dust prevention of ash treatment facility
1.It is necessary to recycle as valuable resources as stated in the Guideline for coal ash handling equipment, which the coal ash is available for cement raw materials and gypsum is for plaster board. Improvement of the degree of reuse can be reduced unnecessary scattering of ash at the power plant.
2.It is necessary to transport ash by closed pressure transportation equipment or vacuum transportation equipment, gypsum by covered conveyor, storage must be done in silo in order to prevent scattering of ash and gypsum.
3.It is necessary to prevent the scattering of clinker ash into the environment by transport after humidification or by water flow.
69

4.It is necessary to transport ash by the dedicated vessel, wagon, vehicle and pipe conveyor, and it is necessary to prevent the scattering of ash even when loading by using special dust-proof equipment.
Article 225-3. Effluent from seawater De-SOx
1.Summary
Seawater is used as a solvent to remove SO2 in the flue gas and then absorbed SO2 is returned to the soluble sulfate by aeration, which is discharged into the sea as shown in Fig-51.
2.Feature
1)The absorbent is only seawater and no need chemicals
2)The process is simple and easy operation and maintenance
3)No by-products after absorption
4)Absorbent can be discharge into the sea after aeration
3.Reaction formula
SO2+H2O → HSO3- + H+
HSO3- +1/2O2 → SO4 2- + H+
CO2+H2O→HCO3- + H+
HCO3- + H+ → CO2 +H2O
Treated Gas
|
|
|
|
|
|
|
|
|
|
Seawater |
|||
|
|
|
|
|
|
|
|
P |
|
|
|||
|
|
|
|
|
|
|
|
|
|
|
|
|
|
|
|
|
|
|
|
|
|
|
|
|
|
|
|
Flue Gas |
|
|
|
|
|
|
|
|
|
|
|
|
|
|
|
|
|
|
|
|
|
|
|
|
|
|
|
|
|
|
|
|
|
|
B |
|
|
|
|
|
|
|
|
|
|
Seawater |
|
||||||||
|
|
|
|
|
|
|
|
|
|
|
|||
|
|
|
|
|
|
|
|
|
|
Discharge |
|
||
|
|
|
|
|
|
|
|
|
|
|
|
|
|
|
|
|
|
Absorber |
|
|
|
|
|
|
|
|
|
|
|
|
|
|
|
||||||||
|
|
B |
|
|
Oxidation & Neutralization Basin |
|
|||||||
|
|
|
|||||||||||
|
|
|
|
|
|
|
|
|
|
|
|
|
|
Fig51: System flow of seawater desulfurization method
http://www.fkk.co.jp/?p=1109
The nature of seawater desulfurization method compared with a typical wet and dry method is organized in Table-31.
70

Table31: Comparison of different methods of flue gas desulfurization for coal-fired boiler
|
Process |
|
|
|
Limestone-gypsum method |
|
|
|
|
|
|
|
|
|
Spray dry method |
|
|
|
|
|
|
|
|
|
|
|
|
|
|
Seawater method |
|
|
|
|
|
|
|
|
||||||||||||||||||||||||||||
|
|
|
|
|
|
|
|
|
|
|
|
|
|
|
|
|
|
|
|
|
|
|
|
|
|
|
|
|
|
|
|
|
|
|
|
|
|
|
|
|
|
|
|
|
|
|
|
|
|
|
|
|
|
|
|
|
|
|
|
|
|
|
|
|
|
|
|
|
|
|
|
|
|
|
|
|
|
|
|
|
|
|
|
|
|
|
|
|
|
|
|
|
|
|
|
|
|
|
|
|
|
|
|
|
|
|
|
|
|
|
|
|
|
|
|
|
|
|
|
|
|
|
|
|
|
|
|
|
|
|
|
|
|
|
|
|
|
|
|
|
|
|
|
|
|
|
|
|
|
|
|
|
|
|
|
|
|
|
|
|
|
|
|
|
|
|
Calcium |
|
|
|
|
|
|
|
|
|
|
|
|
|
|
|
|
|
|
|
Seawater |
|
|
|
|
|
|
|
|
|
||||
|
|
|
|
|
|
|
Limestone |
|
|
|
|
|
|
|
|
|
|
|
|
|
|
|
|
|
|
|
|
|
|
|
|
|
|
|
|
|
|
|
|
|
|
|
|
|
|
|
|
|
|
|
||||||||||||||||
|
|
|
|
|
|
|
|
|
|
|
|
|
|
|
|
|
|
|
|
|
|
|
|
|
|
|
|
hydroxide |
|
|
|
|
|
|
|
|
|
|
|
|
|
|
|
|
|
|
|
|
|
|
|
|
|
|
|
|
|
|
|
|
||||||
|
|
|
|
|
|
|
|
|
|
|
|
|
|
|
|
|
|
|
|
|
|
|
|
|
|
|
|
|
|
|
|
|
|
|
|
|
|
|
|
|
|
|
|
|
|
|
|
|
|
|
|
|
|
|
|
|
|
|
|
|||||||
|
|
|
|
|
|
|
|
|
|
|
|
|
|
|
|
|
|
|
|
|
|
|
|
|
|
|
|
|
|
|
|
Bagfilter |
|
|
|
|
|
|
|
|
|
|
|
|
|
|
|
|
|
|
|
|
|
|
|
|
|
|
|
|||||||
|
|
|
|
|
|
|
|
|
|
|
|
|
|
|
|
|
|
|
|
|
|
|
|
|
|
|
|
|
|
|
|
|
|
|
|
|
|
|
|
|
|
|
|
|
|
|
Boiler flue gas |
|
|
|
|
|
|
|
|
|
Treated gas |
|
|
|
|
|||||
|
|
|
|
|
|
|
|
|
|
|
|
|
|
|
|
|
|
|
|
|
|
|
|
|
|
|
|
|
|
|
|
|
|
|
|
|
|
|
|
|
|
|
|
|
|
|
|
|
|
|
|
|
|
|
|
|
|
|
||||||||
|
|
|
|
|
|
|
|
|
|
|
|
|
|
|
|
|
|
|
|
|
|
|
|
|
|
|
|
|
|
|
|
|
|
|
|
|
|
|
|
|
|
|
|
|
|
|
|
|
|
|
|
|
|
|||||||||||||
|
|
|
Boiler flue gas |
|
|
|
|
|
|
|
|
|
|
|
|
|
|
|
|
|
Treated gas |
|
|
|
|
|
|
|
|
|
|
|
|
|
|
|
|
|
|
|
|
|
|
|
|
|
|
|
|
|||||||||||||||||
|
|
|
|
|
|
|
|
|
|
|
|
|
|
|
|
|
|
|
|
|
|
|
|
|
|
|
|
|
|
|
|
|
|
|
|
|
|
|
|
|
|
|
|
|
|
|
|
|||||||||||||||||||
|
|
|
|
|
|
|
|
|
|
|
|
|
|
|
|
|
|
|
|
|
|
|
|
Boiler flue gas |
|
|
|
|
|
|
|
|
Treated gas |
|
|
|
|
|
|
|
|
|
|
|
|
|
Absorption tower |
|
|
|
|
|
|
|
|
|||||||||||
|
|
|
|
|
|
|
|
|
|
|
Absorption tower |
|
|
|
|
|
|
|
|
|
|
|
Spray |
|
|
|
|
|
|
|
|
|
|
|
|
|
|
|
|
|
|
|
|
|
|
|
||||||||||||||||||||
|
|
|
|
|
|
|
|
|
|
|
|
|
|
|
|
|
|
|
|
|
|
|
|
|
|
|
|
|
|
|
|
|
|
|
|
|
|
|
|
|
|
|
|
|
|
|
|
|
|
|
|
|
|
|
|
|
|
|
||||||||
|
|
|
|
|
|
|
|
|
|
|
|
|
|
|
|
|
|
|
|
|
|
|
|
|
|
|
|
|
|
|
|
|
|
|
|
|
|
|
|
|
|
|
|
|
|
|
|
|
|
|
|
|
|
|
|
|
|
|||||||||
|
|
|
|
|
|
|
|
|
|
|
|
|
|
|
|
|
|
|
|
|
|
|
|
|
|
|
|
|
|
|
|
|
|
|
|
|
|
|
|
|
|
|
|
|
|
|
|
|
|
|
|
|
|
|
|
|
|
|||||||||
|
|
|
|
|
|
|
|
|
|
|
|
|
|
|
|
|
|
|
|
|
|
|
|
|
|
|
|
|
|
|
|
|
|
|
|
dryer |
|
|
|
|
|
|
|
|
|
|
|
|
|
|
|
|
|
|
|
|
|
|
|
|
|
|
|
|
|
|
|
|
|
|
|
|
|
|
|
|
|
|
|
|
|
|
|
|
|
|
|
|
|
|
|
|
|
|
|
|
|
|
|
|
|
|
|
|
|
|
|
|
|
|
|
|
|
|
|
|
|
|
|
|
|
|
|
|
|
|
|
|
|
|
|
||
|
|
|
|
|
|
|
|
|
|
|
|
|
|
|
|
|
|
|
|
|
|
|
|
|
|
|
|
|
|
|
|
|
|
|
|
|
|
|
|
|
|
|
|
|
|
|
|
|
|
|
|
EP |
|
|
|
|
|
|
|
|
|
|||||
|
|
|
|
|
|
|
|
|
|
|
|
|
|
|
|
|
|
|
|
|
|
|
|
|
|
|
|
|
|
|
|
|
|
|
|
|
|
|
|
|
|
|
|
|
|
|
|
|
|
|
|
|
|
|
|
|
|
|
||||||||
|
|
|
|
|
|
|
|
|
|
|
|
|
|
|
|
|
|
|
|
|
|
|
|
|
|
|
|
|
|
|
|
|
|
|
|
|
|
|
|
|
|
|
|
|
|
|
|
|
|
|
|
|
|
|
|
|
|
|
||||||||
|
|
|
|
|
|
|
|
|
|
|
|
|
|
|
|
|
|
|
|
|
|
|
|
|
|
|
|
|
|
|
|
|
|
|
|
|
|
|
|
|
|
|
|
|
|
|
|
|
|
|
|
|
|
|
Discharge |
|
|
|||||||||
|
|
|
|
|
|
EP |
|
|
|
|
|
|
|
|
|
|
|
|
|
|
|
|
|
|
|
|
|
|
|
|
|
|
|
|
|
|
|
|
|
|
|
|
|
|
|
|
|
|
|
|
|
|
|
|||||||||||||
|
|
|
|
|
|
|
|
|
|
|
|
|
|
|
|
|
|
|
|
|
|
|
|
|
|
|
|
|
|
EP |
|
|
|
|
|
|
|
|
|
|
|
|
|
|
|
|
|
|
|
|
|
|
|
|
|
|
|
|
|
|||||||
|
|
|
|
|
|
|
|
|
|
|
|
|
|
|
|
|
|
|
|
|
|
|
|
|
|
|
|
|
|
|
|
|
|
|
|
|
|
|
|
|
|
|
|
|
|
|
|
|
|
|
|
|
|
|
|
|||||||||||
|
|
|
|
|
|
|
|
|
|
|
|
|
|
|
|
|
|
|
|
|
|
|
|
|
|
|
|
|
|
|
|
|
|
|
|
|
|
|
|
|
|
|
|
|
|
|
|
|
|
|
|
|
|
|
|
|
|
|
|
|
|
|
|
|
||
|
|
|
|
|
|
|
|
|
|
|
|
|
|
|
|
|
|
|
|
|
|
|
|
|
|
|
|
|
|
|
|
|
|
|
|
|
|
|
|
|
|
|
|
|
|
|
|
|
|
|
|
|
|
|
|
|
|
|
|
|||||||
|
|
|
|
|
|
|
|
|
|
|
|
|
|
|
|
|
|
|
|
|
|
|
|
|
|
|
|
|
|
|
|
|
|
|
|
|
|
|
|
|
|
|
|
|
|
|
|
|
|
|
|
|
|
|
|
|||||||||||
|
|
|
|
|
|
|
Dehydrator |
|
|
|
Wastewater |
|
|
|
|
|
|
|
|
|
|
|
|
|
|
|
|
|
|
|
|
|
|
|
|
|
|
|
|
|
|
|
|
|
|
|
|
|
|
|
|
|
|
|
||||||||||||
|
|
|
|
|
|
|
|
|
|
|
|
|
|
|
|
|
|
|
|
|
|
|
|
|
|
|
|
|
|
|
|
|
|
|
|
|
|
|
|
|
|
|
|
|
|
|
|
|
|
|
|
|
||||||||||||||
|
|
|
|
|
|
|
|
|
|
|
|
|
|
|
|
|
|
|
|
|
|
|
|
|
|
|
|
|
|
|
|
|
|
|
|
|
|
Fly ash: CaSO3&CaSO4 |
|
|
|
|
|
|
|
|
|
|
|
|
|
|
|
|
|
|
|
|
|
|
|
|||||
|
|
|
|
|
|
|
|
|
|
|
|
|
|
|
|
|
|
|
|
|
|
|
|
|
|
|
|
|
|
|
|
|
|
|
|
|
|
|
|
|
|
|
|
|
|
|
|
|
|
|
|
Desulfurization effluent |
|
|
|
|
|
|||||||||
|
|
|
|
|
|
|
|
|
|
|
|
|
|
Gypsum |
|
|
|
|
|
|
|
|
|
|
|
|
|
|
|
|
|
|
|
|
|
|
|
|
|
|
|
|
|
|
|
|
|
|
|
|
|
|
|
|||||||||||||
|
|
|
|
|
|
|
|
|
|
|
|
|
|
|
|
|
|
|
|
|
|
|
|
|
|
|
|
|
|
|
|
|
|
|
|
|
|
|
|
|
|
|
|
|
|
|
|
|
|
|
|
|
|
|
|
|
|
|
|
|||||||
|
|
|
|
|
|
|
|
|
|
|
|
|
|
|
|
|
|
|
|
|
|
|
|
|
|
|
|
|
|
|
|
|
|
|
|
|
|
|
|
|
|
|
|
|
|
|
|
|
|
|
|
|
|
|
adjusting tank |
|
|
|
|
|
||||||
|
|
|
|
|
|
|
|
|
|
|
|
|
|
|
|
|
|
|
|
|
|
|
|
|
|
|
|
|
|
|
|
|
|
|
|
|
|
|
|
|
|
|
|
|
|
|
|
|
|
|
|
|
|
|
|
|
|
|
|
|
|
|
||||
|
|
|
|
|
|
|
|
|
|
|
|
|
|
|
|
|
|
|
|
|
|
|
|
|
|
|
|
|
|
|
|
|
|
|
|
|
|
|
|
|
|
|
|
|
|
|
|
|
|
|
|
|
|
|
||||||||||||
|
|
|
|
|
|
|
|
|
|
|
|
|
|
|
|
|
|
|
|
|
|
|
|
|
|
|
|
|
|
SO2 including in the boiler flue gas is contacted with the wet |
|
|
|
|
|
|
|
|
|
|
|
|
|
|
|
|
|
|
|
|
|
|
||||||||||||||
|
|
|
|
|
|
|
|
|
|
|
|
|
|
|
|
|
|
|
|
|
|
|
|
|
|
|
|
|
|
|
|
|
|
|
|
|
|
|
|
|
|
|
|
|
|
|
|
|
|
|
|
|||||||||||||||
Summery |
|
|
SO2 including in the boiler flue gas is contacted with the wet |
|
|
|
|
|
|
|
|
|
|
|
|
|
|
|
|
|
|
|
|
|
|
|||||||||||||||||||||||||||||||||||||||||
|
|
|
|
absorbent that includes calcium hydroxide in the spray dryer and |
|
SO2 including in the boiler flue gas is contacted with seawater. |
|
|||||||||||||||||||||||||||||||||||||||||||||||||||||||||||
|
|
absorbent that includes limestone in the absorption tower and |
|
|
|
|
||||||||||||||||||||||||||||||||||||||||||||||||||||||||||||
|
|
|
|
|
|
|
||||||||||||||||||||||||||||||||||||||||||||||||||||||||||||
|
|
|
|
|
removed. Calcium sulfite (CaSO3) and calcium sulfate (CaSO4) |
|
|
|||||||||||||||||||||||||||||||||||||||||||||||||||||||||||
|
|
|
removed. Gypsum is recovered as the byproduct of |
|
|
|
|
|
|
Seawater effluent after desulfurization is reduced COD by dilution |
|
|||||||||||||||||||||||||||||||||||||||||||||||||||||||
|
|
|
desurfurization reaction. |
|
|
|
|
|
|
|
|
|
|
|
|
|
|
|
|
|
|
|
including fly-ash as the byproduct of desulfurization reaction is |
|
or aeration and discharged to ocean . |
|
|
|
|
|
|
|
|
|||||||||||||||||||||||||||||||||
|
|
|
|
|
|
|
|
|
|
|
|
|
|
|
|
|
|
|
|
|
|
|
|
|
|
|
|
|
|
removed in the doenstream bagfilter . |
|
|
|
|
|
|
|
|
|
|
|
|
|
|
|
|
|
|
|
|
|
|
|
|
|
|
|
|||||||||
|
|
|
|
|
|
|
|
|
|
|
|
|
|
|
|
|
|
|
|
|
|
|
|
|
|
|
|
|
|
|
|
|
|
|
|
|
|
|
|
|
|
|
|
|
|
|
|
|
|
|
|
|
|
|
||||||||||||
|
|
|
|
|
|
|
|
|
|
|
|
|
|
|
|
|
|
|
|
|
|
|
|
|
|
|
|
|
|
|
|
|
|
|
|
|
|
|
|
|
|
|
|
|
|
|
|
|
|
|
|
|
|
|
|
|
|
|
|
|
|
|||||
|
|
|
|
|
|
|
|
|
|
|
|
|
|
|
|
|
|
|
|
|
|
|
|
|
|
|
|
|
|
|
|
|
|
|
|
|
|
|
|
|
|
|
|
|
|
|
|
|
|
|
|
|
|
|
|
|
|
|
|
|
|
|
|
|
|
|
|
|
|
|
|
|
|
|
|
|
|
|
|
|
|
|
|
|
|
|
|
|
|
|
|
|
|
|
|
|
|
|
|
|
|
|
|
|
|
|
|
|
|
|
|
|
|
|
|
|
|
|
|
|
|
|
|
|
|
|
|
|
|
|
|
|
|
|
|
|
[Reaction formula] |
|
|
|
|
|
|
|
|
|
|
|
|
|
|
|
|
|
|
|
|
|
|
|
|
|
|
|
|
|
|
|
|
|
|
|
|
|
|
|
|
|
|
|
|
|
|
|
|
|
||||||||||||||
|
|
|
|
|
|
|
|
|
|
|
|
|
|
|
|
|
|
|
|
|
|
|
|
|
|
|
|
|
|
|
|
|
|
|
|
|
|
|
|
|
|
[Reaction formula] |
|
|
|
|
|
|
|
|
|
|
|
|
|
|||||||||||
|
|
|
+1/2O |
|
|
→ CaSO |
|
|
× 2H |
|
O+CO |
|
|
|
|
|
[Reaction formula] |
|
|
|
|
|
|
|
|
|
|
|
|
|
|
|
|
|
|
|
|
|
|
|
||||||||||||||||||||||||||
|
|
|
SO |
+2H O+CaCO |
2 |
|
4 |
2 |
2 |
|
|
|
|
|
|
|
|
|
|
|
|
|
|
|
|
|
|
|
|
|
|
SO2+H2O |
→ |
2- |
+ |
|
|
|
|
|
|
|
|
|
|
|
||||||||||||||||||||
|
|
2 |
2 |
|
3 |
|
|
|
|
|
|
|
|
|
|
|
|
|
|
|
|
|
SO2+Ca(OH)2 → CaSO3+H2O |
|
|
|
|
|
|
|
|
|
|
|
|
SO2 |
+2H |
|
|
|
|
|
|
|
|
|||||||||||||||||||||
|
|
|
|
|
|
|
|
|
|
|
|
|
|
|
|
|
|
|
|
|
|
|
|
|
|
|
|
|
|
CaSO3+1/2O2 → CaSO4 |
|
|
|
|
|
|
|
|
|
|
|
|
|
SO22-+2H+ 1/2O2→ SO42-+2H+ |
|
|
|
|
|
|
|
|
||||||||||||||
|
|
|
|
|
|
|
|
|
|
|
|
|
|
|
|
|
|
|
|
|
|
|
|
|
|
|
|
|
|
|
|
|
|
|
|
|
|
|
|
|
|
|
|
|
|
|
|
|
|
|
|
|
|
|
|
|
|
|
|
|
|
|
|
|
|
|
Desulfurization coefficient |
90~99% |
60~80% |
90~98% |
||
|
|
|
|
|
|
absorbent |
Limestone (Cheap and easy to purchase) |
Hydrate lime (higher price than limestone) |
Seawater |
||
|
|
|
|
|
|
Byproduct |
Plaster (use for cement additives, gypsum board, raw materials for soil |
Ash, CaCO3 and CaSO4 (usually, disposal, examples of its use to the |
Low pH wastewater (seawater after desulfurization, ocean discharge by usual |
||
improvement or disposal) |
construction or road material). |
diluted seawater) |
|||
|
|
||||
|
|
|
|
|
|
Installation area |
Base |
Small |
Large |
||
|
|
|
|
|
|
Delivery experience |
Many (mainstream of desulfurization in the world) |
Few (application examples in the USA and North America) |
Few (recently, proven cases in Southeast Asia) |
||
|
|
|
|
|
|
|
Advantage |
Absorbent is cheap. |
Typically, GGH is omitted. |
Essentially, seawater as absorbent is free. |
|
|
There is market for byproduct. |
It can be no drainage. |
System is simple. |
||
|
|
||||
Features |
|
|
|
|
|
Disadvantage |
Wastewater treatment facility is required. |
Relatively low desulfurization efficiency. |
Usually, GGH is required. |
||
|
|||||
|
Excess absorbent is required. (high Ca/S ratio) |
Large amount of wastewater. |
|||
|
|
Usually, GGH is required. |
Large cost of absorbent and high operation costs. |
Large power consumption, high operation costs. |
|
|
|
|
|||
|
|
|
|
|
|
|
|
High desulfurization efficiency is required and applied to relatively |
This is applied to the facility which is not relatively large scale, small |
Installation is limited to coastal areas. In addition, the possibility of |
|
Application |
large capacity, since the main reason is cheap absorbent and can be |
||||
desulfurization load and low required efficiency. |
application will depend on the wastewater regulation to the ocean. |
||||
|
|
purchase stably. |
|||
|
|
|
|
||
71

Article 226. Measures for dust from coal unloading pier, coal yard and ash pond
1. Environmental measures for dust from coal unloading pier and coal yard mustperformedbe considering as follows;
(1)Guideline for coal fuel handling facility: Article 54-2-10 “environmental measures”
(2)Guideline for environmental facility: Article 225-1 “dust prevention in coal yard”
(3)Guideline for environmental facility: Article 225-2 “dust prevention of ash treatment facility”
Article 227. Measures for thermal effluent
5.Measures for thermal effluent
5.1 Discharge and dilution of thermal effluent
5.1.1Discharge of thermal effluent
The concept of condenser cooling water system in the thermal power plant is shown in Fig-52. Large amount of cooling water taking in from the seawater intake removes heat from the steam as it passes through the condenser, water temperature rises about 7oC and is discharge from the outlet. This is the so-called thermal effluent. Amount of this thermal effluent (cooling water) may vary depending on conditions such as the scale of power plant, steam condition, water temperature; the relation defined by the equation (4) between condensate temperatures is holds. In the recent performance on a scale of 1,000,000kw thermal power plants, the amount of thermal effluent is 45m3/s in steam turbine power plants, 30m3/s in combined cycle power plants, 70m3/s in nuclear power plants.
Q =W (iE −iC ) c ×(T2 −T1) (4)
Here, Q indicates the amount of cooling water (kg/h), W is the amount of turbine exhaust (kg/h), iE is the enthalpy of the turbine exhaust (kcal/kg), iC is the enthalpy of the condensate (kcal/kg), c is the specific feat of cooling water (kcal/kg oC), T1 is the inlet temperature of condenser (oC), T2 is the outlet temperature of condenser (oC).
|
|
|
|
|
|
|
|
|
|
|
Inlet Temperature |
|
|
|
|
|
|
|
|
|
|
|
|
||
|
|
|
|
|
|
Rotary |
|
|
|
|
|
|
|
|
|
|
|
|
|
|
|||||
Unit: |
|
|
|
|
|
|
|
Measurement Position |
|
|
|
|
|
|
|
Discharge Temperature |
|
|
|||||||
|
|
|
|
|
|
Screen |
|
|
|
CWP |
|
|
|
|
|
|
|
|
Measurement Position |
|
|
||||
|
|
|
|
|
|
|
|
|
|
|
|
|
|
|
|
|
|
|
|||||||
|
|
Curtain Wall |
|
|
|
|
|
|
|
|
|||||||||||||||
|
|
|
|
|
|
|
|
|
|
|
|
|
|
|
|
|
|
|
|
|
|
|
|
||
|
|
|
|
|
|
|
|
|
|
|
|
|
|
|
|
|
|
|
|
|
|
|
|
||
|
|
|
|
|
|
|
|
|
|
|
|
|
|
|
|
|
|
|
|
|
|
|
|
||
|
|
|
|
|
|
|
|
|
|
|
|
|
|
|
|
|
|
|
|
|
|
|
|
|
|
|
|
|
|
|
|
Bar Screen |
|
|
|
|
|
|
|
|
|
|
|
|
|
|
|
||||
|
|
|
|
|
|
|
|
|
|
|
|
|
|
|
|
|
|
|
|
|
|||||
|
|
|
|
|
|
|
|
|
|
|
|
|
|
|
|
|
|
|
|
|
|
|
|
||
|
|
|
|
|
|
|
|
|
|
|
|
|
|
|
|
|
|
|
|
|
|
|
|
|
|
|
|
|
|
|
|
|
|
|
|
|
|
|
|
|
|
Condenser |
|
|
|
|
|
|
|
||
|
|
|
Intake |
|
|
|
|
|
|
|
|
|
|
|
|
|
|
|
|
|
|
||||
|
|
|
|
Intake Culvert |
|
|
|
|
|
Discharge |
|
Discharge Culvert |
|
|
|||||||||||
|
|
Intake Pipe |
|
||||||||||||||||||||||
|
|
|
|
|
|
|
|
|
|
|
|
|
|
|
|
|
|
|
|
||||||
|
|
|
|
|
|
|
|
|
|
|
|
|
|
|
|
|
|
|
|||||||
|
|
|
|
|
|
|
|
|
|
|
|
|
|
|
|
|
|
|
|||||||
|
|
|
|
|
|
|
|
|
|
|
|
|
|
|
|
|
|
|
Pipe |
|
|
|
|
Outlet |
|
|
|
|
|
|
|
|
|
|
|
|
|
|
|
|
|
|
|
|
|||||||
|
|
|
|
|
|
|
|
|
|
|
|
|
|
|
|
|
|
|
|
|
|
|
|
|
|
Intake Chamber
Fig52: Schematic drawing of Condenser Cooling Water System
Reference: P-70 of Journal (No.557: Feb. /2003): TENPES
72

5.1.2Diffusion and cooling of thermal effluent
Diffusion and cooling process of water discharge from the outlet to the sea is as shown in Fig-53. The temperature of the thermal effluent which is released to the sea surface is 7oC higher than the natural condition (environmental temperature) and has spread thin due to low density. The thermal effluent spread to sea area, loses heat and finally back to the environmental temperature gradually. Its process is performed by a complicated combination of the following three symptoms.
1)Heat transfer by the flow of drainage
2)Mixing and dilution with ambient cold seawater (eddy diffusion, joint virtual water and tidal mixing)
3)Heat radiation from sea surface to air
The effect on the vertical water temperature rises is so much larger than the horizontal thermal diffusion and it spreads in a thickness of about 2~3m from the sea surface in general. Generally, most of the thermal effluent temperature rise is reduced during the thermal effluent emerge to surface, since diluted mixture with subscription the surrounding cold seawater is increased when discharging water in the sea at faster than discharging to surface. The thermal effluent spreading and rising to near sea level diffuse horizontally in a form similar as surface discharge.
|
|
|
|
|
|
|
|
|
|
|
|
|
|
|
|
Thermal Effluent |
|||
|
|
|
|
|
|
|
|
|
Land |
|
|
|
|
|
|
|
|
|
|
|
|
|
|
|
|
|
|
|
|
|
|
|
|
|
|
|
|||
|
|
|
|
|
|
|
|
|
|
|
|
|
|
|
|
|
|
|
|
|
|
|
|
|
|
|
|
|
|
|
|||||||||
Radiation Heat fro the Sun |
|
|
|
|
|
|
|
|
|
|
|
|
|
|
|||||
|
|
|
|
Heat Exchange with the |
|
|
|
||||||||||||
|
|
|
|
|
|
|
|
|
|
Atmosphere and the Sea |
|
|
|
||||||
|
|
|
|
|
|
|
|
|
|
|
|
|
|
|
|||||
|
|
|
|
|
|
|
|
|
|
|
|
|
|
|
|
|
Increase in |
|
|
|
|
|
|
|
|
|
|
|
|
|
|
|
|
|
|
||||
|
|
|
Evaporation |
|
|
|
|
|
|
|
|
|
Deep water |
|
|||||
|
|
|
|
|
|
|
|
|
|
|
|
|
|
|
|
|
|
|
|
|
|
|
|
|
|
|
|
|
|
|
|
|
|
|
|||||
Natural State |
|
|
|
Temperature |
|
|
|
|
|
|
|
|
|||||||
|
|
|
|
Rise Area |
|
|
Mixing by Vortex Diffusion |
|
|
||||||||||
|
|
|
|
|
|
|
|
|
|
|
|
||||||||
|
|
Mixing by Tidal Flow |
|
|
|
|
|
|
|
|
|
||||||||
|
|
|
|
|
|
|
|
|
|
|
|
|
|
|
|
|
|
|
|
|
|
|
|
|
|
|
|
|
|
|
|
|
|
|
|
|
|
|
|
|
Diffuse Area of |
|
|
|
|
|
|
|
|
|
|
|
|
|
|
|
|
||
|
|
|
|
|
|
|
|
|
|
|
|
|
|
||||||
|
Thermal Effluent |
|
|
|
|
|
|
|
|
Seabed |
|
|
|
|
|
|
|||
|
|
|
|
|
|
|
|
|
|
|
|
|
|
|
|
|
|
|
|
Fig53: Spreading and Cooling Process of Thermal Effluent
Reference: P-71 of Journal (No.557: Feb. /2003): TENPES
73

5.2Effects and measures of thermal effluent
Impact on the natural environmental due to thermal effluent discharge may be considered primarily as follows;
1)Water temperature
2)Flow direction and velocity
3)Marine animal
4)Marine plants
The most appropriate measures for intake and discharge are taken to the characteristics of the location of power plant in order to reduce impacts. The following methods are applied to measures to prevent effects due to thermal effluent.
5.2.1Deep-water intake system
Generally, the temperature stratification is formed to a depth of 3~4m below sea level in summer in Japan, surface temperature is expected to be 2~4oC lower than lower layer. This system is to minimize the difference between environmental temperatures near the outlet as much as possible by means of sucking in low temperature seawater from low layer focusing on water temperature stratification. In the modern power plants this method is increasingly adopting in the viewpoint of preventing recirculation of thermal effluent into the intake. Typical shape is shown in Fig-54, 55, 56 and Photo-8.
Conical Cap (Velocity Cap)
|
|
|
|
|
|
|
|
|
|
|
Screen |
|
|
|
Curtain Wall |
|
|
|
|
|
|
|
|
|
|
|
|
||
|
|
|
|
|
|
|
|
|
|
|
Chlorine Injection Diffuser |
|||
|
|
|
|
|
|
|
|
|
|
|
||||
|
|
|
|
|
|
|
|
|
|
|
|
|||
|
|
|
|
|
|
|
|
|
|
|
|
|||
|
|
|
|
|
|
|
|
|
|
|
|
|
|
|
|
|
|
|
|
|
|
|
|
|
|
Bottom Flow Guide Plate |
|
||
|
|
|
|
|
|
|
|
|
|
|
|
|
|
|
|
|
|
|
|
|
|
|
|
|
|
|
|
|
|
|
|
|
|
|
|
|
|
Stone Masonry |
|
|
|
|
|
|
|
|
|
||||||||||||
|
|
Stone Masonry |
|
|||||||||||
|
|
|
|
|
|
|
|
|
|
|
|
|
|
|
|
|
|
|
|
|
Steel Pipe Pile |
|
|||||||
|
|
|
Steel Pipe Pile |
|
|
|
|
|
|
|
|
|
||
|
|
|
|
|
|
|||||||||
Fig54: Curtain wall intake facility |
Fig55: Deep-water intake |
Reference: P-71 of Journal (No.557: Feb/2003): TENPES |
Reference: P-71 of Journal (No.557: Feb/2003): TENPES |
74
Water Temp.
Deapth (m)
Photo- 8: Curtain wall intake facility |
Fig56: Deep-water intake facility |
http://www.smcon.co.jp/works/engineer/kasen/shin-nagoy |
http://www.tobata-kyoka.co.jp/060kankyo/kankyotaisaku. |
a.html |
htm |
5.2.2Measures when discharging thermal effluent
The surface discharge system has an advantage that it can reduce impediments to the ship and low impact on benthic organisms since low discharge velocity; however, there is disadvantage that it is difficult to reduce temperature rise and diffusion. Therefore, it is promoted the mixture cooling by devising the discharge method, which the effects due to thermal effluent is performed.
(1)Porous oblique outlet dam
This is the method to minimize temperature rise by diluting and mixing forcibly with cool water at the lower part of sea in relatively deep water depth by means of providing the porous oblique outlet dam in front of discharge (provided the hole in the bottom weir) and extruding thermal effluent from the front of this weir. The typical shape of it is shown in Fig-57.
Seawall Caisson
Drainage Pond
Discharge Pipe |
|
Masonry Block |
|
|
|
Fig57: Typical construction of porous oblique outlet dam
Reference: P-72 of Journal (No.557: Feb/2003): TENPES
75

(2)Discharge in water (deep discharge)
If the depth is deeper near the outlet or discharge of water, the thermal effluent is released directly into deeper part or led to more than 10m water depth and discharge water jet from the nozzle of tube-shaped porous branch provided at the tip. The temperature is reduced sufficiently by means of jet diffusion and gravity mixture during flowing up to surface in order to obtain dilution effect. This
method is selected the proper use depending on the circumstances of seabed or sea area condition with a porous oblique outlet dam. The typical shape is shown in Fig-58 and 59. Sufficient care must be taken to prevent scouring of the seabed due to fast flow rate of discharge, though it is possible to reduce the impact on shallow marine wildlife in case of these method s. In addition to the above, there is a cooling tower system to discharge waste heat directly into the atmosphere via cooling tower.
Nozzle
Discharge Tip
Discharge Pipe
Discharge Tip |
|
Nozzle |
|
|
|
Discharge Tip |
|
Steel Structure |
|
|
|
Fig58: Multi PipeType (Parallel Discharge) |
Fig59: Multi PipeType (Radiation Discharge) |
Reference: P-72 of Journal (No.557: Feb/2003): TENPES |
Reference: P-72 of Journal (No.557: Feb/2003): TENPES |
76