

Книги по МРТ КТ на английском языке / Thomas R., Connelly J., Burke C. - 100 cases in radiology - 2012
.pdfANSWER 55
The ultrasound image in Figure 55.1 demonstrates a large, anechoic (in other words, no echoes or solid component) fluid collection within the abdomen. The edge of the liver is seen in the bottom left of the image and collapsed loops of bowel are seen inferiorly and to the right. The ultrasound image has been acquired with the probe held in a longitudinal orientation in the subphrenic region.
The axial contrast enhanced CT image in Figure 55.2 confirms a large volume of fluid around the inferior margin of the liver, the spleen and within the upper abdomen.
Ascites describes the condition of pathological collection of fluid within the abdominal cavity and there is a wide differential of both transudative and exudative causes.
Uncomplicated (in other words non-infected, inflammatory or malignant) ascites appears as a homogeneous, freely mobile, anechoic collection in the peritoneal cavity demonstrating acoustic enhancement. Free ascites does not displace organs but typically distributes itself between them, conforming to organ margins.
Features suggesting complicated ascites include fine or coarse internal echoes, septation, loculation or atypical fluid distribution, matting/clumping of bowel loops and thickening of interfaces between the fluid and adjacent structures.
Traces of fluid usually collect in the posterior subhepatic space (Morrison’s pouch) and around the liver as a sonolucent (dark on ultrasound) band. Fluid also often localizes in the pouch of Douglas (recto-uterine pouch). Where there is a large volume of ascites, the small bowel loops have a characteristic appearance on ultrasound as they hang from a vertically floating mesentery.
Ascites is also usually demonstrated well on CT scanning. CT may also demonstrate the aetiology including features suggestive of neoplasia such as hepatic, splenic or adrenal lesions, lymphadenopathy or masses arising from the bowel, ovary or pancreas.
This patient was found to have a gastrointestinal stromal tumour as the cause of his ascites.
KEY POINTS
•Ultrasound and CT are both sensitive to small volumes of ascites and may demonstrate the aetiology.
152
CASE 56: A PAINFUL HAND
History
A 55-year-old woman presents to her general practitioner (GP) with several weeks of pain in the left hand. She remembers tripping in the garden and landing on her left outstretched hand previously but had not attended the accident and emergency department, as she did not feel she had sustained a fracture.
She is otherwise fit and well. Her symptoms include pain (which she describes as ‘burning’ type), tenderness and swelling in the left hand.
Examination
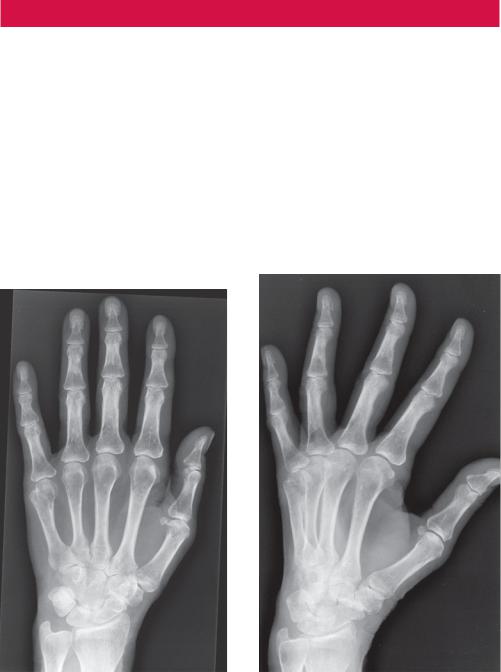
On examination there is wasting of the intrinsic muscles of the hand associated with evidence of sweating, warmth and flushed, shiny skin. There was evidence of hyperaesthesia, hyperalgesia and allodynia. There was no evidence of synovitis or deformity, however. The GP decided to refer the patient to her local hospital for an X-ray (Figures 56.1a,b).
(b)
Figure 56.1 (a) Posterior–anterior (PA) and (b) oblique views.
Question
• What abnormality do you notice on these hand radiographs?
153

ANSWER 56
There is diffuse reduction in radiological bone density (increased radiolucency) in a predominantly periarticular distribution around the joints of the hand. There is, however, no associated evidence of joint erosions or destruction and no focal destructive cortical bony lesion or periosteal reaction is seen. Features are consistent with a regional periarticular osteopaenia.
Osteopaenia refers to reduced bone mineral density and, radiologically, to increased radiolucency of bone. The most common cause by far of osteopaenia is osteoporosis, however, there are multiple aetiologies so the finding of radiolucent bone does not make this an automatic diagnosis. One should search for other more specific clues to the exact underlying disorder and more specific radiographic clues to their diagnosis.
Osteopaenia can be difficult to diagnose accurately on plain radiographs which are frequently insensitive to changes in bone mineral. Approximately 30–50 per cent of the bone mass must be lost before it can be detected on a plain film.
Osteopaenia may be diffuse or regional and the differential diagnosis is broad and can be vascular, drug-induced, toxic, endocrine/metabolic, congenital or idiopathic. Causes of regional osteoporosis include immobilization with disuse and regional sympathetic dystrophy syndrome (RSDS).
In the hand radiographs seen in Figures 56.1, the joint spaces are generally preserved with no destructive changes. The history, examination and imaging features suggested regional osteoporosis secondary to RSDS.
The exact mechanism of how RSDS develops is poorly understood. Theories include irritation and abnormal excitation of nervous tissue, leading to abnormal impulses along nerves that affect blood vessels and skin. A variety of events can trigger the condition, including trauma, surgery, heart disease, degenerative arthritis of the neck, stroke or other brain diseases, nerve irritation by entrapment (such as carpal tunnel syndrome), shoulder problems, breast cancer, and drugs for tuberculosis and barbiturates. The incidence after fractures and contusions ranges from 10 to 30 per cent. In this case the patient had sustained trauma in the absence of a fracture. While some cases are associated with an identifiable nerve injury, many are not and there is no associated event in a third of patients. The upper extremities are more likely to be involved than the lower.
KEY POINTS
•Osteopaenia refers to increased radiolucency of bone. The most common cause by far of osteopaenia is osteoporosis.
•Osteopaenia can be diffuse or localized. Secondary clues should be sought to identify the aetiology.
154
CASE 57: A RETIRED CONSTRUCTION WORKER WITH A COUGH
History
A 65-year-old retired construction worker attends his general practitioner (GP) with a cough. The cough was non-productive and he denied feeling significantly short of breath. He also denied fevers and weight loss. He was a non-smoker and had been otherwise well aside from taking a thiazide diuretic for hypertension, which was well controlled. He had only a history of hernia repair and appendicectomy many years previously. In his occupational history, he had retired from construction work aged 50 and had worked in an administrative role for the last 15 years.
Examination
On examination he looked well. There was good air entry and chest expansion bilaterally, breath sounds were vesicular and there were no added sounds.
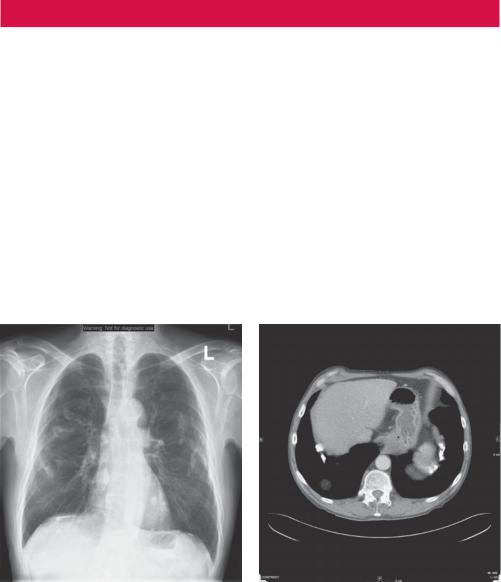
A routine chest radiograph was performed (Figure 57.1). Upon reviewing the radiograph the GP requested a computed tomography (CT) scan of the thorax (Figure 57.2).
Figure 57.1 Chest radiograph. |
Figure 57.2 CT scan of thorax. |
Questions
•What do the chest radiograph and the CT scan demonstrate?
•What may cause this appearance?
155

ANSWER 57
The chest radiograph in Figure 57.1 demonstrates multiple bilateral radio-opaque pleural plaques consistent with previous exposure to asbestos. This is confirmed on CT in Figure 57.2 where calcified pleural plaques are seen along the diaphragmatic pleura.
Pleural plaques are deposits of hyalinized collagen fibres in the parietal pleura. They are indicative of asbestos exposure and typically become visible after a latency period of 10–20 or more years after the inhalation of asbestos fibres. Asbestos is a naturally occurring fibrous silicate that was widely used in the past for a range of commercial applications including shipbuilding, construction, textile and insulation industries.
In addition to benign pleural plaques, however, there is also a spectrum of more significant asbestos-related thoracic diseases including benign pleural effusion, diffuse pleural thickening, rounded atelectasis, asbestosis (i.e. lung fibrosis), mesothelioma and lung cancer. Plaques may occur in isolation as in this case or in association with lung parenchymal disease.
Pleural plaques are usually multiple, bilateral and often relatively symmetrical and are located in the mid portion of the chest wall between the seventh and tenth ribs, following rib contours, or adjacent to the aponeurotic portion of the diaphragm (as seen on the CT). Visceral pleura, lung apices and costophrenic angles are usually spared.
On chest radiographs, the prevalence of calcification in pleural plaques is reported to be around 15 per cent, however CT is far more sensitive with sensitivity around 50 per cent. In profile, calcified plaques appear as opaque lines that lie parallel to the chest wall, mediastinum, pericardium and diaphragm. Viewed en face, calcified plaques are seen as irregular and heterogeneous densities. The presence of bilateral, superior diaphragmatic surface calcifications with spared costophrenic angles is virtually pathognomonic for asbestos-related pleural disease. Isolated plaques and diffuse pleural thickening may also seen in tuberculosis, trauma and haemothorax.
CT scanning is often used in the evaluation of pleural disease. Plaques appear as discrete, well-defined areas of localized pleural thickening which are usually multiple, bilateral and located adjacent to rigid structures, such as the ribs, mid portion of the chest, aponeurotic portion of the diaphragm, mediastinum and paravertebral regions. Lung apices and costophrenic angles typically are spared. Rarely, the visceral pleura within fissures may be involved, or plaques may be pedunculated.
CT scanning (in particular, high-resolution CT) allows demonstration of interstitial infiltrates and fibrosis, and may be helpful in diagnosing early stages of asbestosis. It also is useful in delineation of pleural or pleura-based abnormalities (for example, effusion, thickening, plaque, malignant mesothelioma, rounded atelectasis) and in evaluation of a parenchymal density that is suggestive of bronchogenic carcinoma.
In this case, the CT failed to show any further significant sequelae of asbestos exposure and the patient recovered with a short course of antibiotics. In the absence of any other sign of asbestosrelated disease, isolated pleural plaques alone do not require further follow-up or investigation.
KEY POINTS
•Latency time for development of pleural plaques is usually around 20 years.
•Most patients who have asbestos-related pleural plaques are asymptomatic. The chest radiograph plays an important role in detection of asbestos-related pleural and parenchymal abnormalities and assessment of progression of disease.
•High-resolution CT is superior to the radiograph in detection of pleural plaques and is more sensitive and specific for the diagnosis of asbestos-related pleural disease.
156
CASE 58: DISTENDED ABDOMEN AND UNABLE TO PASS GAS
History
A 38-year-old man attends the accident and emergency department with a 48-hour history of cramping abdominal pain associated with nausea and vomiting. He felt his abdomen was ‘blown up’ and mentioned no longer being able to pass flatus. He was also sweating and thirsty.
Five years previously he had a prolonged admission following a perforated appendix for which he had his appendix removed and an associated abscess drained. He had remained well ever since, took no medications and had no allergies.
Examination
On examination his pulse was 104/minute, in sinus rhythm. His mucous membranes were dry. His abdomen was distended. He complained of generalized tenderness but there was no rebound or guarding. The bowel sounds were prominent and tympanic. Per rectal exam demonstrated an empty rectum.
His blood results demonstrated normal inflammatory markers. His biochemistry revealed a urea of 8.4 mmol/L but creatinine within the normal range.
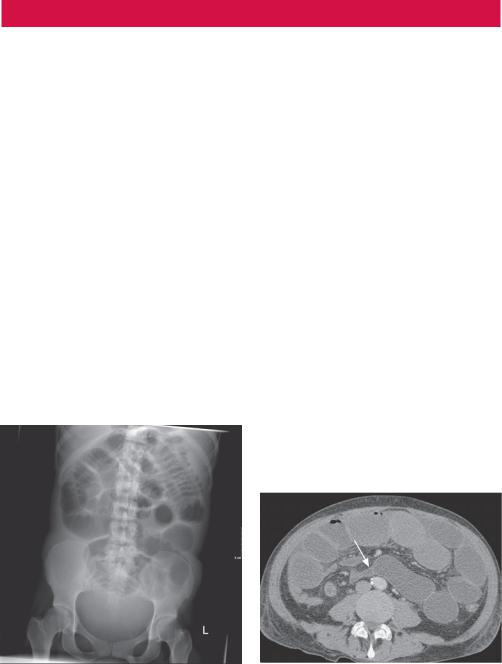
An erect chest radiograph was performed which did not demonstrate any free subdiaphragmatic gas, but the abdominal radiograph (Figure 58.1) was abnormal. In light of this and following surgical review, a computed tomography (CT) scan was performed (Figure 58.2).
Figure 58.1 Abdominal radiograph. |
Figure 58.2 CT scan. |
Questions
•What abnormality is seen on the plain abdominal radiograph (Figure 58.1)?
•What does the CT show (Figure 58.2)?
•What does the arrow point to?
157

ANSWER 58
The radiograph of the abdomen in Figure 58.1 demonstrates multiple abnormally distended loops of small bowel. No surgical clips are seen. The large bowel is collapsed. It is possible to determine that this is small bowel dilatation, by the central location, calibre and the presence of valvulae conniventes (as opposed to the peripheral location, wider calibre and haustral folds of the large bowel). There is no evidence of pneumoperitoneum to suggest perforation. The axial CT in Figure 58.2 confirms dilated loops of fluid-filled small bowel.
A small bowel obstruction is caused by a variety of pathologic processes but essentially is due to mechanical obstruction to the passage of the bowel contents somewhere in the small bowel. The bowel proximal to the point of obstruction dilates with swallowed air and secreted fluid. Vomiting may release some of the proximal bowel contents and reduce the amount of proximal dilation. Bowel distal to the point of obstruction (i.e. colon and distal small bowel) empties and collapses over time
The leading cause in developed countries is postoperative adhesions (60 per cent). Postoperative adhesions can be the cause of acute obstruction within weeks of surgery or present as chronic obstruction years later as in this case.
The second most common identified cause of small bowel obstruction is an incarcerated groin hernia. Other aetiologies include malignant tumor (20 per cent), other hernias (10 per cent), inflammatory bowel disease (5 per cent), volvulus (3 per cent) and other causes (2 per cent).
Small bowel obstructions can be partial or complete. They may also be simple or strangulated. Strangulated obstructions are surgical emergencies. If not diagnosed and properly treated, vascular compromise can lead to bowel ischaemia, morbidity and mortality.
Plain radiographs are the primary imaging modality with the sensitivity reported as approximately 75 per cent. Assessment should be made for surgical clips (which may suggest adhesions as a cause), the hernial orifices (for incarcerated hernia) or aerobilia/ calcific densities (possible gallstone ileus). Small bowel dilatation greater than 2.5–3 cm (especially if there is evidence of air–fluid levels) indicates small bowel obstruction.
CT scanning is useful in distinguishing extrinsic causes, for example adhesions and hernias, from intrinsic causes, such as neoplasms or Crohn’s disease. A transition point may be identified localizing any focal adhesions, as seen on the axial CT image in Figure 58.2 (arrow), which cannot be appreciated on plain films. The patient in this case probably developed adhesions as a consequence of the surgery for his perforated appendix and abscess drainage.
CT should be considered where the patient has fever, tachycardia and localized abdominal pain with raised inflammatory markers. CT may demonstrate abscesses, inflammatory processes, extraluminal pathology resulting in obstruction, tumours or mesenteric ischaemia. It also allows discrimination between ileus and mechanical small bowel in postoperative patients.
KEY POINTS
•In cases of small bowel obstruction, plain radiographs are the primary imaging modality and assessment should be made for surgical clips (which may suggest adhesions), hernial orifices (for incarcerated hernia) or aerobilia/calcific densities (possible gallstone ileus).
•CT scanning is useful in distinguishing the aetiology and also allows discrimination between ileus and mechanical small bowel in postoperative patients.
158
CASE 59: TORRENTIAL HAEMATEMESIS
History
A 52-year-old man with a history of alcoholism and hepatitis C is admitted to intensive care with torrential haematemesis. He requires the transfusion of 10 units of blood, clotting factor and platelets over 36 hours. Upper gastrointestinal endoscopy reveals large clots seen within the stomach with an associated bleeding point as a result of varices.
Examination
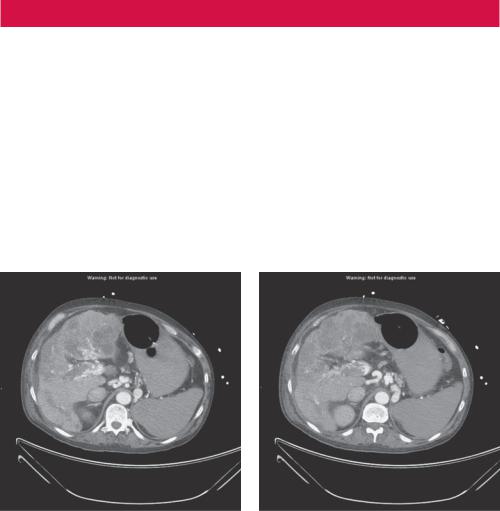
The patient is tachycardic with a pulse rate of 108/minute and tachypnoeic at 22/minute. His blood pressure has been maintained within normal limits with replacement of blood and colloids. Despite best efforts, however, the endoscopist is unable to halt the gastric bleeding and a computed tomography (CT) scan is therefore performed to assess for any potential point of arterial embolization (Figure 59.1a,b).
(a) |
(b) |
Figure 59.1 Two axial contrast-enhanced CT images.
Question
•What abnormalities do the two axial contrast-enhanced CT images in Figure 59.1a,b demonstrate?
159

ANSWER 59
The axial contrast-enhanced CT images in Figure 59.1 are taken at two levels through the upper abdomen and demonstrate the presence of enhancing serpigenous veins adjacent to the stomach consistent with gastric varices as a consequence of liver cirrhosis (irregular liver contour, patchy low attenuation and enhancement) and portal venous thrombosis (filling defect within the portal vein), which are also seen.
Gastric varices are dilated submucosal veins in the stomach, which are most frequently found in patients with portal hypertension and resulting elevated portal venous pressure, which may be a complication of cirrhosis. In this example, the portal vein itself is thrombosed.
Gastric variceal bleeding is often profuse, has a high rate of recurrence and is associated with decreased survival. Bleeding varices represent a potentially life-threatening cause of haematemesis.
In the setting of cirrhosis and portal hypertension, gastric varices are usually associated with oesophageal varices. Isolated gastric varices may also be found in patients with splenic venous thrombosis as blood is shunted via the short gastric veins, which drain the fundus of the stomach flow. For example, this may be a complication of acute pancreatitis or pancreatic malignancy.
Patients with bleeding gastric varices in addition to presenting with haematemesis, may exhibit melaena or frank rectal bleeding. The bleeding may be brisk, and patients may soon develop haemorrhagic shock, with this patient clinically demonstrating features of grade 2 shock.
Gastric varices are seen on CT (Figure 59.1) as characteristically multiple lobulated, serpentine masses. It is possible for varices to present as a polypoid mass in the fundus. They may also be seen on ultrasound of the upper abdomen or on upper gastrointestinal barium series (although they may be obscured by overlying gastric rugae).
On this occasion, no focal bleeding point was identified as suitable for embolization.
KEY POINTS
•CT or ultrasound may demonstrate evidence of liver cirrhosis, portal hypertension and ascites in addition to the varices themselves.
160
CASE 60: AN INCIDENTAL FINDING ON CHEST RADIOGRAPH
History
A previously fit and well 16-year-old boy attends his general practitioner (GP) with a 2-week history of a cough. He noted a small amount of clear sputum but the cough had been generally non-productive and there had been no blood expectorated. He had noted feeling generally feverish. He had been previously fit and well.
Examination
On examination he demonstrates evidence of an upper tract respiratory infection. He was afebrile, with a respiratory rate of 20/minute and a heart rate of 80/minute. On respiratory examination there is equal lung expansion with good air entry bilaterally. Breath sounds were vesicular with no added sounds. Investigations showed a normal white cell count and a slightly elevated C-reactive protein of 20 mg/L. Blood biochemistry was normal. The GP referred him to his local hospital for a chest radiograph (Figures 60.1 and 60.2).
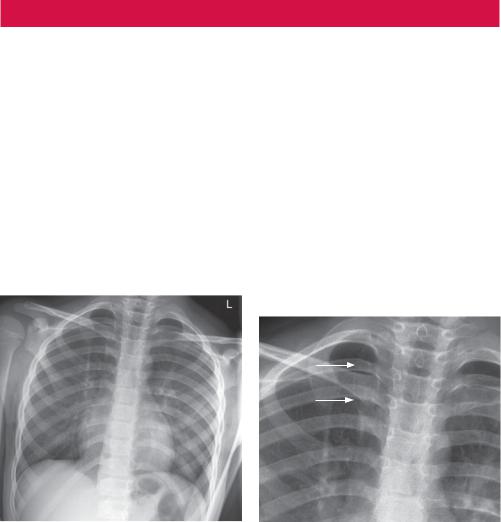
Figure 60.1 Chest radiograph |
Figure 60.2 Chest radiograph |
Questions
•What do you observe about the chest radiograph (Figure 60.1)?
•What do the arrows identify (Figure 60.2)?
•What is the significance of this finding?
161