


20 Part I – High-Fluid Content Liver Lesions
10 Hemangioma III – Typical Giant
Giant hemangiomas are less common than their smaller counterparts. The exact definition of a giant hemangioma is not quite clear. Most reports consider lesions larger than 6 cm as giant hemangiomas, whereas others consider a diameter > 10 cm as the criterion. Giant hemangiomas typically present with symptoms and signs that vary from slight abdominal discomfort to life-threatening spontaneous rupture. Giant hemangioma may compress surrounding vessels and bile ducts.
Literature
1.Danet IM, Semelka RC, Braga L, et al. (2003) Giant hemangioma of the liver: MR imaging characteristics in 24 patients. Magn Reson Imaging 21:95 – 101
2.Terkivatan T, Vrijland WW, Den Hoed PT, De Man RA, Hussain SM, et al. (2002) Size of lesion is not a criterion for resection during management of giant liver haemangioma. Br J Surg 89:1240 – 1244
3.Adam YG, Huvos AG, Fortner JG (1970) Giant hemangiomas of the liver. Ann Surg 172:239 – 245
MR Imaging Findings
At MR imaging, giant hemangiomas appear as large lesions with well-defined margins and predominantly high signal on T2-weight- ed sequences, low signal on T1-weighted sequences, and irregular peripheral (somewhat nodular or flame-like) enhancement during the arterial and portal phase of dynamic gadolinium-enhanced imaging. Usually one or more central scars may be present which are even brighter than the remainder of the lesions. The lesions often show persistent enhancement with unenhanced central scar (even after 5 – 10 min after injection of gadolinium). Central scar consists of myxoid tissue with poor cellularity and vascularity. Some lesions may contain areas with thrombus or fibrosis with lower signal on T2-weighted sequences and somewhat heterogeneous enhancement (Figs. 10.1 – 10.3).
Differential Diagnosis
For typical giant hemangiomas with (1) large size (> 6 cm); (2) high signal on T2 and a brighter central scar; (3) discontinuous peripheral enhancement with progressive enlargement and coalescence of the enhancing parts, and (4) persistent enhancement in the delayed phase with well-defined margin, there is no differential diagnosis. Giant hemangiomas, though, may have some overlapping features with other primary liver lesions with a central scar and secondary liver lesions that may replace the entire liver parenchyma such as diffuse ovarian carcinoma metastases. On CT, giant hemangioma may have similarities with hepatocellular carcinoma in a non-cir- rhotic liver.
Management
Typical giant hemangiomas without any symptoms do not need any treatment, and follow-up depends on clinical history and imaging findings. For management of symptomatic lesions, see the next case.
10 Hemangioma III – Typical Giant 21
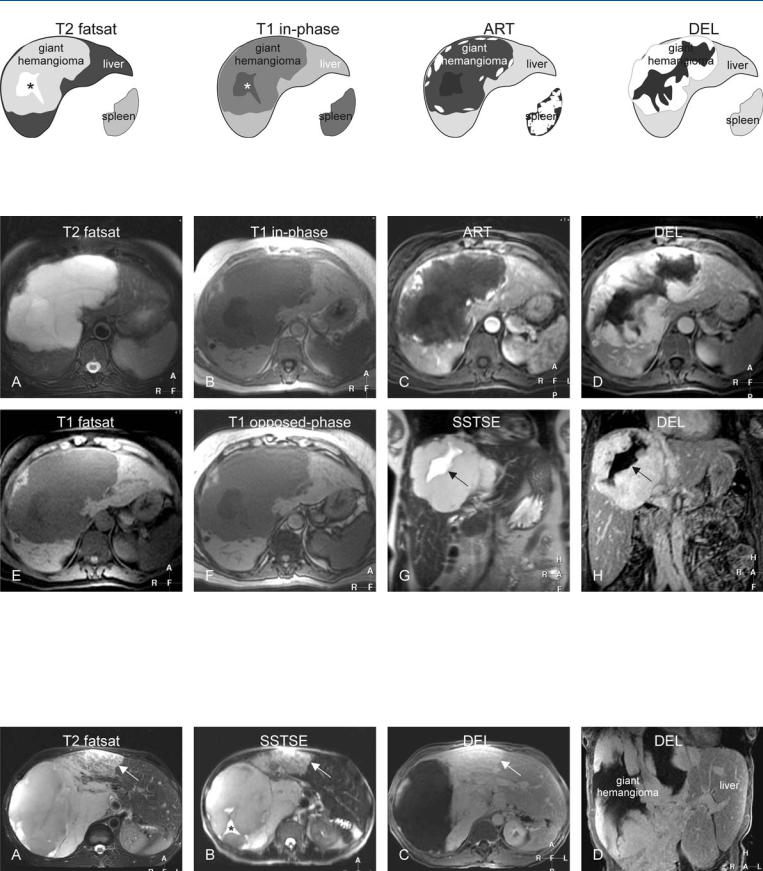
Fig. 10.1. Hemangioma, giant with a mid-size central scar, drawings. T2 fatsat: giant hemangioma is hyperintense to the liver with a brighter central scar (*); T1 in-phase: hemangioma is hypointense to the liver with a more darker
Fig. 10.2. Hemangioma, giant with a mid-size central scar, typical MRI findings. A Axial TSE image (T2 fatsat): Giant hemangioma is lobulated and hyperintense to the liver with a brighter central scar. B Axial in-phase image (T1 inphase): Hemangioma is hypointense to the liver with a darker central scar. C Axial arterial phase image (ART): Hemangioma shows a peripheral nodular enhancement. D Axial delayed phase image (DEL): Giant hemangioma shows homogeneous persistent enhancement of the entire lesion except the
central scar (*); ART: hemangioma shows a peripheral nodular enhancement; DEL: most of the giant hemangioma becomes enhanced except the central area including the central scar
central part including the central scar. E Axial fat-suppressed T1-w GRE image (T1 fatsat): Hemangioma has sharp margins to the liver. F Axial op- posed-phase image (T1 opposed-phase): No fatty infiltration is present. G Coronal SSTSE image (SSTSE) of the hemangioma with a higher signal central scar (arrow). H Coronal delayed phase image (DEL) shows unenhanced bow-tie-shaped central scar (arrow)
Fig. 10.3. Hemangioma, giant with an atypical feature (another patient). A Axial TSE image (T2 fatsat): Giant hemangioma contains an area that appears heterogeneous (arrow). B Axial SSTSE image (SSTSE): Hemangioma shows a bright eccentric („central“) scar (*). C Axial delayed phase image (DEL):
Most of the lesion shows persistent homogeneous enhancement, including the part heterogeneous at T2 (arrow). D Coronal delayed phase image (DEL): Most of the lesion shows homogeneous persistent enhancement

22 Part I – High-Fluid Content Liver Lesions
11 Hemangioma IV – Giant Type with a Large Central Scar
Giant hemangiomas may show variability in the size of the lesion as well as the size and appearance of the central scar. Long-standing lesions may cause compensatory hypertrophy of the unaffected liver. In addition, giant hemangiomas may displace the liver veins and compress the inferior vena cava. In addition, left-sided lesions may displace and compress the stomach and cause symptoms.
MR Imaging Findings
At MR imaging, giant hemangiomas appear as large lesions with well-defined margins and predominantly high signal on T2-weight- ed sequences, low signal on T1-weighted sequences, and irregular peripheral enhancement during the arterial and portal phase of dynamic gadolinium-enhanced imaging. The size and particularly the T2 appearance of the central scar relative to the remainder of the lesion may vary. The central scar may contain areas with lower signal intensity on T2-weighted sequences (Figs. 11.1, 11.2). The brighter areas with the central scar most likely correspond to the myxoid tissue and the darker areas suggest the presence of fibrosis. In some cases, the central scar may even be larger than the periphery of the lesion. This suggests that the central scar may have been formed within the central vascular channels of the lesion after myxoid changes that eventually change into fibrosis. Despite this variability on T2-weighted images, the enhancement pattern should be quite characteristic on the dynamic gadolinium-enhanced images (Fig. 11.3). Lack of this enhancement pattern in combination with the absence of well-defined margins of the lesion and central scar should raise doubts about the benign nature of the lesion. Patients with such lesions should have a follow-up examination at 3 – 6 months or a biopsy.
Pathology
At pathology, giant hemangiomas essentially do not differ from smaller hemangiomas. However, giant hemangiomas may have (areas with) more thrombus and fibrosis. Central scar consists of myxoid tissue with poor cellularity and vascularity.
Management
Symptomatic giant hemangiomas may be treated surgically, especially causing inflammatory syndrome or Kassabach-Merritt syndrome (disseminated intravascular coagulopathy). In this respect, size of the lesion is often not a criterion for resection.
Literature
1.Valls C, Renee M, Gill M, et al. (1996) Giant hemangioma of the liver: atypical CT and MR findings. Eur Radiol 6:448 – 470
2.Mendez Romero A, Wunderink W, Hussain SM, et al. (2006) Stereotactic body radiation therapy for primary and metastatic liver tumors: A single institution phase I–II study. Acta Oncol 45:831 – 837
3.van Gorcum M, van Buuren HR, Hussain SM, et al. (2005) Fever as a sign of inflammatory syndrome in a female patient with hepatic hemangioma. Ned Tijdschr Geneeskd 149:1227 – 1230
11 Hemangioma IV – Giant Type with a Large Central Scar 23
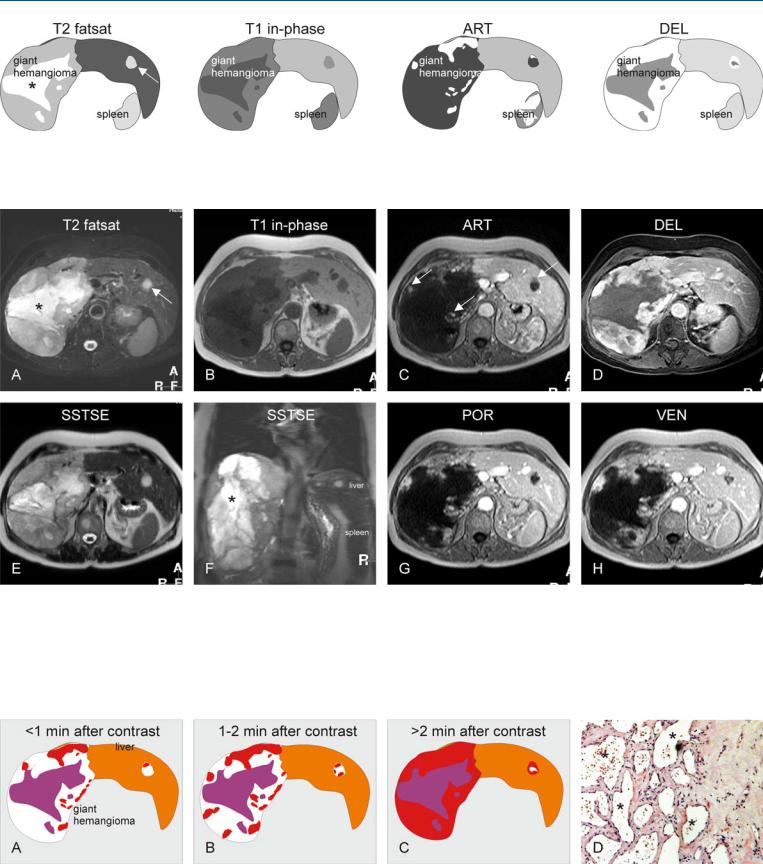
Fig. 11.1. Hemangioma, giant, drawings. T2 fatsat: giant hemangioma is hyperintense to the liver with a brighter central scar (*); note also a smaller additional hemangioma (arrow); T1 in-phase: hemangiomas are hypointense
Fig. 11.2. Hemangioma, giant type, typical MRI findings. A Axial fat-suppressed T2-w TSE image (T2 fatsat): Giant hemangioma is lobulated and hyperintense to the liver with a brighter central scar (*). Note also a smaller hemangioma (arrow) with compensatory liver hypertrophy. B Axial T1-w image (T1 in-phase): Hemangioma is hypointense to the liver with a darker central scar. C Axial arterial phase image (ART): Hemangiomas show peripheral nodular enhancement (arrows). D Axial delayed phase image (DEL): Giant
to the liver; ART: hemangiomas show a peripheral nodular enhancement; DEL: most of the giant hemangioma becomes enhanced except for the central scar. Smaller hemangioma is almost completely enhanced
hemangioma shows persistent homogeneous enhancement except for the central scar. E Axial SSTSE image with a TE of 120 ms (SSTSE): Hemangioma retains its high signal. F Coronal SSTSE image (SSTSE): Giant hemangioma occupies the entire right liver with a large central scar (*). G Axial portal phase image (POR): Peripheral nodular enhancement has increased. H Axial venous phase image (VEN) shows further progression of the enhancement
Fig. 11.3. Giant hemangioma, enhancement pattern and histology. A Within the first minute after injection of gadolinium, peripheral nodules appear. B Between 1 and 2 min, the nodules become larger and coalesce. C More than
2 min after contrast most of the hemangioma will be enhanced. D Photomicrograph shows the vascular spaces (*) that are gradually filled with contrast medium during dynamic examination. H&E, × 100

24 Part I – High-Fluid Content Liver Lesions
12Hemangioma V – Atypical, Flash-Filling with Perilesional Enhancement
Hemangiomas can show a spectrum of atypical findings at imaging including: (1) unusual appearance (echogenic or hypoechoic border) at US mimicking metastases; (2) heterogeneous appearance, for instance due to hemorrhage or calcification; (3) hyalinization of particularly small lesions may cause low signal on T2-weighted images and atypical enhancement pattern at CT and MR imaging; and
(4) rapidly enhancing lesions with or without perilesional enhancement or shunting. Rapid enhancement can be seen in a subset of (usually small) hemangiomas. Such lesions may be more of a diagnostic issue at CT than MR imaging.
Literature
1.Vilgrain V, Boulos L, Vullierme MP, et al. (2000) Imaging of atypical hemangiomas of the liver with pathologic correlation. Radiographics 20:379 – 397
2.Outwater EK, Ito K, Siegelman E, et al. (1997) Rapidly enhancing hepatic hemangiomas at MRI: distinction from malignancies with T2-weighted images. JMRI 7:1033 – 1039
3.Jeong MG, Yu JS, Kim KW (2000) Hepatic cavernous hemangioma: temporal peritumoral enhancement during multiphasic dynamic MR imaging. Radiology 216:692 – 697
MR Imaging Findings
At MR imaging, rapidly enhancing (or flash-filling) hemangiomas show a rapid and diffuse enhancement of the entire lesion with perilesional enhancement or shunting in a majority of the cases in the arterial phase, although the appearance in the delayed phase (with persistent enhancement of the entire lesion) as well as the signal intensity characteristics remain similar to those of the classical type with peripheral nodular enhancement. Flash-filling hemangiomas show low signal intensity on T1-weighted sequences and high signal intensity on T2-weighted sequences with well-defined margins; the lesions retain their high signal on T2-weighted sequences with longer TE (Figs. 12.1, 12.2). Ultrasound and especially (multiphasic) CT are often inconclusive (Fig. 12.3).
Differential Diagnosis
Hypervascular metastases form the most important differential diagnostic problem in the clinical setting. The T2 characteristics in combination with the delayed phase images facilitate the differentiation from hypervascular metastases, which lose their signal on T2-weighted sequences with longer TE and almost invariably show washout of contrast on delayed phase images. In addition, compared to rapidly enhancing hemangiomas, hypervascular metastases show less intense arterial enhancement.
Management
Atypical flash-filling hemangiomas should have a follow-up examination in 3 – 6 months to confirm the diagnosis, particularly in patients with underlying malignancies. Other, less desirable possibilities may include ultrasound-guided biopsy.
12 Hemangioma V – Atypical, Flash-Filling with Perilesional Enhancement 25
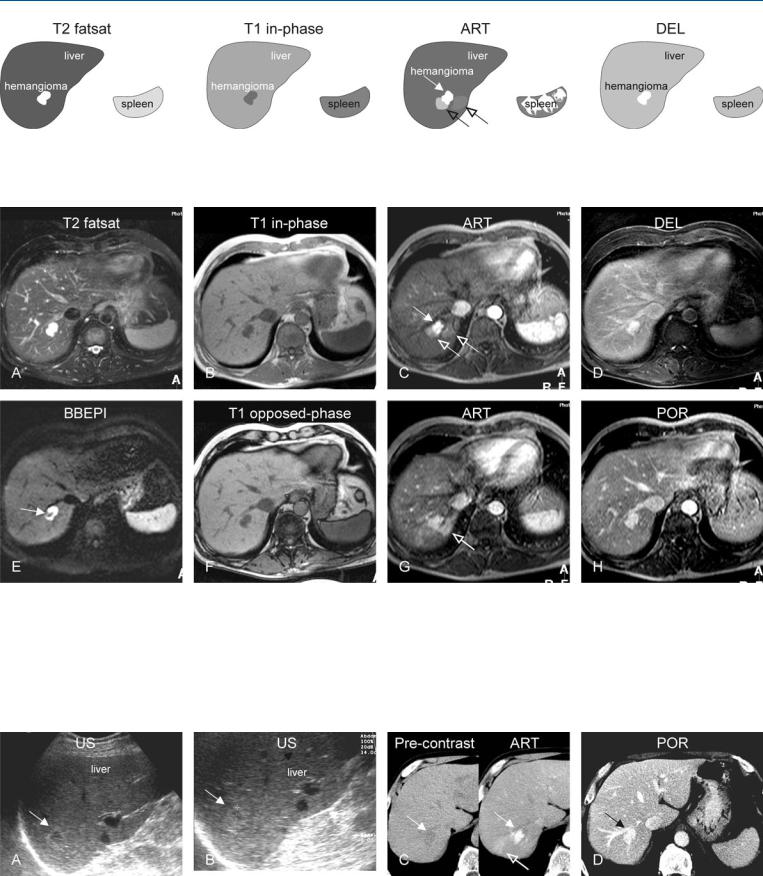
Fig. 12.1. Hemangioma, flash-filling with perilesional enhancement, drawings.
T2 fatsat: hemangioma is markedly hyperintense to the liver; T1 in-phase: hemangioma is hypointense to the liver; ART: hemangioma shows intense
Fig. 12.2. Hemangioma, flash-filling with perilesional enhancement, MRI findings. A Axial fat-suppressed T2-w TSE image (T2 fatsat): Hemangioma is lobulated with high signal intensity to the liver. B Axial in-phase T1-w GRE (T1 in-phase): Hemangioma is hypointense to the liver. C Axial early arterial phase GRE image (ART): Hemangioma shows intense homogeneous enhancement in large part (solid arrow) and faint perilesional enhancement (open arrows). D Axial delayed phase GRE image (DEL): hemangioma shows homogeneous enhancement of the entire lesion. E Axial black-blood echo-
homogeneous enhancement in large part (solid arrow) with faint perilesional enhancement (open arrows); DEL: hemangioma becomes homogeneously enhanced and retains its contrast
planar imaging (BBEPI) with flow sensitive diffusion gradients shows signal void within hemangioma indicating presence of high flow (arrow). F Axial opposed-phase image (T1 opposed-phase): Hemangioma has a low signal compared to the liver. G Axial late arterial phase GRE image (ART) shows increase in perilesional enhancement (open arrow). H Axial portal phase GRE image (DEL): The increased perilesional enhancement is no longer present and the liver has become homogeneous
Fig. 12.3. Hemangioma, US and triphasic CT in a patient known to have lung carcinoma. A, B US was performed because of abnormal liver function tests and showed a lesion (arrow). C Subsequent triphasic CT: CT before contrast shows a hypodense lesion (arrow) with early arterial enhancement as well as
perilesional enhancement in the arterial phase (open arrow). D CT in the portal phase shows homogeneous persistent enhancement of the lesion. CT findings were inconclusive; therefore MRI was advised (shown above)