


190 Part IV – Vascular Liver Lesions
89 Budd-Chiari Syndrome II – Gradual Deformation of the Liver
The natural history of Budd-Chiari syndrome (BCS) is poorly understood as most patients have received some form of treatment. On anticoagulation alone, some patients with an acute presentation may recover spontaneously, at least partially, as judged from improved liver function tests, disappearance or easy control of ascites, and improvement of the appearance of the liver at imaging. However, aggravation may occur unpredictably in the form of ascites becoming refractory, wasting, recurrent gastrointestinal bleeding, or development of liver failure. The risk for aggravation and death generally has been described as highest within the first 1 – 2 years after diagnosis, whereas patients surviving beyond 2 years have an excellent 10-year survival rate. The extent of fibrosis, congestion, or necrosis is associated with a poor outcome and indicates severity of the disease. Due to the persistent chronic and superimposed acute changes, the liver may show complex findings at imaging. Eventually, these changes may be reflected in the peculiar morphology of the liver that is often observed in patients with longstanding BCS.
Literature
1.Valla DC (2003) The diagnosis and management of the Budd-Chiari syndrome: consensus and controversies. Hepatology 38:793 – 803
2.Menon KV, Shah V, Karnath PS (2004) The Budd Chiari syndrome. NEJM 350:578 – 85
3.Noone TC, Semelka RC, Siegelman ES, Balci NC, Hussain SM, Mitchell DG (2000) Budd Chiari syndrome: spectrum of appearance of acute, subacute, and chronic magnetic resonance imaging. JMRI 11:44 – 50
MR Imaging Findings
At MR imaging, acute, subacute, and chronic changes may be seen concurrently. In acute BCS, T1-weighted imaging reveals decreased signal intensity within the liver periphery and preservation of more normal, higher signal intensity within the caudate lobe. On T2-weighted images, the liver periphery is heterogeneously increased in signal intensity, and the caudate lobe is more homogeneous, and of normal, lower signal intensity. Dynamic post-gado- linium imaging reveals increased enhancement within the caudate lobe on the immediate post-gadolinium images, which persists on delayed images. Caudate lobe may be enlarged. In subacute and chronic BCS, caudate lobe may show further increase in size with preserved signal intensity (Figs. 89.1, 89.2). Over time, gradual deformation of the liver often occurs (Fig. 89.3).
Differential Diagnosis
Similar morphologic changes of the liver with underlying fibrosis and cirrhosis with the development of (regenerative) nodules may result from other etiologies.
Management
See next chapter.
89 Budd-Chiari Syndrome II – Gradual Deformation of the Liver 191
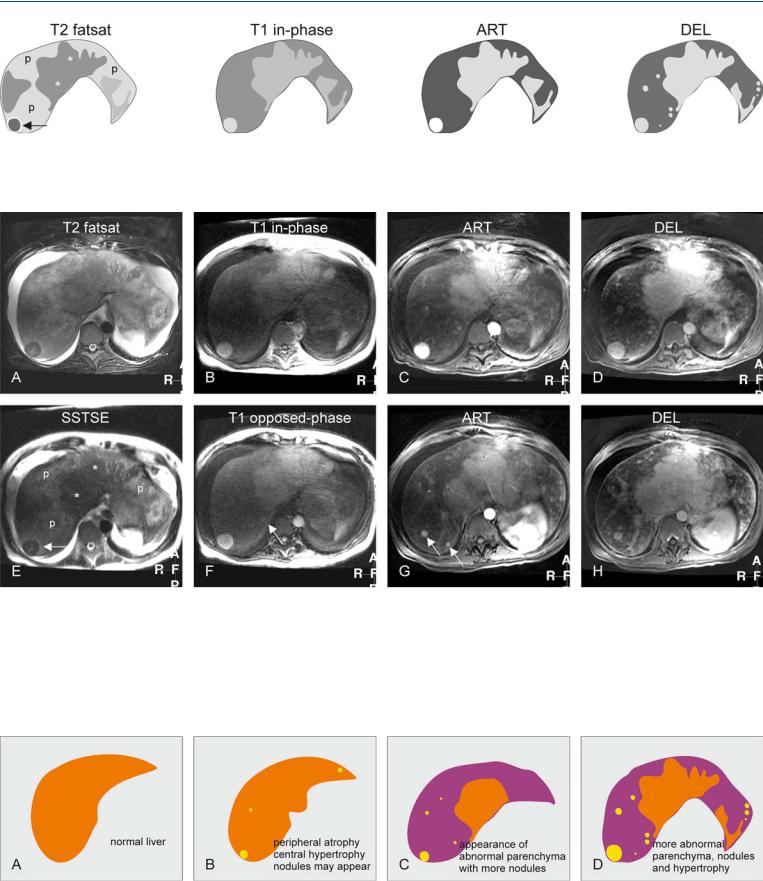
Fig. 89.1. Budd-Chiari syndrome, drawings. T2 fatsat: The liver (with abnormal shape) shows peripheral atrophy (p) with heterogeneous signal, central hypertrophy (*), and a dark nodule (arrow); T1 in-phase: the nodule is bright,
Fig. 89.2. Budd-Chiari syndrome, MRI findings. A Axial fat-saturated TSE image (T2 fatsat): The liver shows central hypertrophy and a nodule with lower signal, and peripheral atrophy with abnormally high signal. Note the ascites. B Axial in-phase image (T1 in-phase): The central part and the nodule show almost normal signal. C Axial arterial phase GRE image (ART): The nodule shows intense homogeneous enhancement. D Axial delayed phase GRE image (DEL): The enhanced structures show no washout of contrast indicating their benign nature. E Axial SSTSE (SSTSE): The liver shows central
comparable to the central liver; ART: the nodule shows increased enhancement; DEL: the central liver and several nodules remain homogeneously enhanced without any washout
hypertrophy with lower signal (*) and peripheral atrophy with abnormally high signal (p). Note that the nodule (arrow) is similar in signal to the central liver. F Axial opposed-phase image (T1 opposed-phase): An additional smaller nodule is visible (arrow). G Axial arterial phase image at a lower level (ART): More enhancing areas and nodules are visible (arrows). H Axial delayed phase image at a lower level (DEL): The enhanced nodules and areas retain their contrast
Fig. 89.3. Budd-Chiari syndrome, changing liver morphology. A Drawing illustrates a normal liver. B Drawing shows the early changes of Budd-Chiari with peripheral atrophy and central (mainly segment I and a part of segments VI and VII) hypertrophy. Nodules may also appear. C Drawing illus-
trates progressive changes most likely due to persistent vascular abnormalities. D Drawing illustrates further hypertrophy, increased abnormal parenchyma and appearance of more (regenerative) nodules

192 Part IV – Vascular Liver Lesions
90 Budd-Chiari Syndrome III – Nodules Mimicking Malignancy
Hepatocellular carcinoma (HCC) has been described occasionally in patients with Budd-Chiari syndrome, mostly in those with longstanding obstruction of the IVC. Differential diagnosis of regenerative nodules from HCC at imaging is almost impossible at US and CT. Therefore, MR imaging should be performed including T2-weighted and dynamic contrast-enhanced sequences to distinguish Budd-Chiari nodules from HCC.
MR Imaging Findings
The nodules are isointense to the liver on T1and T2-weighted images and show homogeneous intense arterial enhancement with fading to isointensity on later phases (Figs. 90.1, 90.2). Unlike multifocal HCC, the lesions do not have high signal on T2 or show washout or capsular enhancement on the delayed phase images.
Literature
1.Brancatelli G, Federle MP, Grazioli L, et al. (2002) Benign regenerative nodules in Budd Chiari syndrome and other vascular disorders of the liver: radiologic-pathologic and clinical correlation. Radiographics 22:847 – 62
2.Klein AS, Molmenti EP (2003) Surgical treatment of Budd-Chiari syndrome. Liver Transpl 9:891 – 896
3.Wanless IR (1994) Regenerative nodules in Budd-Chiari syndrome. Hepatology 19:1391
4.Ibarrola C, Castellano VM, Colina F (2004) Focal hyperplastic hepatocellular nodules in hepatic venous outflow obstruction: a clinicopathological study of four patients and 24 nodules. Histopathology 44:172 – 179
Differential Diagnosis
Budd-Chiari nodules are currently considered as nodular parenchymal hyperplasia likely caused by local circulatory disturbances; histologically, nodules show similarities with focal nodular hyperplasia, regenerative nodules and hepatocellular adenoma. BuddChiari nodules may easily be recognized based on their appearance in the presence of multiple intrahepatic collaterals and typical hepatic morphologic changes (Fig. 90.3).
Management of Budd-Chiari syndrome
TIPS and liver transplantation (LTX) are recognized methods of treatment. TIPS is recommended in patients with preserved hepatic function and architecture. In the presence of fulminant forms, cirrhosis, or defined hepatic metabolic defects (e.g., protein C or protein S deficiency), LTX is the treatment of choice. In most cases of BCS, a thrombophilic disorder can be identified. However, it is important to note that postoperative vascular thrombosis has been identified in patients with BCS who do not have a definable hypercoagulable predisposition. Therefore, initiate intravenous heparin therapy in all patients with BCS immediately after surgery, and continue lifelong anticoagulation with coumadin.
90 Budd-Chiari Syndrome III – Nodules Mimicking Malignancy 193
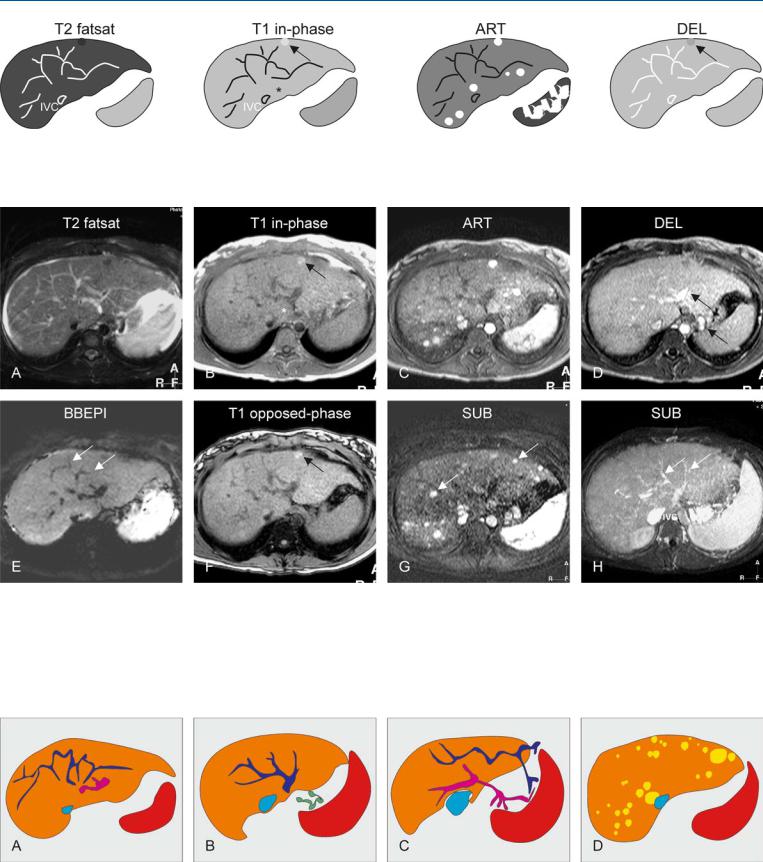
Fig. 90.1. Budd-Chiari syndrome, drawings. T2 fatsat: multiple intrahepatic collaterals are visible that make no connection to the inferior vena cava (IVC); T1 in-phase: note slight hypertrophy of the left liver including seg-
Fig. 90.2. Budd-Chiari syndrome with nodules, MRI findings. A Axial fat-saturat- ed T2-w TSE image (T2 fatsat): The liver shows increased signal with multiple abnormal vessels (collaterals) and ascites. B Axial in-phase GRE image (T1 in-phase): Note a bright nodule (arrow), and the slight hypertrophy of the left liver and segment I (*). C Axial arterial phase post-Gd GRE image (ART): Multiple nodules show intense homogeneous enhancement throughout the liver. D Axial delayed phase GRE image (DEL): All nodules,
ment I (*) as well as a bright nodule (arrow); ART: multiple nodules show intense homogeneous enhancement; DEL: the nodules fade to isointensity, except the nodule visible before contrast (arrow)
except the one visible before contrast, fade to isointensity. Note the enhanced intraand extrahepatic collaterals (arrows). E Axial T2-w blackblood echoplanar image (BBEPI): The intrahepatic collaterals show signal void indicating flow (arrows). F Axial opposed-phase image (T1 opposedphase): The nodule contains no fat (arrow). G A subtraction of the arterial phase (SUB) shows the enhanced nodules (arrows). H A subtraction of the venous phase (SUB) shows the intrahepatic collaterals (arrows)
Fig. 90.3. Budd-Chiari syndrome, a spectrum of findings. A Drawing illustrates abnormal intrahepatic venous (dark blue) and portal (pink) vessels. B Drawing at a different level shows venous (dark blue) collaterals that make no connection to the inferior vena cava (light blue). Note also the extrahepatic
collaterals (green). C Drawing shows that the intrahepatic vessels connect to extrahepatic vessels to facilitate drainage and to lower the portal pressure. D Multiple Budd-Chiari nodules (most likely a form of regenerative nodules)

194 Part IV – Vascular Liver Lesions
91Hereditary Hemorrhagic Telangiectasia or Rendu-Osler-Weber Disease
Hereditary hemorrhagic telangiectasia (HHT) is an autosomal dominant disorder characterized by angiodysplastic lesions [telangiectases and arteriovenous (AV) malformations] that affect many organs. Liver involvement in patients with this disease has not been fully characterized and may occur in up to 30 %. However, a few patients with liver abnormalities may be symptomatic with high-out- put heart failure (elevated cardiac output and an elevated pulmo- nary-capillary wedge pressure), portal hypertension (elevated hepatic sinusoidal pressure, gastroesophageal varices, with or without ascites), and biliary disease. The liver has a unique vascular supply. Blood enters the liver from two sources, the portal vein and the hepatic artery, merging at the level of the hepatic sinusoids and exiting through the hepatic veins. In patients with HHT, liver involvement predominantly results in shunting from the hepatic artery to the hepatic veins. Patients may eventually develop cirrhosis. The biliary tree obtains its blood supply from the peribiliary plexus that arises from the hepatic artery. AV shunts may cause hypoperfusion of the peribiliary plexus and ischemic necrosis of bile ducts, or both, with the subsequent development of a biliary stricture.
Literature
1.Garcia-Tsao G, Korzenik JR, Young L, et al. (2000) Liver disease in patients with hereditary hemorrhagic telangiectasia. NEJM 343:931 – 936
2.Stabile Ianora AA, Memeo M, Sabba C, et al. (2004) Hereditary hemorrhagic telangiectasia: MDCT assessment of hepatic involvement. Radiology 230:250 – 259
3.Chavan A, Caselitz M, Gratz KF, et al. (2004) Hepatic artery embolization for treatment of patients with HHT and symptomatic hepatic vascular malformations. Eur Radiol 14:2079 – 2085
MR Imaging Findings
At MR imaging, saccular dilatations of the intrahepatic bile ducts can be evaluated using magnetic resonance cholangiopancreatography (MRCP).
Typical telangiectases and AV malformations are particularly visible on the dynamic contrast-enhanced images as numerous curvilinear subcapsular and parenchymal vessels which form connections between the arteries and the veins (Figs. 91.1, 91.2). Some of these vessels may be large. US can show abnormal vessels. CT and particularly digital subtraction angiography (DSA) can be used to visualize the hepatic abnormalities including the AV shunts (Fig. 91.3).
Differential Diagnosis
Saccular dilatations and stenoses of the bile ducts may mimic Caroli’s disease and primary sclerosing cholangitis.
Management
Liver biopsy should be avoided because it is risky and does not contribute to the management. Hepatic artery embolization or ligation has been performed and may relieve some symptoms but it may also cause hepatic or biliary necrosis, or both, and should therefore be used only under special circumstances. Liver transplantation has been performed by some with good results.
91 Hereditary Hemorrhagic Telangiectasia or Rendu-Osler-Weber Disease 195
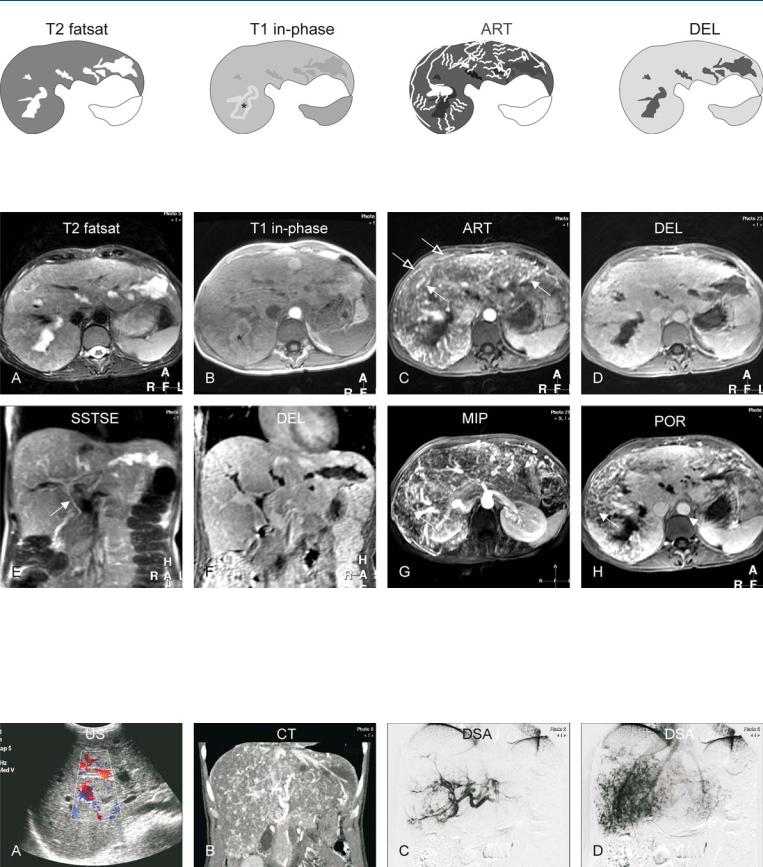
Fig. 91.1. Hereditary hemorrhagic teleangiectasia (HHT) of the liver, drawings.
T2 fatsat: saccular dilatations of the intrahepatic bile ducts are present; T1 in-phase: dilated ducts (*) with high signal indicate cholestasis; ART: mul-
Fig. 91.2. Hereditary hemorrhagic teleangiectasia (HHT; also called Rendu-Osler- Weber disease) of the liver, MRI findings. A Axial TSE image (T2 fatsat): irregular and saccular dilatations of the intrahepatic bile ducts are most likely caused by ischemia. B Axial in-phase image (T1 in-phase): one of the dilated ducts shows high signal due to cholestasis (*). C Axial arterial phase image (ART): Multiple intrahepatic (solid arrow) and subcapsular (open arrows) angioplastic lesions, including arteriovenous malformations and angiecta-
tiple intrahepatic and subcapsular angioplastic lesions, including arteriovenous malformations and angiectasia, are enhanced; DEL: the liver shows homogeneous enhancement
sia, are enhanced. D Axial delayed phase image (DEL): The liver shows homogeneous enhancement. E Coronal SSTSE image (SSTSE): The common bile duct is normal (arrow). F Coronal delayed phase image (DEL): Unenhanced bile ducts correlate well with the previous image. G MIP of the arterial phase shows an overview of the vascular abnormalities. H Axial portal phase image (POR) shows large areas of the liver with incomplete enhancement due to shunting
Fig. 91.3. Hereditary hemorrhagic teleangiectasia (HHT; also called Rendu-Osler- Weber disease) of the liver, US, CT, and DSA correlation. A US showed non-spe- cific dilated bile ducts and increased color Doppler signal. B CT (coronal reformat) shows patchy enhancement of the vascular abnormalities. C Digital
subtraction angiography (DSA) in the early phase shows the angiectasia. D DSA in the later phase shows patchy enhancement caused by numerous arteriovenous shunts


Part V
Biliary Tree Abnormalities |
V |