


184 Part IV – Vascular Liver Lesions
86Arterioportal Shunt I – Early Enhancing Lesion in a Cirrhotic Liver
Cirrhotic livers may contain various types of enhancing lesions and pseudolesions. In clinical practice with cirrhotic patients, however, we have sometimes encountered small nodular early enhancing hepatic lesions on arterial phase contrast-enhanced dynamic computed tomography (CT) or MRI that resembled hepatocellular carcinomas but disappeared or decreased in size during the clinical follow-up examinations. These lesions are considered to be nonneoplastic hypervascular pseudolesions caused by small arterioportal or other shunts including unknown causes and are often difficult to differentiate from hypervascular hepatocellular carcinomas (HCCs). Some reports indicate that single-level dynamic CT during hepatic arteriography and less invasive contrast-enhanced dynamic MRI with higher temporal resolution from early to late arterial phase may be helpful for differentiating the early enhancing lesions from HCC.
Literature
1.Ito K, Fujita T, Shimizu A, et al. (2004) Multiarterial phase dynamic MRI of small early enhancing hepatic lesions in cirrhosis or chronic hepatitis: differentiating between hypervascular hepatocellular carcinomas and pseudolesions AJR 183:699 – 705
2.Van den Bos IC, Hussain SM, Terkivatan T, et al. (2006) Step-wise carcinogenesis of hepatocellular carcinoma in the cirrhotic liver: demonstration on serial MR imaging. JMRI (in press)
3.Yu JS, Kim KW, Jeong MG, Lee JT, Yoo HS (2000) Nontumorous hepatic arterial-portal venous shunts: MR imaging findings. Radiology 217: 750 – 756
4.Ueda K, Matsui O, Kawamori Y, et al. (1998) Differentiation of hypervascular hepatic pseudolesions from hepatocellular carcinoma: value of single level dynamic CT during hepatic arteriography. JCAT 22:703 – 708
MR Imaging Findings
At MR imaging, the early enhancing lesions are typically small (a few millimeters) and visible in the arterial phase of the dynamic gadolinium-enhanced imaging, fading to isointensity in the delayed phase in most cases. On the maximum-intensity projection images, an enhanced arterial vessel may be seen coursing toward the area of an arterioportal shunt (Figs. 86.1 – 81.3A, B). Although delayed persistent enhancement has been described in the literature, any heterogeneity and signal abnormality on T2-weighted images as well as chemical shift imaging should be considered suspicious and warranting follow-up (Fig. 86.3C, D).
Differential Diagnosis
Dysplastic nodules and small HCCs may be distinguished from arterioportal shunt and pseudolesions (i.e., areas with non-specific transient increased enhancement) based on the appearance on the delayed phase as well as findings on other sequences. In ambiguous cases, follow-up MR imaging may facilitate distinction.
86 Arterioportal Shunt I – Early Enhancing Lesion in a Cirrhotic Liver 185
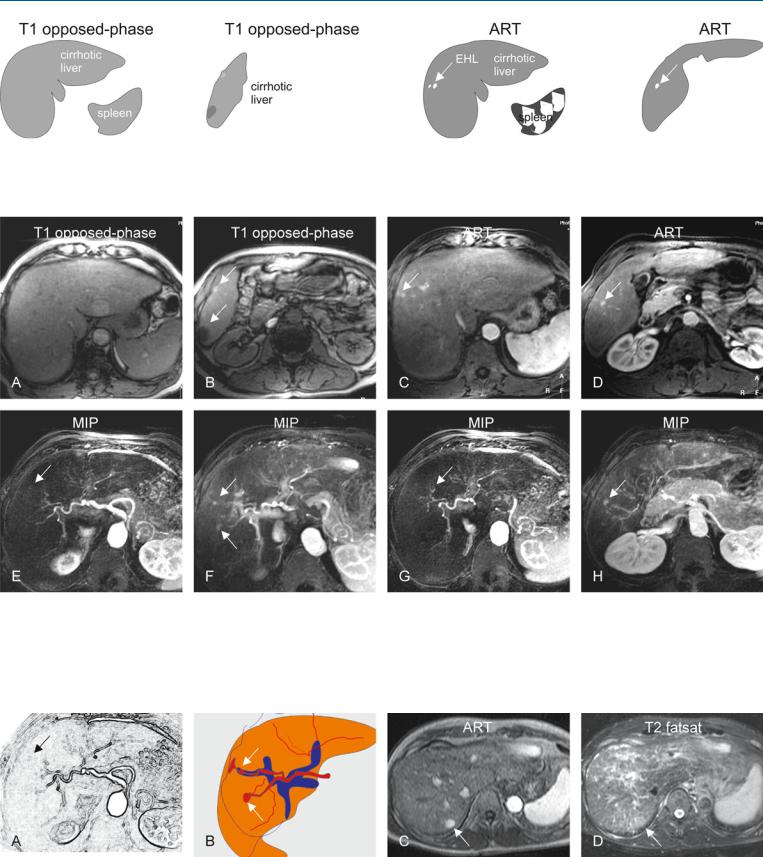
Fig. 86.1. Early enhancing lesion (EHL) in a cirrhotic liver, drawings. T1 opposedphase: The liver shows morphologic signs of cirrhosis with enlarged spleen; T1 opposed-phase: (lower anatomic level) The liver shows signs of cirrhosis;
Fig. 86.2. Early enhancing lesion (EHL) in a cirrhotic liver, MRI findings. A Axial opposed-phase image (T1 opposed-phase): The liver shows several nodules and morphology of cirrhosis. B Axial opposed-phase image (T1 opposedphase) at a lower anatomic level: The liver contains several nodules with variable signal intensity (arrows). C Axial arterial phase image (ART) shows the intensely enhancing EHLs (arrow). D Axial arterial phase image (ART) at a
ART: at least two EHL’s (arrow) are visible; ART: another EHL is visible at a lower anatomic level (arrow). (Follow-up MRI did not show any change or other signs of malignancy)
lower anatomic level shows another EHL (arrow). E–H Maximum intensity projections (MIPs) based on the subtractions of the arterial and portal phases show several EHLs (arrows) with suggestion of arterioportal shunts. (Follow-up MR imaging during several months did not show any change or signs of malignancy)
Fig. 86.3. EHLs in a cirrhotic liver, drawings (A, B); C, D show dysplastic nodule in another patient. A, B Drawings show the connection between the arteries and portal veins, suggesting arterioportal shunts. C Axial arterial phase (ART)
and D turbo spin echo (TSE) (T2 fatsat) images show an enhancing area (arrow) that is faintly hyperintense to the liver on the T2-weighted image (arrow). At follow-up MRI, this area developed into an HCC

186 Part IV – Vascular Liver Lesions
87Arterioportal Shunt II – Early Enhancing Lesion in a Non-Cirrhotic Liver
According to some authors, arterioportal (A-P) shunt is commonly associated with hepatocellular carcinoma and intrahepatic cholangiocarcinomas. However, congenital or acquired A-P shunt without any associated hepatic tumor may occur and cause difficulty in diagnosis on ultrasound (US) and CT. Particularly, on CT images the enhancing area of the liver may mimic a lesion. State-of-the-art MR imaging of the liver combines the information concerning the vascularity and soft tissue characteristics of the lesions, and can make a more confident diagnosis.
Literature
1.Routh WD, Keller FS, Cain WS, et al. (1992) Transcatheter embolization of a high-flow congenital intrahepatic arterial-portal venous malformation in an infant. J Pediatr Surg 27:511 – 514
2.Kitade M, Yoshiji H, Yarnao J, et al. (2005) Intrahepatic cholangiocarcinoma associated with central calcification and arterioportal shunt. Intern Med 44:825 – 828
MR Imaging Findings
At MR imaging, A-P shunt is not visible on the T2-weighted and inphase T1-weighted images. In a fatty liver, however, the area with the shunt may show fatty sparing on the opposed-phase images. After injection of gadolinium, the shunt may be visible as a small intensely enhancing lesion in the arterial phase, followed by a wedgeshaped enhancement of the surrounding parenchyma. In the delayed phase, the enhancing lesion and area fade to isointensity. In addition, other concurrent benign liver lesions may be seen (Figs. 87.1 – 87.3).
Differential Diagnosis
Any underlying or associated liver tumor such as cholangiocarcinomas or HCCs can be distinguished on MR imaging based on the tissue characteristics and enhancement patterns.
87 Arterioportal Shunt II – Early Enhancing Lesion in a Non-Cirrhotic Liver 187
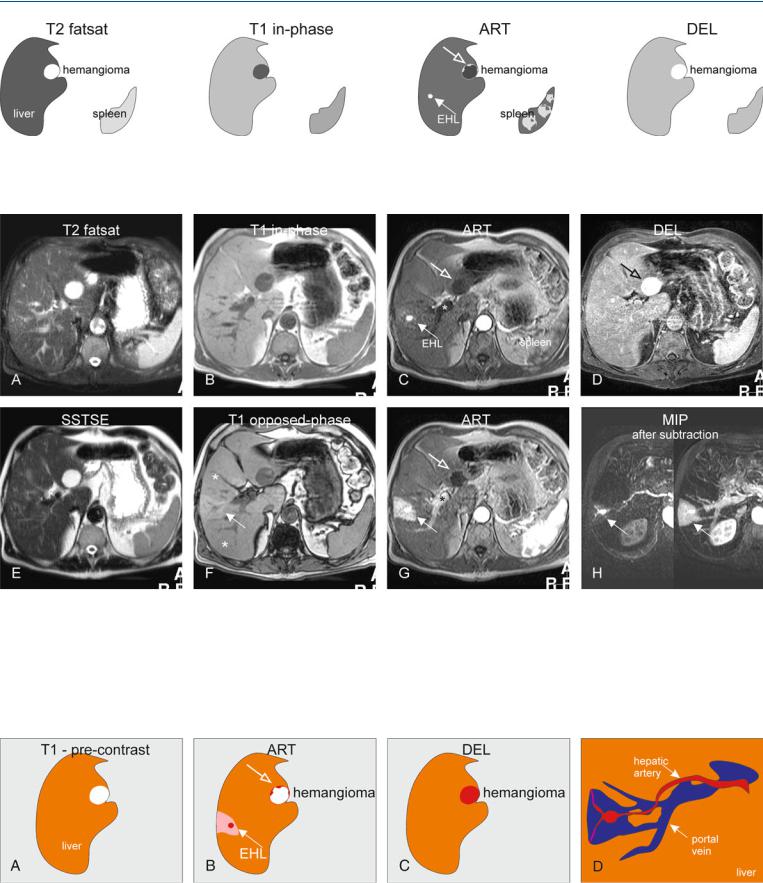
Fig. 87.1. Early enhancing lesion (EHL) and an hemangioma, drawings. T2 fatsat: at the site of EHL, no abnormality is visible; note an incidental bright hemangioma; T1 in-phase: the liver shows normal signal intensity; ART: EHL
Fig. 87.2. Early enhancing lesion (EHL) and an hemangioma, MRI findings. A Axial fat-suppressed T2-w TSE image (T2 fatsat): the liver parenchyma is normal at the site of EHL. Hemangioma is hyperintense to the liver. B Axial inphase GRE (T1 in-phase): The liver shows normal signal. C Axial early arterial phase image (ART) shows the intensely enhancing EHL (arrow) and faint peripheral nodular enhancement within hemangioma (open arrow); note that the portal vein has not yet enhanced (*). D Axial delayed phase image (DEL): EHL has disappeared and hemangioma shows homogeneous en-
(arrow) is visible with faint peripheral nodular enhancement of hemangioma (open arrow); DEL: EHL is no longer visible; hemangioma shows homogeneous enhancement
hancement (open arrow). E Axial single-shot turbo spin echo image (SSTSE): hemangioma remains bright. F Axial opposed-phase image (T1 opposed-phase): Fatty infiltration (*) is present except around the area of the EHL. G Axial late arterial phase image (ART), with enhanced portal vein (*), shows wedge-shaped enhancement of the liver surrounding EHL. H MIP based on the subtractions of the early and late arterial phases strongly suggests an arterioportal shunt (arrows)
Fig. 87.3. EHL caused by arterioportal shunt and hemangioma, drawings. A Before contrast normal liver with an hemangioma is visible. B Arterial phase shows the EHL surrounded by an enhancing wedge-shaped area.
C Delayed phase shows the enhanced hemangioma. D A composite drawing based on the subtraction images shows the connection between the arteries and portal veins, the most likely cause of the EHL (A-P shunt)
188 Part IV – Vascular Liver Lesions
88Budd-Chiari Syndrome I – Abnormal Enhancement and Intrahepatic Collaterals
Budd-Chiari syndrome (BCS) is a rare and potentially lethal condition related to the obstruction of the hepatic venous outflow tract. Women about 35 years of age are the most affected group. Heart failure and sinusoidal obstruction syndrome (formerly known as veno-occlusive disease) also impair hepatic venous outflow and share many features with BCS, but these are separate entities as causes and treatments differ. Thrombosis is the cause of primary BCS. As compared with pure hepatic vein thrombosis, inferior vena cava (IVC) thrombosis is more common in the Far East; it is more indolent and is complicated more commonly by hepatocellular carcinoma. Thus, the recently proposed distinction of primary hepatic vein thrombosis (true BCS) from primary IVC thrombosis (obliterative hepatocavopathy) is well suited for clinical and therapeutic objectives. However, etiologies are similar. In most studies, primary myeloproliferative disorders are found to be the leading cause of BCS. The blood outflow obstruction of the liver may result in liver congestion, portal hypertension, ischemic necrosis caused by sudden interruption of hepatic perfusion followed by fibrosis and liver failure, and ascites. Imaging evaluation of patients with suspected BCS may be critical, since the clinical presentation of this potentially fatal disease is often non-specific. The overall accuracy of US and CT for detecting hepatic venous thrombosis has been reported as approximately 70 % and 50 %, respectively.
Literature
1.Valla DC (2003) The diagnosis and management of the Budd-Chiari syndrome: consensus and controversies. Hepatology 38:793 – 803
2.Menon KV, Shah V, Karnath PS (2004) The Budd Chiari syndrome. NEJM 350:578 – 85
3.Noone TC, Semelka RC, Siegelman ES, Balci NC, Hussain SM, Mitchell DG (2000) Budd Chiari syndrome: spectrum of appearance of acute, subacute, and chronic magnetic resonance imaging. JMRI 11:44 – 50
MR Imaging Findings
Diagnostic percutaneous venography (may show spider web network pattern formed by the intrahepatic collaterals with incomplete occlusion of the hepatic veins) is invasive and obsolete in the era of state-of-the-art MR imaging. The diagnosis of primary BCS can be established when an obstructed hepatic outflow tract is shown in the absence of tumoral invasion or compression. MR imaging can show the parenchymal changes, the enhancement patterns in the arterial and delayed phases, and the intrahepatic collaterals, and can exclude any tumors with a high level of confidence (Figs. 88.1, 88.2). Ultrasound is an excellent modality for the evaluation of blood flow within hepatic vessels as well as after transjugular intrahepatic portosystemic shunt (TIPS) but does not provide an overview of the (vascular) anatomy (Fig. 88.3).
Differential Diagnosis and Management
These are discussed in the following two chapters.
88 Budd-Chiari Syndrome I – Abnormal Enhancement and Intrahepatic Collaterals 189
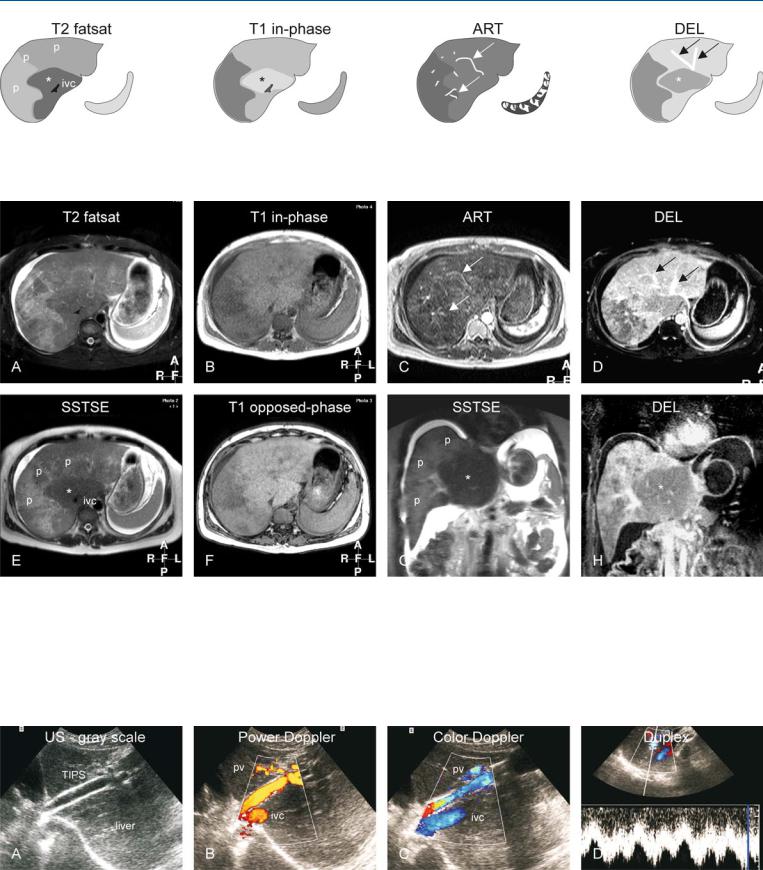
Fig. 88.1. Budd-Chiari syndrome, drawings. T2 fatsat: the liver shows peripheral atrophy (p) with high signal and central hypertrophy (*) with normal low signal (ivc = inferior vena cava); T1 in-phase: note almost normal high sig-
Fig. 88.2. Budd-Chiari syndrome, MRI findings. A Axial fat-saturated TSE image (T2 fatsat): The liver shows central hypertrophy with normal low signal and atrophy with abnormally high signal. Note the ascites. B Axial in-phase image (T1 fatsat): Central part shows normal signal. C Axial arterial phase 2D GRE image (ART): Multiple intrahepatic arterial collaterals are visible (arrows) with heterogeneous parenchymal enhancement. D Axial delayed phase image (DEL): Multiple intrahepatic venous collaterals are visible (arrows) with peripheral heterogeneous enhancement. E Axial SSTSE
nal centrally (*); ART: intrahepatic abnormal arteries (intrahepatic collaterals) are visible (arrows); DEL: intrahepatic abnormal veins (intrahepatic collaterals) are visible (arrows); note peripheral increased enhancement
(SSTSE): The liver shows central hypertrophy with normal low signal (*) and peripheral atrophy with abnormally high signal (p) (ivc = inferior vena cava). F Axial opposed-phase image (T1 opposed-phase): There is no fatty infiltration. G Coronal SSTSE (SSTSE): Note the central hypertrophy with low signal (*) and peripheral atrophy with abnormal signal (p). H Coronal delayed phase image (DEL): The central part shows less enhancement (*) than the periphery
Fig. 88.3. Budd-Chiari syndrome, TIPS evaluation with US in a different patient. A Ultrasound (gray scale) shows the TIPS with flow void indicating its patency. B Power Doppler shows flow within the TIPS, inferior vena cava (ivc), and the portal vein (pv). C Color Doppler shows flow within the TIPS that
connects the ivc and pv. D Duplex measures the flow within TIPS (4 – 6 cm/s). The variability is caused by the respiration and the changing intrathoracic pressure