
- •Contents
- •Contributors
- •1 Introduction
- •2.1 Posterior Compartment
- •2.2 Anterior Compartment
- •2.3 Middle Compartment
- •2.4 Perineal Body
- •3 Compartments
- •3.1 Posterior Compartment
- •3.1.1 Connective Tissue Structures
- •3.1.2 Muscles
- •3.1.3 Reinterpreted Anatomy and Clinical Relevance
- •3.2 Anterior Compartment
- •3.2.1 Connective Tissue Structures
- •3.2.2 Muscles
- •3.2.3 Reinterpreted Anatomy and Clinical Relevance
- •3.2.4 Important Vessels, Nerves, and Lymphatics of the Anterior Compartment
- •3.3 Middle Compartment
- •3.3.1 Connective Tissue Structures
- •3.3.2 Muscles
- •3.3.3 Reinterpreted Anatomy and Clinical Relevance
- •3.3.4 Important Vessels, Nerves, and Lymphatics of the Middle Compartment
- •4 Perineal Body
- •References
- •MR and CT Techniques
- •1 Introduction
- •2.1 Introduction
- •2.2.1 Spasmolytic Medication
- •2.3.2 Diffusion-Weighted Imaging
- •2.3.3 Dynamic Contrast Enhancement
- •3 CT Technique
- •3.1 Introduction
- •3.2 Technical Disadvantages
- •3.4 Oral and Rectal Contrast
- •References
- •Uterus: Normal Findings
- •1 Introduction
- •References
- •1 Clinical Background
- •1.1 Epidemiology
- •1.2 Clinical Presentation
- •1.3 Embryology
- •1.4 Pathology
- •2 Imaging
- •2.1 Technique
- •2.2.1 Class I Anomalies: Dysgenesis
- •2.2.2 Class II Anomalies: Unicornuate Uterus
- •2.2.3 Class III Anomalies: Uterus Didelphys
- •2.2.4 Class IV Anomalies: Bicornuate Uterus
- •2.2.5 Class V Anomalies: Septate Uterus
- •2.2.6 Class VI Anomalies: Arcuate Uterus
- •2.2.7 Class VII Anomalies
- •References
- •Benign Uterine Lesions
- •1 Background
- •1.1 Uterine Leiomyomas
- •1.1.1 Epidemiology
- •1.1.2 Pathogenesis
- •1.1.3 Histopathology
- •1.1.4 Clinical Presentation
- •1.1.5 Therapy
- •1.1.5.1 Indications
- •1.1.5.2 Medical Therapy and Ablation
- •1.1.5.3 Surgical Therapy
- •1.1.5.4 Uterine Artery Embolization (UAE)
- •1.1.5.5 Magnetic Resonance-Guided Focused Ultrasound
- •2 Adenomyosis of the Uterus
- •2.1 Epidemiology
- •2.2 Pathogenesis
- •2.3 Histopathology
- •2.4 Clinical Presentation
- •2.5 Therapy
- •3 Imaging
- •3.2 Magnetic Resonance Imaging
- •3.2.1 Magnetic Resonance Imaging: Technique
- •3.2.2 MR Appearance of Uterine Leiomyomas
- •3.2.3 Locations, Growth Patterns, and Imaging Characteristics
- •3.2.4 Histologic Subtypes and Forms of Degeneration
- •3.2.5 Differential Diagnosis
- •3.2.6 MR Appearance of Uterine Adenomyosis
- •3.2.7 Locations, Growth Patterns, and Imaging Characteristics
- •3.2.8 Differential Diagnosis
- •3.3 Computed Tomography
- •3.3.1 CT Technique
- •3.3.2 CT Appearance of Uterine Leiomyoma and Adenomyosis
- •3.3.3 Atypical Appearances on CT and Differential Diagnosis
- •4.1 Indications
- •4.2 Technique
- •Bibliography
- •Cervical Cancer
- •1 Background
- •1.1 Epidemiology
- •1.2 Pathogenesis
- •1.3 Screening
- •1.4 HPV Vaccination
- •1.5 Clinical Presentation
- •1.6 Histopathology
- •1.7 Staging
- •1.8 Growth Patterns
- •1.9 Treatment
- •1.9.1 Treatment of Microinvasive Cervical Cancer
- •1.9.2 Treatment of Grossly Invasive Cervical Carcinoma (FIGO IB-IVA)
- •1.9.3 Treatment of Recurrent Disease
- •1.9.4 Treatment of Cervical Cancer During Pregnancy
- •1.10 Prognosis
- •2 Imaging
- •2.1 Indications
- •2.1.1 Role of CT and MRI
- •2.2 Imaging Technique
- •2.2.2 Dynamic MRI
- •2.2.3 Coil Technique
- •2.2.4 Vaginal Opacification
- •2.3 Staging
- •2.3.1 General MR Appearance
- •2.3.2 Rare Histologic Types
- •2.3.3 Tumor Size
- •2.3.4 Local Staging
- •2.3.4.1 Stage IA
- •2.3.4.2 Stage IB
- •2.3.4.3 Stage IIA
- •2.3.4.4 Stage IIB
- •2.3.4.5 Stage IIIA
- •2.3.4.6 Stage IIIB
- •2.3.4.7 Stage IVA
- •2.3.4.8 Stage IVB
- •2.3.5 Lymph Node Staging
- •2.3.6 Distant Metastases
- •2.4 Specific Diagnostic Queries
- •2.4.1 Preoperative Imaging
- •2.4.2 Imaging Before Radiotherapy
- •2.5 Follow-Up
- •2.5.1 Findings After Surgery
- •2.5.2 Findings After Chemotherapy
- •2.5.3 Findings After Radiotherapy
- •2.5.4 Recurrent Cervical Cancer
- •2.6.1 Ultrasound
- •2.7.1 Metastasis
- •2.7.2 Malignant Melanoma
- •2.7.3 Lymphoma
- •2.8 Benign Lesions of the Cervix
- •2.8.1 Nabothian Cyst
- •2.8.2 Leiomyoma
- •2.8.3 Polyps
- •2.8.4 Rare Benign Tumors
- •2.8.5 Cervicitis
- •2.8.6 Endometriosis
- •2.8.7 Ectopic Cervical Pregnancy
- •References
- •Endometrial Cancer
- •1.1 Epidemiology
- •1.2 Pathology and Risk Factors
- •1.3 Symptoms and Diagnosis
- •2 Endometrial Cancer Staging
- •2.1 MR Protocol for Staging Endometrial Carcinoma
- •2.2.1 Stage I Disease
- •2.2.2 Stage II Disease
- •2.2.3 Stage III Disease
- •2.2.4 Stage IV Disease
- •4 Therapeutic Approaches
- •4.1 Surgery
- •4.2 Adjuvant Treatment
- •4.3 Fertility-Sparing Treatment
- •5.1 Treatment of Recurrence
- •6 Prognosis
- •References
- •Uterine Sarcomas
- •1 Epidemiology
- •2 Pathology
- •2.1 Smooth Muscle Tumours
- •2.2 Endometrial Stromal Tumours
- •3 Clinical Background
- •4 Staging
- •5 Imaging
- •5.1 Leiomyosarcoma
- •5.2.3 Undifferentiated Uterine Sarcoma
- •5.3 Adenosarcoma
- •6 Prognosis and Treatment
- •References
- •1.1 Anatomical Relationships
- •1.4 Pelvic Fluid
- •2 Developmental Anomalies
- •2.1 Congenital Abnormalities
- •2.2 Ovarian Maldescent
- •3 Ovarian Transposition
- •References
- •1 Introduction
- •4 Benign Adnexal Lesions
- •4.1.1 Physiological Ovarian Cysts: Follicular and Corpus Luteum Cysts
- •4.1.1.1 Imaging Findings in Physiological Ovarian Cysts
- •4.1.1.2 Differential Diagnosis
- •4.1.2 Paraovarian Cysts
- •4.1.2.1 Imaging Findings
- •4.1.2.2 Differential Diagnosis
- •4.1.3 Peritoneal Inclusion Cysts
- •4.1.3.1 Imaging Findings
- •4.1.3.2 Differential Diagnosis
- •4.1.4 Theca Lutein Cysts
- •4.1.4.1 Imaging Findings
- •4.1.4.2 Differential Diagnosis
- •4.1.5 Polycystic Ovary Syndrome
- •4.1.5.1 Imaging Findings
- •4.1.5.2 Differential Diagnosis
- •4.2.1 Cystadenoma
- •4.2.1.1 Imaging Findings
- •4.2.1.2 Differential Diagnosis
- •4.2.2 Cystadenofibroma
- •4.2.2.1 Imaging Features
- •4.2.3 Mature Teratoma
- •4.2.3.1 Mature Cystic Teratoma
- •Imaging Findings
- •Differential Diagnosis
- •4.2.3.2 Monodermal Teratoma
- •Imaging Findings
- •4.2.4 Benign Sex Cord-Stromal Tumors
- •4.2.4.1 Fibroma and Thecoma
- •Imaging Findings
- •4.2.4.2 Sclerosing Stromal Tumor
- •Imaging Findings
- •4.2.5 Brenner Tumors
- •4.2.5.1 Imaging Findings
- •4.2.5.2 Differential Diagnosis
- •5 Functioning Ovarian Tumors
- •References
- •1 Introduction
- •2.1 Context
- •2.2.2 Indications According to Simple Rules
- •References
- •CT and MRI in Ovarian Carcinoma
- •1 Introduction
- •2.1 Familial or Hereditary Ovarian Cancers
- •3 Screening for Ovarian Cancer
- •5 Tumor Markers
- •6 Clinical Presentation
- •7 Imaging of Ovarian Cancer
- •7.1.2 Peritoneal Carcinomatosis
- •7.1.3 Ascites
- •7.3 Staging of Ovarian Cancer
- •7.3.1 Staging by CT and MRI
- •Imaging Findings According to Tumor Stages
- •Value of Imaging
- •7.3.2 Prediction of Resectability
- •7.4 Tumor Types
- •7.4.1 Epithelial Ovarian Cancer
- •High-Grade Serous Ovarian Cancer
- •Low-Grade Serous Ovarian Cancer
- •Mucinous Epithelial Ovarian Cancer
- •Endometrioid Ovarian Carcinomas
- •Clear Cell Carcinomas
- •Imaging Findings of Epithelial Ovarian Cancers
- •Differential Diagnosis
- •Borderline Tumors
- •Imaging Findings
- •Differential Diagnosis
- •Recurrent Ovarian Cancer
- •Imaging Findings
- •Differential Diagnosis
- •Value of Imaging
- •Malignant Germ Cell Tumors
- •Dysgerminomas
- •Imaging Findings
- •Differential Diagnosis
- •Immature Teratomas
- •Imaging Findings
- •Malignant Transformation in Benign Teratoma
- •Imaging Findings
- •Differential Diagnosis
- •Sex-Cord Stromal Tumors
- •Granulosa Cell Tumors
- •Imaging Findings
- •Sertoli-Leydig Cell Tumor
- •Imaging Findings
- •Ovarian Lymphoma
- •Imaging Findings
- •Differential Diagnosis
- •7.4.3 Ovarian Metastases
- •Imaging Findings
- •Differential Diagnosis
- •7.5 Fallopian Tube Cancer
- •7.5.1 Imaging Findings
- •Differential Diagnosis
- •References
- •Endometriosis
- •1 Introduction
- •2.1 Sonography
- •3 MR Imaging Findings
- •References
- •Vagina and Vulva
- •1 Introduction
- •3.1 CT Appearance
- •3.2 MRI Protocol
- •3.3 MRI Appearance
- •4.1 Imperforate Hymen
- •4.2 Congenital Vaginal Septa
- •4.3 Vaginal Agenesis
- •5.1 Vaginal Cysts
- •5.1.1 Gardner Duct Cyst (Mesonephric Cyst)
- •5.1.2 Bartholin Gland Cyst
- •5.2.1 Vaginal Infections
- •5.2.1.1 Vulvar Infections
- •5.2.1.2 Vulvar Thrombophlebitis
- •5.3 Vulvar Trauma
- •5.4 Vaginal Fistula
- •5.5 Post-Radiation Changes
- •5.6 Benign Tumors
- •6.1 Vaginal Malignancies
- •6.1.1 Primary Vaginal Carcinoma
- •6.1.1.1 MRI Findings
- •6.1.1.2 Lymph Node Drainage
- •6.1.1.3 Recurrence and Complications
- •6.1.2 Non-squamous Cell Carcinomas of the Vagina
- •6.1.2.1 Adenocarcinoma
- •6.1.2.2 Melanoma
- •6.1.2.3 Sarcomas
- •6.1.2.4 Lymphoma
- •6.2 Vulvar Malignancies
- •6.2.1 Vulvar Carcinoma
- •6.2.2 Melanoma
- •6.2.3 Lymphoma
- •6.2.4 Aggressive Angiomyxoma of the Vulva
- •7 Vaginal Cuff Disease
- •7.1 MRI Findings
- •8 Foreign Bodies
- •References
- •Imaging of Lymph Nodes
- •1 Background
- •3 Technique
- •3.1.1 Intravenous Unspecific Contrast Agents
- •3.1.2 Intravenous Tissue-Specific Contrast Agents
- •References
- •1 Introduction
- •2.1.1 Imaging Findings
- •2.1.2 Differential Diagnosis
- •2.1.3 Value of Imaging
- •2.2 Pelvic Inflammatory
- •2.2.1 Imaging Findings
- •2.3 Hydropyosalpinx
- •2.3.1 Imaging Findings
- •2.3.2 Differential Diagnosis
- •2.4 Tubo-ovarian Abscess
- •2.4.1 Imaging Findings
- •2.4.2 Differential Diagnosis
- •2.4.3 Value of Imaging
- •2.5 Ovarian Torsion
- •2.5.1 Imaging Findings
- •2.5.2 Differential Diagnosis
- •2.5.3 Diagnostic Value
- •2.6 Ectopic Pregnancy
- •2.6.1 Imaging Findings
- •2.6.2 Differential Diagnosis
- •2.6.3 Value of Imaging
- •3.1 Pelvic Congestion Syndrome
- •3.1.1 Imaging Findings
- •3.1.2 Differential Diagnosis
- •3.1.3 Value of Imaging
- •3.2 Ovarian Vein Thrombosis
- •3.2.1 Imaging Findings
- •3.2.2 Differential Diagnosis
- •3.2.3 Value of Imaging
- •3.3 Appendicitis
- •3.3.1 Imaging Findings
- •3.3.2 Value of Imaging
- •3.4 Diverticulitis
- •3.4.1 Imaging Findings
- •3.4.2 Differential Diagnosis
- •3.4.3 Value of Imaging
- •3.5 Epiploic Appendagitis
- •3.5.1 Imaging Findings
- •3.5.2 Differential Diagnosis
- •3.5.3 Value of Imaging
- •3.6 Crohn’s Disease
- •3.6.1 Imaging Findings
- •3.6.2 Differential Diagnosis
- •3.6.3 Value of Imaging
- •3.7 Rectus Sheath Hematoma
- •3.7.1 Imaging Findings
- •3.7.2 Differential Diagnosis
- •3.7.3 Value of Imaging
- •References
- •MRI of the Pelvic Floor
- •1 Introduction
- •2 Imaging Techniques
- •3.1 Indications
- •3.2 Patient Preparation
- •3.3 Patient Instruction
- •3.4 Patient Positioning
- •3.5 Organ Opacification
- •3.6 Sequence Protocols
- •4 MR Image Analysis
- •4.1 Bony Pelvis
- •5 Typical Findings
- •5.1 Anterior Compartment
- •5.2 Middle Compartment
- •5.3 Posterior Compartment
- •5.4 Levator Ani Muscle
- •References
- •Evaluation of Infertility
- •1 Introduction
- •2 Imaging Techniques
- •2.1 Hysterosalpingography
- •2.1.1 Cycle Considerations
- •2.1.2 Technical Considerations
- •2.1.3 Side Effects and Complications
- •2.1.5 Pathological Findings
- •2.1.6 Limitations of HSG
- •2.2.1 Cycle Considerations
- •2.2.2 Technical Considerations
- •2.2.2.1 Normal and Abnormal Anatomy
- •2.2.3 Accuracy
- •2.2.4 Side Effects and Complications
- •2.2.5 Limitations of Sono-HSG
- •2.3 Magnetic Resonance Imaging
- •2.3.1 Indications
- •2.3.2 Technical Considerations
- •2.3.3 Limitations
- •3 Ovulatory Dysfunction
- •4 Pituitary Adenoma
- •5 Polycystic Ovarian Syndrome
- •7 Uterine Disorders
- •7.1 Müllerian Duct Anomalies
- •7.1.1 Class I: Hypoplasia or Agenesis
- •7.1.2 Class II: Unicornuate
- •7.1.3 Class III: Didelphys
- •7.1.4 Class IV: Bicornuate
- •7.1.5 Class V: Septate
- •7.1.6 Class VI: Arcuate
- •7.1.7 Class VII: Diethylstilbestrol Related
- •7.2 Adenomyosis
- •7.3 Leiomyoma
- •7.4 Endometriosis
- •References
- •MR Pelvimetry
- •1 Clinical Background
- •1.3.1 Diagnosis
- •1.3.2.1 Cephalopelvic Disproportion
- •1.3.4 Inadequate Progression of Labor due to Inefficient Contraction (“the Powers”)
- •2.2 Palpation of the Pelvis
- •3 MR Pelvimetry
- •3.2 MR Imaging Protocol
- •3.3 Image Analysis
- •3.4 Reference Values for MR Pelvimetry
- •5 Indications for Pelvimetry
- •References
- •MR Imaging of the Placenta
- •2 Imaging of the Placenta
- •3 MRI Protocol
- •4 Normal Appearance
- •4.1 Placenta Variants
- •5 Placenta Adhesive Disorders
- •6 Placenta Abruption
- •7 Solid Placental Masses
- •9 Future Directions
- •References
- •Erratum to: Endometrial Cancer

188 |
M. Horta and T.M. Cunha |
|
|
a |
b |
c |
d |
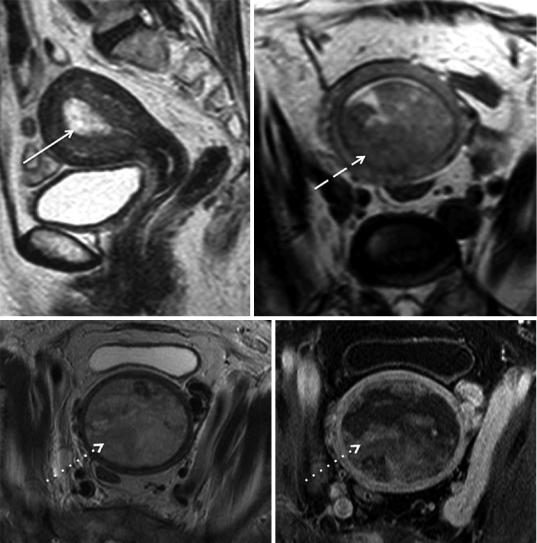
Fig. 5 MR features of endometrial cancer. (a) endometrioid cancer showing heterogeneous high-signal intensity on sagittal T2-weighted image (arrow); (b) endometrioid cancer showing hyposignal intensity on axial oblique T2-weighted image, a less common appearance (dashed arrow); (c, d) endometrioid cancer distending the uterine
cavity and compressing the myometrium showing a remarkable heterogeneous high-signal intensity on axial oblique T2 weighted image (dotted arrows) and mixed hypointensity and isointensity relative to outer myometrium after administration of gadolinium in the equilibrium phase (dotted arrows)
Bharwani et al. 2011). However, in one study higher grade tumors were associated with lower ADC values but there was a considerable overlap in estimation of histological grade based on ADC values (Tamai et al. 2007). Moreover, high ADC values may be found in high-grade tumors with a large necrotic component (Sala et al. 2010).
2.2.1\ Stage I Disease
Stage I endometrial carcinomas account for approximately 74 % of endometrial cancers (Cancer Incidence Statistics 2015). The most important role of the radiologist, when facing a stage I endometrial cancer is to determine the extent of myometrial invasion, since stage I disease is subdivided into stage IA disease, if the

Endometrial Cancer |
189 |
|
|
a |
b |
c
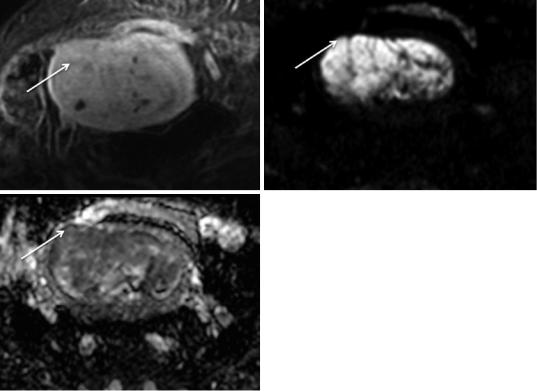
Fig. 6 (a) Endometrioid carcinoma in a 79-year-old |
(b, c) diffusion-weighted image (b = 1000 mm/s2) and the |
woman, isointense to the myometrium after administra- |
respective ADC map show typical tumoral restricted dif- |
tion of gadolinium in the equilibrium phase, making it dif- |
fusion, enabling the radiologist to diagnose invasion of |
ficult to access the depth of myometrial invasion (arrow); |
≥50 % the myometrium (stage IB) (arrow) |
tumor only invades <50 % of the myometrium, and stage IB disease, if the tumor invades ≥50 % of the myometrium (Figs. 8 and 9) (Pecorelli 2009). If the patient is considering fertility-sparing treatment, it is also important to clearly define if the tumor is confined to the endometrium or if it invades the superficial myometrium, which precludes this approach (Fig. 10) (Jafari Shobeiri et al. 2013; Kesterson and Fanning 2012).
T2-weighted images are useful in determining myometrial invasion. A focal or diffuse thickening of the endometrium with a clearly visualized intact junctional zone is a sign that the tumor is confined to the endometrium (Fig. 8). Breaching and irregularity of the hypointense signal of the junctional zone implies superficial myometrial invasion (Manfredi et al. 2005).
The depth of myometrial invasion should be based on the thickness of remaining myometrium
where the tumor is at its deepest point into the myometrium (Haldorsen and Salvesen 2012; Koyama et al. 2007).
However, there are situations where the evaluation of myometrial invasion by T2-weighted images may be difficult or even impossible, such as the presence of: a tumor in the cornua (Fig. 11); a fibromatous uterus (Fig. 11); a less conspicuous junctional zone in postmenopausal women (Fig. 12); a thinned myometrium in postmenopausal women (Fig. 13); an adenomyotic uterus (Fig. 14); a polypoid uterus; a congenital abnormality (Fig. 15); and the presence of poor tumor signal difference/isointensity between the tumor and the myometrium (Figs. 6 and 16) (Kinkel 2006; Scoutt et al. 1995; Yamashita et al. 1993a; Saez et al. 2000; Fanning et al. 1990). In these cases, DCE-MR and DWI-MR play an important role, when combined with T2-weighted images.

190 |
M. Horta and T.M. Cunha |
|
|
a |
b |
c |
d |
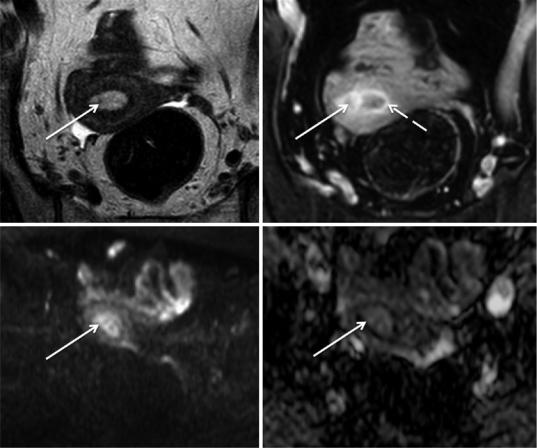
Fig. 7 Benign polyp in a 60-year-old woman. (a) Axial oblique T2-weighted image shows a heterogeneous hyperintense filling of the endometrial cavity; (b) axial oblique 3D fat-suppressed T1-weighted sequence after the administration of gadolinium in the arterial phase (30 s) shows lesional heterogeneous enhancement (arrow). Note the avid enhancement of the junctional zone in this phase when compared to the outer myometrium (dashed
arrow). Both T2 and DCE-MR characteristics of this benign polyp mimic those of endometrial carcinoma; (c) axial diffusion-weighted image (b = 1000 s/mm2) shows high-signal intensity of the tumor; (d) the apparent diffusion coefficient map also shows high-signal intensity. In contrast to what would be expected in an endometrial carcinoma, this benign polyp does not show restricted diffusion
On DCE-MR imaging, in the arterial phase (≈ 30 s), the junctional zone typically enhances avidly when compared to the endometrial tumor (Manfredi et al. 2005). Disruption of this subendometrial enhancement usually indicates myometrial invasion (Fujii et al. 2015; Manfredi et al. 2005; Nakao et al. 2006; Yamashita et al. 1993b; Kaneda et al. 2011; Frei and Kinker 2001). This is particularly important when the patient is being considered for fertility-sparing treatment since the FIGO 2009 division of stage I disease is only based on the presence of invasion of the inner or
outer portions of the myometrium (Fig. 10) (Jafari Shobeiri et al. 2013; Kesterson and Fanning 2012).
On the other hand, it is in the equilibrium phase (≈120 s) that is better diagnosed deep myometrial invasion. In this phase there is more pronounced contrast-to-noise ratio between the outer myometrium, which is markedly hyperintense, and the endometrial tumor, which is usually hypointense (Figs. 9, 13 and 15) (Manfredi et al. 2005). Attention must be paid to the presence of peritumoral inflammatory enhancement, which

Endometrial Cancer |
191 |
|
|
a |
b |
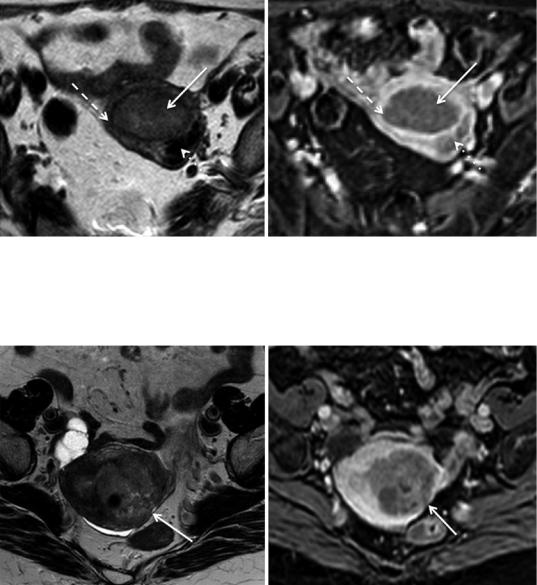
Fig. 8 Stage IA endometrioid carcinoma. (a) Axial oblique T2-weighted image; (b) axial oblique 3D fat-sup- pressed T1-weighted sequence after the administration of gadolinium in the arterial phase (30 s). There is preservation of the regular hypointense signal on T2-weighted
image and of the regular enhancement of the junctional zone after administration of gadolinium in the arterial phase (dashed arrow), thus the tumor is confined to the endometrial cavity (arrow). Note the intramural leiomyoma in the posterior corpus (dotted arrow)
a |
b |
Fig. 9 Stage IB endometrioid carcinoma in an 85-year- old woman. (a) Axial oblique T2-weighted image; (b) axial oblique 3D fat-suppressed T1-weighted sequence after the administration of gadolinium in the equilibrium phase (120 s). There is extension of the tumor to the outer
portion of the left posterior myometrium (arrow), which is clearly depicted after the administration of gadolinium in the equilibrium phase, where there is more pronounced contrast-to-noise ratio between the hypointense tumor and the hyperintense outer myometrium
can exaggerate the appearance of myometrial invasion (Sala et al. 2013).
DWI-MR has shown to be very useful in assessing myometrial invasion, especially in patients who cannot receive intravenous contrast, in patients with isointense or hyperintense tumors
relative to the myometrium following contrast administration, and in patients with adenomyosis (Figs. 16, 14 and 16) (Takeuchi et al. 2009; Sala et al. 2010).
Moreover, DWI-MR is very accurate in assessing myometrial invasion.

192 |
M. Horta and T.M. Cunha |
|
|
a |
b |
Fig.10 Endometrioid carcinoma in a woman considering fertility-sparing therapy. (a) Axial oblique T2-weighted image; (b) axial oblique 3D fat-suppressed T1-weighted sequence after the administration of gadolinium in the arterial phase (30 s). Axial oblique T2-weighted image is
inconclusive regarding myometrial invasion, whereas DCE-MR in the arterial phase clearly shows that there is no disruption of the junctional zone enhancement and therefore the tumor does not invade the myometrium
a |
b |
c |
d |
e |
f |
g |
h |
i |
j |
k |

Endometrial Cancer |
|
193 |
|
|
|
a |
b |
c |
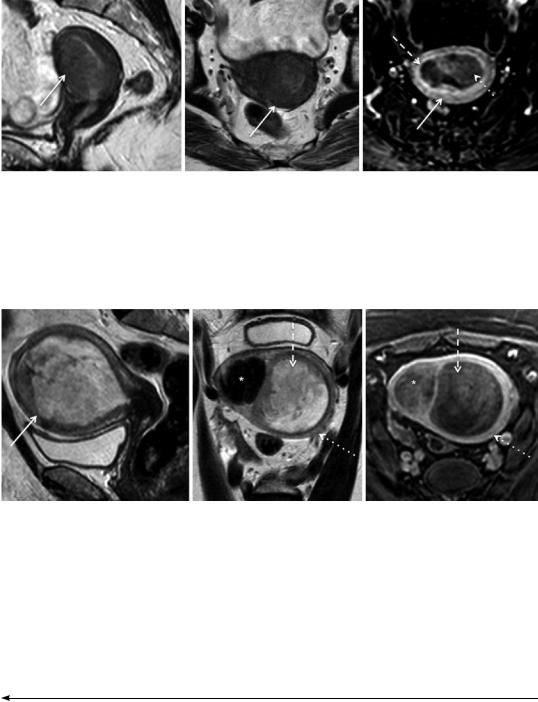
Fig.12 Stage IA mucinous carcinoma of the endometrium in a 72-year-old woman with a thinned junctional zone. (a) Sagittal T2-weighted image; (b) axial oblique T2-weighted image; (c) axial oblique 3D fat-suppressed T1-weighted sequence after the administration of gadolinium in the arterial phase (30 s). The junctional zone of this postmenopausal woman cannot be identified in T2-weighted images,
making it difficult to assess the depth of tumoral myometrial invasion. The use of T2-weighted images alone might suggest that the tumor invades the outer portion of the myometrium (arrow). However contrast-enhanced image in the arterial phase clearly shows an enhancing regular junctional zone (dashed arrow) and the tumor confined to the endometrial cavity (dotted arrow)
a |
b |
c |
Fig.13 Stage IA endometrioid carcinoma in a 72-year-old woman with myometrial thinning secondary to stretching due to a large tumor. (a) Sagittal T2-weighted image; (b) axial T2-weighted image; (c) axial oblique 3D fat-sup- pressed T1-weighted sequence after the administration of gadolinium in the equilibrium phase (120 s). Distortion at the base of this polypoid tumor is difficult to distinguish
from outer myometrial tumoral invasion on T2 weighted images (arrow). Contrast-enhanced image in the equilibrium phase clearly shows a hypointense tumor (dashed arrow) that does not invade the outer hyperintense myometrium (dotted arrow). Note the T2 hypointense intramural leiomyoma (asterisk)
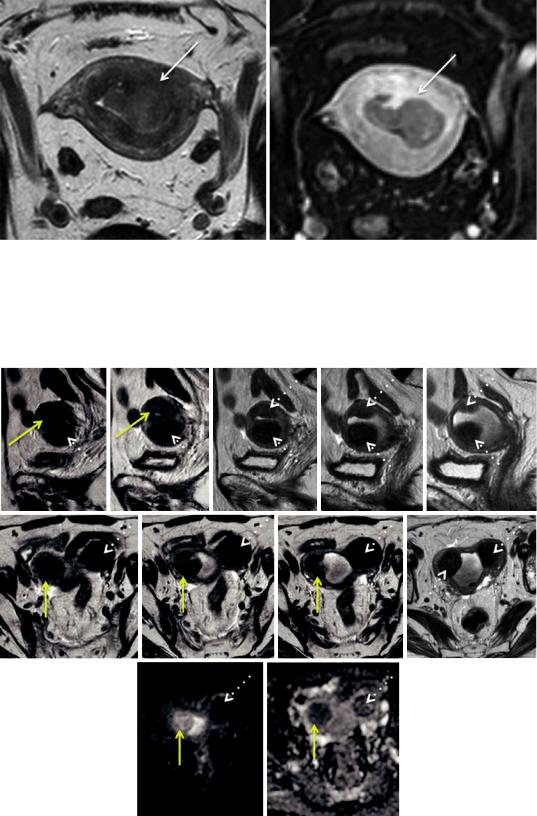
Fig. 11 Endometrial adenocarcinoma in a 71-year-old patient, previously submitted to radiation therapy due to cervical cancer. (a–e) Sagittal T2-weighted images fail to clearly show a small isointense tumor in the right uterine cornua (yellow arrow), due to the coexistence of submucosal leiomyomas (dotted arrow); (f–i) axial oblique T2-weighted images better depict this isointense lesion
and clearly differentiate it from the hypointense leiomyomas; (j) axial diffusion-weighted image (b = 1000 s/mm2) shows high-signal intensity of the tumor; (k) the apparent diffusion coefficient map shows hyposignal intensity, therefore tumoral restricted diffusion. In contrast, the leiomyoma present in the left cornua, does not show restricted diffusion

194 |
M. Horta and T.M. Cunha |
|
|
a |
b |
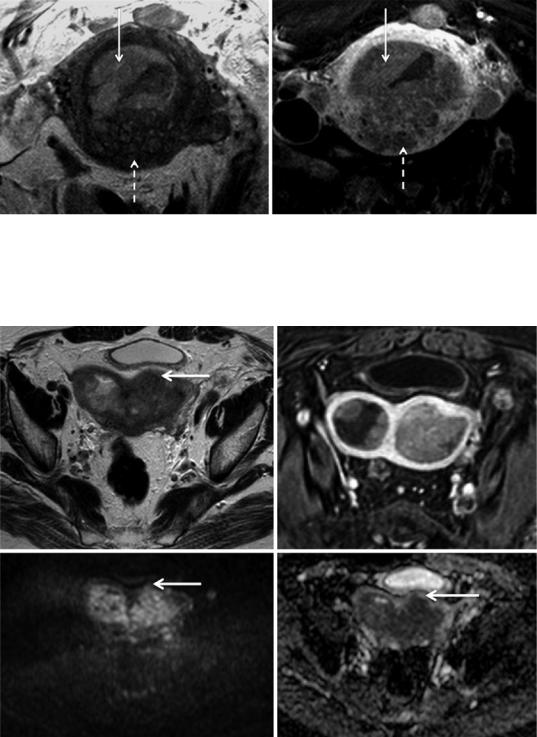
Fig. 14 Endometrioid carcinoma in a 71-year-old woman with an adenomyotic uterus. (a) Axial oblique T2-weighted image. (b) Axial oblique 3D fat-sup- pressed T1-weighted sequence after the administration of gadolinium in the equilibrium phase (120 s). The
presence of posterior adenomyosis (dashed arrow) impedes the assessment of tumoral (arrow) myometrial invasion on both T2-weighted image and contrastenhanced image. Diffusion-weighted images could be useful in this case
a |
b |
c |
d |
Fig. 15 Stage IB endometrioid carcinoma in a 76-year- old woman with a bicornuate bicollis uterus. (a) Axial T2-weighted image; (b) axial oblique 3D fat-suppressed T1-weighted sequence after the administration of gadolinium in the equilibrium phase (120 s); (c) axial diffu- sion-weighted image (b = 1000 s/mm2). (d) ADC map. In
this bicornuate bicollis uterus, the tumoral invasion of the anterior outer myometrium is difficult to depict on both T2-weighted image and after administration of contrast. Diffusion-weighted image and the respective ADC map clearly identify a focal area of restricted diffusion in the anterior outer myometrium, staging the tumor as IB