


Uterus: Normal Findings
Athina C. Tsili
Contents
1 Introduction\
2 Embryonic Development
and Normal Anatomy of the Uterus\
3 Uterine Corpus: Normal
CT and MRI Findings\
4 Uterine Cervix: Normal
CT and MRI Findings\
References\
|
|
1\ |
Introduction |
|
|
||
|
45 |
Radiologists should be familiar with the |
|||||
|
|
||||||
|
45 |
normal |
appearances of the uterus on CT and |
||||
MRI when interpreting uterine pathologies. |
|||||||
|
|
||||||
|
49 |
Although CT is not generally recommended as |
|||||
the first-line imaging modality for the assess- |
|||||||
|
|
||||||
|
56 |
ment of uterine diseases, it is often used for |
|||||
the initial evaluation of patients referred to the |
|||||||
|
|
||||||
|
58 emergency |
settings. Multidetector |
CT |
with |
|||
|
|
multiplanar |
reformations allows |
improved |
|||
|
|
visualization of the normal anatomy of the |
|||||
|
|
uterus. MRI is a superb modality for evalua- |
|||||
|
|
tion of the normal uterus. Uterine and cervical |
|||||
|
|
zonal anatomy is nicely displayed |
on |
||||
|
|
T2WI. The zonal appearance of the uterine |
|||||
|
|
corpus changes significantly in response to a |
|||||
|
|
variety of physiological stimuli, including |
|||||
|
|
menstrual phase, age and hormonal effects. |
|||||
|
|
Functional |
imaging techniques |
including |
|||
|
|
dynamic contrast-enhanced MRI and diffu- |
|||||
|
|
sion-weighted imaging enable the radiologist |
|||||
|
|
to move from morphological to functional |
|||||
|
|
assessment of the normal uterus. |
|
|
|||
A.C. Tsili
Department of Clinical Radiology, Medical School, University of Ioannina, University Campus, 45110, Ioannina, Greece
e-mail: a_tsili@yahoo.gr; atsili@cc.uoi.gr
2\ Embryonic Development
and Normal Anatomy
of the Uterus
In females, the paramesonephric (Müllerian) ducts arise from the mesoderm, lateral to the mesonephric ducts in the seventh week. The
Med Radiol Diagn Imaging (2017) |
45 |
DOI 10.1007/174_2017_43, © Springer International Publishing AG
Published Online: 09 April 2017
46 |
A.C. Tsili |
|
|
paramesonephric ducts grow caudally, coursing lateral to the urogenital ridges. In the eighth week, the paired paramesonephric ducts lie medial to the mesonephric ducts. The paramesonephric ducts fuse to form a confluence. This process is called Müllerian organogenesis and represents the initial stage in the development of the upper two-thirds of the vagina, the cervix, uterus and both fallopian tubes. The cranial end of the fused ducts gives rise to the future uterus. The caudal end of the fused ducts will form the upper two-thirds of the vagina. The lower third of the vagina is formed as the sinovaginal node (bulb) canalizes. The sinovaginal node inserts into the urogenital sinus at Müller’s tubercle (Mann et al. 2012).
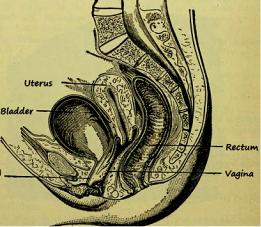
The uterus is a pear-shaped organ, approximately 8 cm long, 5 cm at its widest part and 2.5 cm or less at its thickest part (Fig. 1) (Mann et al. 2012; Basmajian 1971; Siddall and Rubens 2005). It is composed of three distinct anatomic regions, namely the fundus, the body and the cervix. The fundus and body form the upper two-thirds and the cervix the lower third. The fundus is the part that lies above the tubes and is covered by peritoneum. The lower uterine segment (isthmus) together with the internal os forms the junction between the uterine corpus and cervix (Mann et al. 2012).
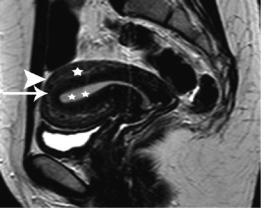
The zonal anatomy of the uterus as classically described consists of: the endometrium composed of the mucosal stratum functionalis and the region of glandular interdigitation into the myometrium or stratum basale; the subendometrial region of densely packed smooth muscle bundles with an orientation primarily parallel to the endometrial stratum basale; the stratum vasculature, where the arcuate arteries are branching through the randomly oriented and loosely organized smooth muscle bundles of the myometrium proper; and the thin subserosal zone of dense fibrous tissue (Fig. 2) (Brown et al. 1991; Kaur et al. 1998). The
Fig. 1 Anatomic draft of the normal female pelvis in sagittal orientation
potential cavity of the uterine body is only a thin cleft. The anterior and posterior walls are applied to each other.
The uterus is thick-walled and muscular. The arrangement of muscle fibres in the human uterus has been extensively evaluated, and the uterine wall consists of two counter-rotating systems of spiral fibres. Fibres in the myometrium are divided into the internal layer (stratum subvasculature), which mostly run in a circular pattern, and the external layer (stratum supravasculature), which mostly run in a longitudinal pattern. There is also an intermediate layer (stratum vasculature) in which the fibres run in random directions (Fiocchi et al. 2012).
The cervical canal extends from the internal os to the external os of the uterus. It is spindle-shaped and 2–3 cm in length. The uterine cervix consists of the supravaginal cervical canal (endocervix) and the vaginal portion that projects into the vagina. The wall of the cervix is primarily made up of firm connective tissue. The muscular part accounts for less than 10% of the cervical wall and primarily consists of smooth muscle cells in circular arrangement. The cervical canal is coated with
Uterus: Normal Findings |
47 |
|
|
Fig. 2 Sagittal T2WI image of a healthy premenopausal woman shows normal uterine zonal anatomy: the endometrium (asterisks) appears hyperintense, the junctional zone (long arrow) shows low signal intensity, the outer myometrium (asterisk) demonstrates intermediate signal intensity and a subserosal zone of the myometrium is detected hypointense (arrowhead)
mucus-producing columnar epithelium and contains numerous gland-like units, the crypts. The squamocolumnar junction is the transition from the columnar epithelium of the endocervix to the non-keratinizing squamous epithelium of the ectocervix and is situated at the level of the external os of the uterus (Mann et al. 2012).
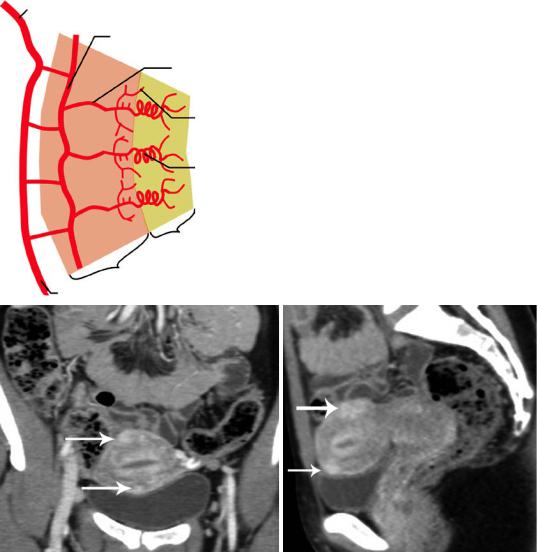
The uterine artery supplies the uterus and gives off superior and inferior branches to the cervix, fallopian tubes and upper vagina. It arises from the anterior branch of the internal iliac artery and crosses the ureter as it enters the bladder. The uterine artery gives branches that penetrate the outer myometrium, proceed to the middle third of the myometrium and divide to form the arcuate arteries. The arcuate arteries give off radial branches, which travel into the uterine lumen, called ‘spiral’ arteries as they pass the myometrial–endometrial junction. After entering the endometrium, the spiral arteries give off small branches, the basal arteries, which supply the basal layer and,
unlike the spiral arteries, are not affected by hormonal stimuli. The arcuate arteries give off branches to the outer myometrium and a plexus of small, radically oriented arteries is formed immediately beneath the serosa (Fig. 3) (Kaur et al. 1998). The uterine veins drain into the internal iliac veins. Lymphatic drainage from the corpus is through the broad ligament into the paraaortic lymph nodes and from the cervix into the parametrial and iliac lymph nodes.
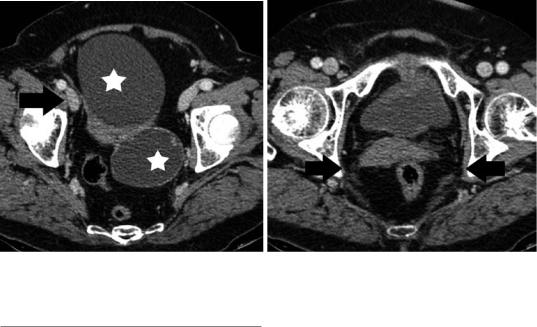
The broad ligament is formed by two layers of peritoneum, which drape over the uterus and extend laterally from the uterus to the pelvic sidewall. Its superior free edge is formed by the fallopian tube medially and the suspensory ligament of the ovary laterally. The lower margin of the broad ligament ends at the cardinal ligament. Between the two leaves of the broad ligament can be found loose extraperitoneal connective tissue, smooth muscle and fat known as the parametrium, which contains the fallopian tube, round ligament, ovarian ligament, uterine and ovarian blood vessels, nerves, lymphatic vessels, mesonephric remnants and a portion of the ureter (Foshager and Walsh 1994). The round ligament is a band of fibromuscular tissue that attaches to the anterolateral uterine fundus just below and anterior to the fallopian tube and ovarian ligament (Fig. 4). The cardinal ligament forms the base of the broad ligament and provides the major ligamentous support for the uterus and upper vagina. It extends laterally from the cervix and upper vagina to merge with a fascia overlying the obturator internus muscle (Fig. 4b). The uterine artery lies along its superior border. The uterosacral ligament lies posteriorly, extending from the lateral cervix and vagina at the level of the internal cervical os and forming a curved arc toward the anterior body of the sacrum at S2 or S3 level (Foshager and Walsh 1994).
Most of the uterus is covered by peritoneum. The peritoneum passes from the
48 |
A.C. Tsili |
|
|
a |
Ovarian artery |
|
|
|
Arcuate artery |
|
Radial artery |
|
Basal artery |
|
Spiral artery |
|
Endometrium |
|
Myometrium |
|
Utrerine artery |
b |
c |
Fig. 3 (a) Arterial vasculature of the human uterus. CT examination (b) coronal and (c) sagittal multiplanar reformatted images (portal phase) depict uterine arcuate arteries (long arrow)
symphysis pubis on to the upper surface of the bladder and from the third piece of the sacrum to rectum. The homologue of the rectovesical pouch of peritoneum in the male is divided into an anterior and a posterior part by a trans-
verse partition, formed by the uterus and the broad ligament. The anterior subdivision is the vesicouterine pouch and the posterior subdivision the rectouterine pouch (Douglas space) (Basmajian 1971).
Uterus: Normal Findings |
49 |
|
|
a |
b |
Fig. 4 Transverse contrast-enhanced CT images (portal phase) in a postmenopausal woman with bilateral serous ovarian cystadenomas (asterisk, a) depict normal right round ligament (arrow, a) and cardinal (arrow, b) ligaments
3\ Uterine Corpus: Normal CT
and MRI Findings
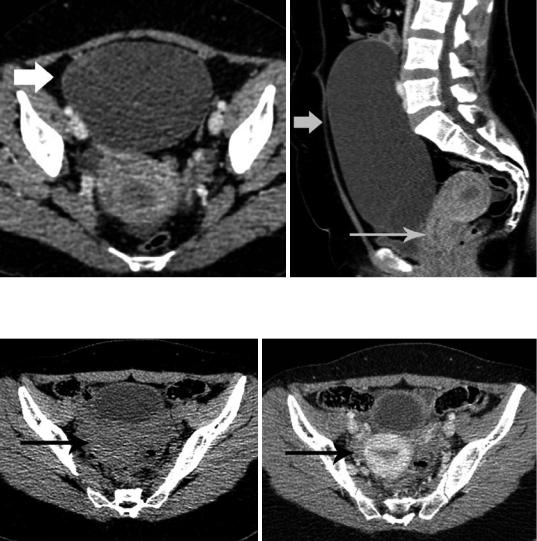
Although CT is generally not the primary imaging modality for the assessment of the uterus, it is often the initial diagnostic examination for evaluating nongynecologic pelvic diseases, especially in emergency settings. Therefore, radiologists should be familiar with normal uterine CT findings, to avoid misdiagnosis and/ or unnecessary additional diagnostic tests (Yitta et al. 2011; Yitta et al. 2009; Kormano et al. 1981; Grossman et al. 2008; Lim et al. 2002). Multidetector CT (MDCT) with two-dimen- sional multiplanar reformatted (MPR) images has improved visualization of the normal anatomy of the female pelvis (Yitta et al. 2011; Yitta et al. 2009). Standard sagittal and coronal MPRs and when necessary additional oblique or curved planar MPRs are generated with no additional time or labor required on the part of the radiologist (Yitta et al. 2011; Yitta et al. 2009). Sagittal reconstructions are particularly recommended in cases of a retroverted and retroflexed uterus and in cases of a prominent or triangular endometrium (Fig. 5) (Yitta et al. 2011; Yitta et al. 2009; Kormano et al. 1981; Grossman et al. 2008; Lim et al. 2002).
At unenhanced images, the uterus exhibits relative uniform soft-tissue density, with a central slightly hypodense region, corresponding to endometrial canal (Fig. 6). With conventional CT, the uterine wall appears relatively featureless with lack of distinction between layers after intravenous contrast material administration. Multidetector CT with rapid scanning during different phases of contrast enhancement allows the detection of a uterine enhancement pattern, closely resembling that at dynamic gadoliniumenhanced MRI (Kaur et al. 1998; Yitta et al. 2011; Yitta et al. 2009; Yamashita et al. 1993).
However, few data regarding normal uterine and cervical contrast enhancement with MDCT exist in the literature (Kaur et al. 1998; Yitta et al. 2011; Yitta et al. 2009; Kormano et al. 1981). Three types of early enhancement of the uterine body have been described with single-section helical CT: type 1, subendometrial enhancement with or without associated subserosal enhancement, predominantly seen in premenopausal women; type 2, absence of early subendometrial enhancement with enhancement either progressing from the subserosa or diffuse from the outset, equally seen in both premenopausal and postmenopausal women and type 3, faint diffuse enhancement of the myometrium, predominantly seen in postmenopausal women (Fig. 7) (Kaur
50 |
A.C. Tsili |
|
|
a |
b |
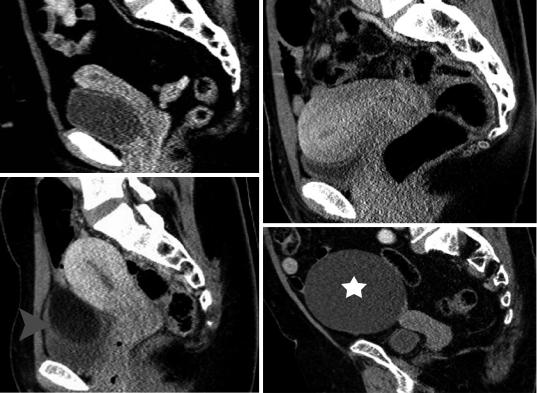
Fig. 5 (a) Transverse and (b) sagittal MPRs (portal phase) in a 35-year-old woman with ovarian mucinous cystadenoma (arrow) and retroverted and retroflexed uterus. Normal cervical enhancement is seen (long arrow)
a |
b |
Fig. 6 Transverse unenhanced (a) and contrast-enhanced (b) CT images of normal uterus in a 23-year-old woman. The endometrium appears hypodense (long arrow)
et al. 1998; Yitta et al. 2009). Recently, another pattern has been described, including patchy, heterogeneous enhancement throughout the myometrium (Yitta et al. 2011). The visualization of these enhancement patterns is transient, depending on various factors, including age and menstrual status. On delayed imaging, diffuse uniform enhancement of the myometrium is seen. The lower uterine segment and cervix is often less enhancing compared to the myometrium on early phase and this may falsely simulate a mass (Fig. 7c).
On CT, the endometrium is defined as the central hypodense region. However, endometrial cavity often represents a source of confusion at CT (Yitta et al. 2009; Grossman et al. 2008; Lim et al. 2002). CT is considered relatively insensitive in detecting mild endometrial thickening, but better able to identify gross thickening (Grossman et al. 2008). Endometrial thickness may be exaggerated on standard axial and coronal images, especially in cases of uterine version, where the endometrium is imaged in an oblique plane. Sagittal MPRs are
Uterus: Normal Findings |
51 |
|
|
a |
b |
c
d
Fig.7 Patterns of normal uterine enhancement on MDCT (sagittal MPRs, portal phase). Type 1, (a) thin and (b) thick subendometrial enhancement. (c) Type 2, diffuse myometrial enhancement. Normal hypodense cervix.
Ovarian mature cystic teratoma (arrowhead). (d) Type 3, minimal diffuse myometrial enhancement. Ovarian serous cystadenoma (asterisk, same patient as in Fig. 4)
often helpful to confirm or exclude gross endometrial thickening in these cases. CT criteria for characterizing normal endometrial thickness are lacking (Yitta et al. 2009; Grossman et al. 2008; Lim et al. 2002). A maximum of 7.5 mm in mean short-axis thickness of normal endometrium in asymptomatic postmenopausal women has been reported, greater than that for US measurements, in which 5 mm is an accepted upper limit of normal (Lim et al. 2002).
The normal dimensions of the uterus during reproductive life vary depending on patient age and parity. Normal uterus in women of childbearing age measures approximately 8 cm in length, 4 cm height and 5 cm width, with multiparous uterus being larger than nulliparous uterus by approximately 1 cm in each dimension (Takeuchi et al. 2010). The uterus is typically pear-shaped, with uterine body approximately twice the size
of the cervix. The normal position of the uterus may vary depending on the degree of distention of the urinary bladder. Uterine position is characterized in relation to the angle of the long axis of the uterine body to the long axis of the cervix (flexion) and the long axis of the uterus to the long axis of the vagina (version). The uterus is more often in an anteverted and anteflexed position (Takeuchi et al. 2010).
Uterine zonal anatomy on MRI is visualized on T2-weighted images (T2WI) consisting of a high signal intensity central zone, corresponding to endometrium, a subjacent low signal intensity junctional zone (JZ) of myometrium, a moderately intense zone of myometrium and a thin, hypointense subserosal zone of myometrium (Fig. 8) (Brown et al. 1991; Hricak et al. 1983; Togashi et al. 2001). The low signal intensity of the JZ is explained by its lower water content, decreased extracellular
52 |
A.C. Tsili |
|
|
a |
b |
d
c
e
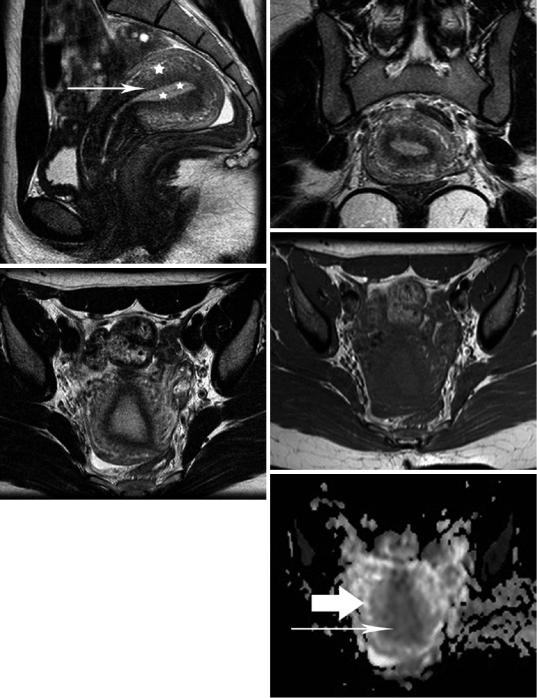
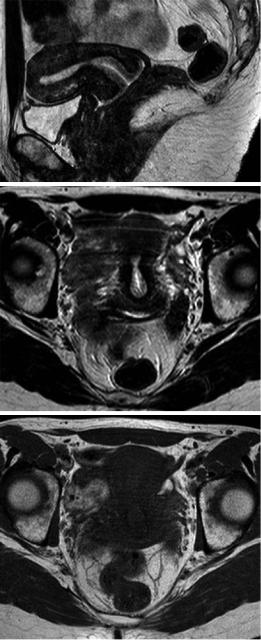
Fig. 8 MRI of a healthy 31-year-old woman with retro- |
(arrowhead). (d) Transverse T1WI shows relatively |
|||||
verted and retroflexed uterus during secretory phase. |
homogeneous uterine body with signal intensity similar to |
|||||
T2WI in (a) sagittal, (b) coronal and (c) transverse orien- |
that of muscles. (e) Transverse apparent diffusion coeffi- |
|||||
tation. The endometrium is thick (asterisks), the myome- |
cient (ADC) map. The ADC of normal endometrium |
|||||
trium appears hyperintense (asterisk) and the interface |
(long |
arrow) |
and |
myometrium |
(arrow) |
is |
between outer myometrium and JZ is relatively indistinct |
1.26 × 10⁻³ mm2/s and 1.55 × 10⁻³ mm2/s, respectively |
|
||||
Uterus: Normal Findings |
53 |
|
|
matrix, tightly packed muscle cells and a threefold increase in nuclear area (Togashi et al. 2001; Hauth et al. 2007; Novellas et al. 2011; Brosens et al. 1995). The first studies in the 1980s proposed a maximum threshold of between 2 and 5 mm for the thickness of the normal JZ. Over the past two decades, this criterion has been gradually revised, resulting in an upper limit of normal of 5–8 mm for the thickness of the JZ. A width larger than 12 mm for JZ on MRI has been proposed as a criterion for
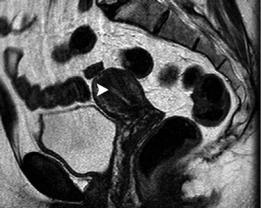
Fig. 9 MRI of a healthy 33-year-old woman during menstrual phase. T2WI in sagittal orientation. The endometrium appears thin. Within the cavity, the menstrual blood (long arrow) is detected as a stripe of low signal intensity
the diagnosis of diffuse adenomyosis (Togashi et al. 2001; Hauth et al. 2007; Novellas et al. 2011; Brosens et al. 1995). Uterine body appears homogeneous and featureless on T1-weighted images (T1WI), isointense compared to skeletal muscles (Brown et al. 1991; Hricak et al. 1983; Togashi et al. 2001) (Fig. 8d).
Uteri of women in the reproductive age, not taking exogenous hormones show variations in endometrial and myometrial width, and signal intensity throughout the menstrual cycle (Takeuchi et al. 2010; Togashi et al. 2001; Hauth et al. 2007; McCarthy et al. 1986; Demas et al. 1986; Haynor et al. 1986; Langer et al. 2012; He et al. 2016). The endometrium is thin just after menstruation. As the estrogen level increases during the proliferative (follicular) phase, the endometrium thickens. During ovulation, there are no obvious changes in the endometrium. During the secretory (luteal) phase, under the influence of both estrogen and progesterone, the endometrium reaches its maximum thickness, up to 7–14 mm. The myometrium shrinks on menstrual phase and has decreased signal intensity on T2WI (Fig. 9). Myometrial thickness gradually increases during the proliferative phase. The contrast between outer myometrium and JZ is more prominent in the proliferative phase (Fig. 10), and it becomes indistinct in the secretory and menstrual phases. Myometrial signal intensity
a |
b |
Fig. 10 MRI of a healthy 32-year-old woman during proliferative phase. (a) Sagittal T2WI image. The endometrium appears thin (long arrow) and the contrast between outer myometrium and JZ is evident. (b) Axial
ADC map. The ADC of normal endometrium (long arrow) and myometrium (arrow) is 1.56 × 10⁻³ mm2/s and 1.47 × 10⁻³ mm2/s, respectively
54 |
A.C. Tsili |
|
|
Fig. 11 T2WI in sagittal plane of a healthy 64-year-old woman depicts a small uterus, with a normal thin hyperintense endometrium (arrowhead)
increases and myometrial arcuate vessels are more clearly defined during the midsecretory phase (Fig. 8). The higher water content of the myometrium during this phase results in increased signal intensity (Takeuchi et al. 2010; Togashi et al. 2001; Hauth et al. 2007; McCarthy et al. 1986; Demas et al. 1986; Haynor et al. 1986; Langer et al. 2012; He et al. 2016).
Patient age has a significant effect on MRI features of female reproductive organs (Takeuchi et al. 2010; Hauth et al. 2007; Demas et al. 1986; Langer et al. 2012). In the premenarchal girl and in the postmenopausal woman, the uterine corpus is small and relatively featureless, with faint myometrial-endo- metrial interface on T2WI (Fig. 11) (Takeuchi et al. 2010; Demas et al. 1986; Langer et al. 2012).
Exogenous hormonal replacement affects the appearance of the uterus (Togashi et al. 2001; McCarthy et al. 1986; Demas et al. 1986). In premenopausal women using oral contraceptives, the JZ is significantly thinner than usual, the uterus has a thin endometrium and a bright myometrium, the latter due to edema. Women treated with GnRH analogue exhibit a uterus similar to that found in postmenopausal women. Although tamoxifen is antiestrogenic, it has paradoxical estrogenic effects in postmenopausal women, resulting in a heterogenous and thickened endometrium. These findings may mimic endometrial cancer, although they regress after withdrawal of the drug (Togashi et al. 2001; McCarthy et al. 1986; Demas et al. 1986).
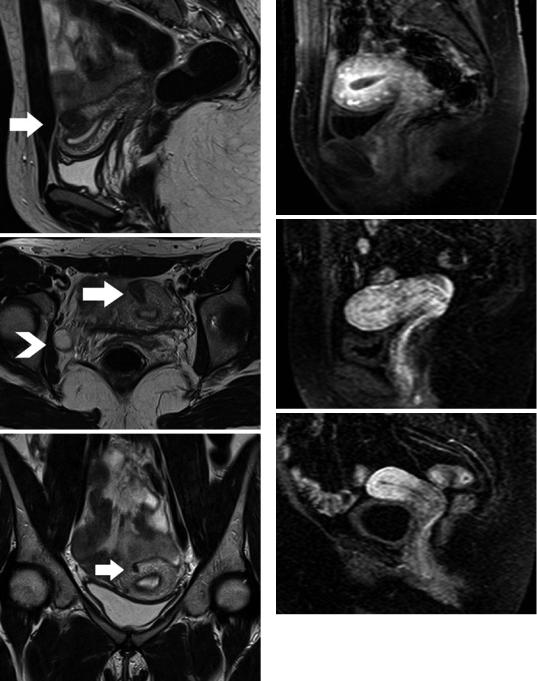
The normal uterus presents two types of physiologic myometrial contractions: transient sustained contraction and uterine peristalsis (Togashi et al. 1993a, b, 2001; Masui et al. 2001). Transient myometrial contraction appears as sporadic focal bulging of myometrium, persisting for several minutes. It may be detected as a focal hypointense area on T2WI, simulating a leiomyoma or adenomyosis, although it may disappear on subsequent images (Fig. 12). Uterine peristalsis is caused by contractions of the inner myometrium, with retrograde direction (cervico-fundal) in mid-cycle and antegrade during menstruation. This movement is considered to play a major role in rapid sperm transport, discharge of menstrual blood and in maintenance of early pregnancies. Uterine peristalsis subsides during the secretory phase, most likely to facilitate implantation of the embryo. Fast MRI in a kinematic fashion depicts myometrial contraction, which appears as a series of changes in configuration, thickness and signal intensity of the myometrium and JZ (Togashi et al. 1993a, 2001; Masui et al. 2001).
Functional MRI by means of dynamic multiphase contrast-enhanced MRI (DCE-MRI) and diffusion-weighted MRI (DW-MRI) is now part of the standard imaging protocols for evaluation of the female pelvis. Both techniques enable the radiologist to move from morphological to functional assessment of diseases of the female pelvis (Sala et al. 2013; Punwani 2011).
Three types of uterine enhancement on DCEMRI have been described: type 1, a thin early enhancing layer between the endometrium and myometrium (called subendometrial enhancement [SEE]), followed by enhancement of the entire myometrium, more often seen during the proliferative phase or in postmenopausal women; type 2, a thick layer corresponding to the JZ with marked initial enhancement, usually seen during the secretory phase and type 3, enhancement of the whole myometrium, more often detected in the menstrual phase (Kaur et al. 1998; Yamashita et al. 1993; Hricak and Kim 1993) (Fig. 13).
Perfusion-MRI although mainly used as a research tool confirmed the presence of different myometrial components, especially during reproductive age, where both microcirculation and
Uterus: Normal Findings |
55 |
|
|
a |
a |
b
b
c
c
Fig. 12 Transient myometrial contraction. Τ2WI in (a) sagittal and (b) transverse orientation shows focal low signal intensity myometrial mass (arrow), mimicking leiomyoma. Small right ovarian follicle (arrowhead). (c) Subsequent coronal T2WI shows significant resolution of the findings (arrow) (Courtesy Dr. Cunha TM, Lisbon, Portugal)
Fig. 13 Patterns of early uterine enhancement on DCEMRI. (a) Type 1, thin enhancing layer between the endometrium and myometrium (subendometrial enhancement); (b) Type 2, thick enhancing layer corresponding to the JZ and (c) Type 3, enhancement of the whole myometrium

56 |
A.C. Tsili |
|
|
ultrastructural features such as the extracellular matrix differ between the inner and the outer myometrium. Specifically, DCE-MRI has shown higher tissue blood flow (F) and permeabilitysurface area product (PS), lower blood volume fraction (Vb) and interstitial volume (Ve), and longer lag time (Dt) in the inner myometrium, compared to the outer myometrium (ThomassinNaggara et al. 2010). During the menstrual cycle no differences for all perfusion imaging parameters are seen in the outer myometrium. By contrast, the inner myometrium shows microvascular variations with higher F, higher Vb and shorter Dt during the proliferative phase compared with the secretory phase (Thomassin-Naggara et al. 2010).
Blood oxygenation level dependent (BOLD) MRI has shown significantly lower T2* values for the JZ compared to that of the outer myometrium and lower T2* values of both JZ and outer myometrium throughout the menstrual cycle, probably related to decreased blood perfusion and subsequently decreased pO2 (Kido et al. 2007).
Uterine zone, age and phase of the menstrual cycle in premenopausal women should be taken into consideration when interpreting the apparent diffusion coefficient (ADC) values of uterine structures (He et al. 2016; Fujimoto et al. 2013; Kido et al. 2010; Tsili et al. 2012; Kuang et al. 2012; Fornasa and Montemezzi 2012; He et al. 2015). Normal ADC is higher for outer myometrium, followed by endometrium and JZ (Fujimoto et al. 2013). A wide variation of ADC for the normal endometrium/myometrium during the different phases of the menstrual cycle has been found. The ADC of the normal endometrium is lower during the menstrual phase when compared with the proliferative and the secretory phases. The ADC is also lower during the proliferative phase when compared with the secretory phase (Figs. 8e and 10b) (Kido et al. 2010; Tsili et al. 2012; Kuang et al. 2012; Fornasa and Montemezzi 2012; He et al. 2015). On the contrary, the ADC of myometrium shows significant increase from menstrual phase to secretory phase (Figs. 8e and 10b) (Tsili et al. 2012; He et al. 2015). The ADC of normal JZ increases with age in premenopausal women (He et al. 2016). During menstrual cycle, ADC of JZ is lower in menstrual phase compared to the secretory phase (He et al. 2016). Histopathologic
changes of the normal uterus in premenopausal women explain the variations of the ADC of the endometrium/myometrium during the menstrual cycle. Endometrial discharge consisting of blood and sloughing of stromal and epithelial cells coupled by the torn ends of veins, arteries and glands cause restricted diffusion by the endometrium during the menstrual phase. The presence of large uterine glands and more prominent arteries in stratum functionalis of the normal endometrium and increased interstitial fluid are the possible explanations for the higher ADC of the endometrium during the secretory phase when compared to the proliferative phase. The higher water content of the myometrium during secretory phase also possibly contributes to the higher ADC of the myometrium in this phase.
Diffusion tensor imaging (DTI) of the normal uterus in vivo using 3 T system reveals differences in fibre number, length and orientation (Fiocchi et al. 2012; He et al. 2016; Fujimoto et al. 2013). Anisotropy is found in most parts of the uterine body and two fibre directions have been described: circular and longitudinal, as in ex vivo studies (Fiocchi et al. 2012). Fractional anisotropy (FA) is highest for JZ, followed by outer myometrium and normal endometrium (He et al. 2016). During menstrual cycle, endometrial FA declines (He et al. 2016).
4\ Uterine Cervix: Normal CT
and MRI Findings
The cervix represents the lower third of the uterus, usually measuring 2–3 cm in length. On axial CT images, the exact boundary between the uterine body and the cervix may be difficult to detect. The oblique orientation of the cervix or the presence of fluid in the vaginal fornices may mimic a mass. Sagittal MPRs, with respect to the orientation of the cervix are helpful in delineating normal cervix, closely mimicking sagittal T2WI (Yitta et al. 2009). After intravenous contrast material administration, the cervix overall usually shows differential or delayed enhancement in comparison with the uterine body. This results in a hypodense appearance and may probably be related to the presence of greater amount of fibrous tissue in the cervix (Fig. 7c) (Yitta et al. 2011).
Uterus: Normal Findings |
57 |
|
|
Dynamic enhancement patterns of the normal uterine cervix at MDCT closely resemble those at MRI (Kaur et al. 1998; Yitta et al. 2011; Yitta et al. 2009). These patterns are seen in women with a type 1 or type 2 uterine enhancement patterns, but not with a type 3. The cervical zonal enhancement of the cervix is typically characterized by early, intense central circumferential enhancement, corresponding to the richly glandular central mucosa, with secondary less intense enhancement of the surrounding inner fibromuscular stroma (Fig. 5b). The outer fibromuscular stroma enhances later, more intensely compared to the inner fibromuscular stroma, but less intensely compared to the central cervical mucosa. The combination of the three layers produces a target-like appearance of the normal cervix on axial images (Kaur et al. 1998; Yitta et al. 2011; Yitta et al. 2009).
Nabothian cysts are essentially benign retention cysts of the cervix, probably due to chronic inflammation. They are usually asymptomatic, more often detected incidentally. At MDCT, nabothian cysts are well-defined cystic structures, with a density similar to that of fluid, of variable size. Sagittal and coronal MPRs show them as well-defined, thin-walled cystic structures, separate from the endocervical canal (Yitta et al. 2011).
On MRI, the cervix and the uterine body can be differentiated, the lower uterine segment (isthmus) creating a gradual separation between the corpus uteri and the cervix (Brown et al. 1991). T2WI delineates the following four discrete zones of the endocervix: the high signal intensity central region of cervical mucus; the high signal intensity endocervix with its mucosal folds; the cervical stroma, which displays a predominantly low T2 signal and is in contiguity with the JZ of the uterus and an intermediate signal intensity outer zone, which is continuous with the outer myometrium (Fig. 14). Both the middle and outer zones correspond to the fibromuscular stroma of the cervix (Brown et al. 1991; Yitta et al. 2011; Togashi et al. 2001; Scoutt et al. 1993; deSouza et al. 1994). The percentage of nuclear area in the inner zone of the fibromuscular stroma is 2.5 times greater than in the outer zone, which may account for
a
b
c
Fig.14 T2WI in (a) sagittal and (b) transverse orientation in a healthy premenopausal woman shows normal zonal anatomy of the uterine cervix: mucus in the cervical canal as a stripe of very high signal intensity centrally, the mucosa of the endocervix with high signal intensity, the cervical stroma with predominantly low signal intensity and the outermost layer with intermediate signal intensity. (c) Transverse T1WI depicts normal cervix relatively homogeneous, with signal intensity similar to that of the uterine body