


12 |
|
|
|
E. Hattingen and M. Warmuth-Metz |
|
|
|
|
|
Table 1 Image protocol for brain tumor |
|
|
|
|
|
Slice thickness/gab |
Weighting |
Details |
Important features |
Axial |
5 mm/0–0.5 mm |
T2WI |
T2-TSE |
Cortical ribbon sign, infiltration of |
|
|
|
|
insula, basal ganglia |
Axial |
5 mm/0–0.5 mm |
T1WI before/after |
SE preferred, without fat |
Consider T1-hyperintensities |
|
|
administration of contrast |
suppression, without MT pulses, |
|
|
|
agent |
same sequence contrast |
|
Coronal or |
5 mm/0–0.5 mm |
T1WI after administration |
SE preferred, should not be |
Depicts late enhancement when |
sagittal |
|
of contrast agent |
replaced by 3D sequences |
acquired after axial sequence |
Axial |
5 mm/0–0.5 mm |
FLAIR or PD (long TR) |
Optional 3D FLAIR |
|
|
(FLAIR with gab) |
|
|
|
Axial |
5–6 mm/0.5–1 mm |
DWI |
Calculate ADC |
Low ADC: postsurgical infarcts, |
|
|
|
|
cell density, abscess, |
|
|
|
|
antiangiogenic therapy |
Axial |
|
T2*WI |
SWI before/after administration |
(micro) Hemorrhages, blooming |
|
|
|
of contrast agent |
veins, tumor vessels |
Second plane |
Depends on the |
T2WI or T1WI |
Choose the sequence which best |
Follow-up examinations should |
|
localization of the |
|
depicts the tumor |
include exact the same sequence |
|
tumor |
|
|
|
3D post CM |
|
Avoid inversion pulses |
Does not replace second plane |
Measure enhancement in 3 planes |
|
|
(MPRAGE) |
|
|
MPR |
Multiplanar reformatting |
PPL |
Posterior pituitary lobe |
WI |
Weighted imaging |
1Introduction
Magnetic resonance imaging is clearly the method of choice for the imaging of CNS diseases. Computed tomography is an alternative in case of emergency or MRI contraindications. For radiotherapy planning, the physical properties of CT are essential (Stephenson and Wiley 1995). Still, it is the only method for a reliable depiction of calcification, which might have a diagnostic potential in some tumor entities especially in pediatric tumors and low-grade gliomas (Zulfiqar et al. 2012; Tsuda et al. 1997). The signal intensities on MRI and density values on CT allow a limited diagnosis of the histology of the tumor. Invasive angiography or conventional radiography is useful only in rare exceptions.
There are no standardized MR imaging protocols for brain tumors, so that the protocols given here are considered as proposals (Table 1). However, more and more patients with brain tumors, especially children (see Sect. 3), are included in treatment trials which have their own imaging protocols. For the European SIOPE (Europeenne International de la Société Societe International d’Oncologie Pédiatrique) brain tumor trials, an agreement of all reference (neuro)radiologists has been found. The following advice is based on this consensus.
Additional to the standard spin echo (SE) sequences, an increasing number of various sequences have become available. However, the imaging characteristics on these sequences and thus the size and morphology of tumors might vary artificially. The key to a correct evaluation of study patients in a comparable way is to keep standardized imaging sequences during follow-up. A standard imaging protocol should contain T2 and FLAIR or proton density sequences. They should be combined with T1-weighted sequences before and after intravenous administration of contrast agent.
2Brain Tumors in Adults
2.1Questions to the Radiologist
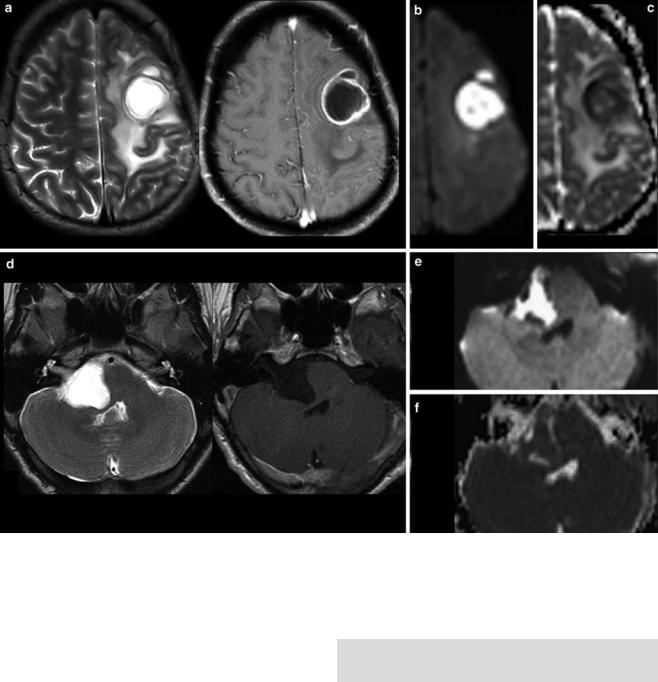
For each space-occupying lesion, inflammatory or vascular disease should be considered before a real neoplasm is diagnosed. Especially subacute hemorrhage, venous infarction, arteriovenous malformations, large demyelinating diseases, or necrotic infections may look like a real neoplastic tumor. Patient’s history, neurological symptoms, and patient’s age are mandatory information to provide the correct diagnosis. Further, there are some imaging features which may specify the entity of a lesion. These features include diffusion restriction of T2-hyper- intense lesions (Fig. 1), capsular and target-like structures of the margin, and the halo sign of the marginal zone
MR Imaging of Brain Tumors |
13 |
|
|
Fig. 1 Very hyperintense DWI lesions with corresponding lower ADC values. Ring-enhancing lesion with edema in patient with lung cancer (a). Very high DWI signal (b) with lower ADC values (c) were highly suspicious for an abscess, which was confirmed by stereotactic punction. Also note the hypointense signal of the capsule in T2WI (a). The
hyperintense and nonenhancing lesion in the pontocerebellar angle (d) shows high DWI signal (e) with lower ADC values (f). These features are almost pathognomonic for epidermoids differentiating them from arachnoid cysts and cystic schwannomas
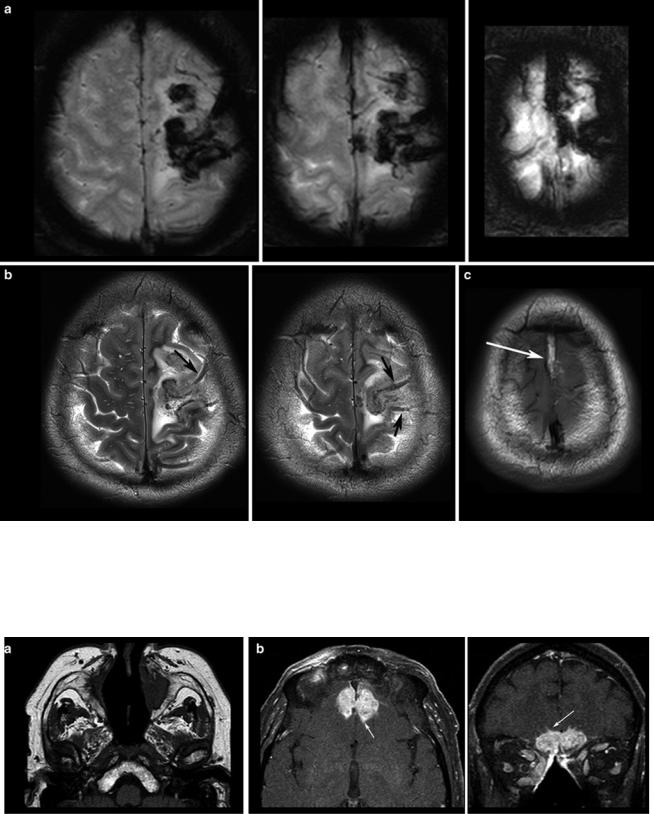
(Fig. 2). Veins should be screened for thrombosis and arteries for any other pathology (e.g., aneurysm, malformations). Beside hemorrhage, T2*WI and especially thin-sliced sus- ceptibility-weighted imaging (SWI) depict the “blooming” of any collection of blood either in hemorrhages and micro bleeds, cavernomas, or in vascular thromboses (Tong et al. 2008) (Fig. 3). The skull base, orbit, and viscerocranium should be screened for tumors and inflammatory diseases as they may secondarily infiltrate into the brain (Fig. 4). Especially in younger patients, the eyes and skin should also be inspected for malformations and hamartia indicating neurocutaneous diseases (Kandt 2003).
First Question: Tumor or Tumor-Like Lesion?
The most important question regarding the tumor entity is the differentiation between intracerebral (also named intra- axial)andextracerebral(extra-axial)localization.Extracerebral tumors are mostly benign neoplasms like meningiomas and schwannomas, whereas intracerebral tumors are malignant in the majority of cases, especially in older patients. Extracerebral tumors are rare in younger patients; thus neurocutaneous syndromes, previous radiation therapy, or metastases (e.g., neuroblastomas) should be considered.
14 |
E. Hattingen and M. Warmuth-Metz |
|
|
Fig. 2 Patients with multiple sclerosis, the T2WI (a, d) and proton density WI (b) show the typical “halo” surrounding the lesion (arrows). T1WI depicts round, patchy, (c) or crescent-shaped (e) enhancements
which are typical for demyelinating lesions. (f) Toxoplasmosis reveal target phenomena in some of the lesions (arrows) which are typically located in the basal ganglia and in the subcortical region
MR Imaging of Brain Tumors |
15 |
|
|
Fig. 3 T2*WI (a) shows the blooming of the thrombosis in the cortical veins (arrows in b) and in the superior sagittal sinus which is hyperintense in the T1WI (arrows in c) due to methemoglobin
Fig. 4 T1WI spin echo sequence shows the destruction of bony corticosteroid medication. Patient had Wegener granulomatosis of the structures in the nasal cavity (a) and hyperostosis resulting from the infiltrates
of the frontal skull base (b), developing intracranial tumor masses chronical infection. Also note the hypertrophic subcutaneous fat due to with small intracerebral infiltration (arrows, surgically confirmed)