
- •Table of Contents
- •About the Author
- •About the Technical Reviewer
- •Acknowledgments
- •Introduction
- •Installing Visual Studio
- •Visual Studio 2022 System Requirements
- •Operating Systems
- •Hardware
- •Supported Languages
- •Additional Notes
- •Visual Studio Is 64-Bit
- •Full .NET 6.0 Support
- •Using Workloads
- •The Solution Explorer
- •Toolbox
- •The Code Editor
- •New Razor Editor
- •What’s Available?
- •Hot Reload
- •Navigating Code
- •Navigate Forward and Backward Commands
- •Navigation Bar
- •Find All References
- •Find Files Faster
- •Reference Highlighting
- •Peek Definition
- •Subword Navigation
- •Features and Productivity Tips
- •Track Active Item in Solution Explorer
- •Hidden Editor Context Menu
- •Open in File Explorer
- •Finding Keyboard Shortcut Mappings
- •Clipboard History
- •Go To Window
- •Navigate to Last Edit Location
- •Multi-caret Editing
- •Sync Namespaces to Match Your Folder Structure
- •Paste JSON As Classes
- •Enable Code Cleanup on Save
- •Add Missing Using on Paste
- •Features in Visual Studio 2022
- •Visual Studio Search
- •Solution Filters
- •Visual Studio IntelliCode
- •Whole Line Completions
- •Visual Studio Live Share
- •Summary
- •Visual Studio Project Types
- •Various Project Templates
- •Console Applications
- •Windows Forms Application
- •Windows Service
- •Web Applications
- •Class Library
- •MAUI
- •Creating a MAUI Application
- •Pairing to Mac for iOS Development
- •Consuming REST Services in MAUI
- •The Complete Weather App
- •The Target Platforms
- •The Required NuGet Package
- •The Weather Models
- •The WeatherService
- •The MainViewModel
- •Registering Dependencies
- •Building the MainPage View
- •Using SQLite in a MAUI Application
- •The ToDoItem Model
- •The ToDoService
- •The MainViewModel
- •Registering Dependencies
- •Building the MainPage View
- •Managing NuGet Packages
- •Using NuGet in Visual Studio
- •Hosting Your Own NuGet Feeds
- •Managing nmp Packages
- •Creating Project Templates
- •Creating and Using Code Snippets
- •Creating Code Snippets
- •Using Bookmarks and Code Shortcuts
- •Bookmarks
- •Code Shortcuts
- •Adding Custom Tokens
- •The Server Explorer
- •Running SQL Queries
- •Visual Studio Windows
- •C# Interactive
- •Code Metrics Results
- •Maintainability Index
- •Cyclomatic Complexity
- •Class Coupling
- •Send Feedback
- •Personalizing Visual Studio
- •Adjust Line Spacing
- •Document Management Customizations
- •The Document Close Button
- •Modify the Dirty Indicator
- •Show Invisible Tabs in Italics in the Tab Drop-Down
- •Colorize Document Tabs
- •Tab Placement
- •Visual Studio Themes
- •Summary
- •Setting a Breakpoint
- •Step into Specific
- •Run to Click
- •Run to Cursor
- •Force Run to Cursor
- •Conditional Breakpoints and Actions
- •Temporary Breakpoints
- •Dependent Breakpoints
- •Dragging Breakpoints
- •Manage Breakpoints with Labels
- •Exporting Breakpoints
- •Using DataTips
- •Visualizing Complex Data Types
- •Bonus Tip
- •Using the Watch Window
- •The DebuggerDisplay Attribute
- •Evaluate Functions Without Side Effects
- •Format Specifiers
- •dynamic
- •hidden
- •results
- •Diagnostic Tools
- •CPU Usage
- •Memory Usage
- •The Events View
- •The Right Tool for the Right Project Type
- •Immediate Window
- •Attaching to a Running Process
- •Attach to a Remote Process
- •Remote Debugger Port Assignments
- •Remote Debugging
- •System Requirements
- •Download and Install Remote Tools
- •Running Remote Tools
- •Start Remote Debugging
- •Summary
- •Creating and Running Unit Tests
- •Create and Run a Test Playlist
- •Testing Timeouts
- •Using Live Unit Tests
- •Using IntelliTest to Generate Unit Tests
- •Focus IntelliTest Code Exploration
- •How to Measure Code Coverage in Visual Studio
- •Summary
- •Create a GitHub Account
- •Create and Clone a Repository
- •Create a Branch from Your Code
- •Creating and Handling Pull Requests
- •Multi-repo Support
- •Compare Branches
- •Check Out Commit
- •Line Staging
- •Summary
- •Index

Chapter 3 Debugging Your Code
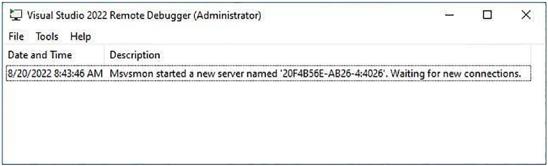
Figure 3-56. Visual Studio 2022 Remote Debugger
You are now ready to start remote debugging your application.
Start Remote Debugging
The great thing about the Remote Debugger on the remote computer is that it tells you the server name to connect to. In Figure 3-56, you can see that the server is named 20F4B56E-AB26-4:4026 where 4026 is the port assignment for Visual Studio 2022. Make a note of this server name and port number.
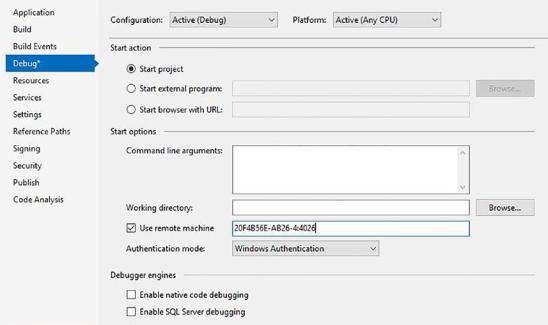
In your application, set a breakpoint somewhere in the code such as in a button click event handler. Now right-click the project in the Solution Explorer and click Properties. The project properties page opens as seen in Figure 3-57.
211

Chapter 3 Debugging Your Code
Figure 3-57. Project properties page
Now, perform the following steps to remotely debug your application:
\1.\ Click the Debug tab, check the Use remote machine checkbox, and enter the remote machine name and port noted earlier. In our example, this is 20F4B56E-AB26-4:4026.
\2.\ Make sure that you leave the Working directory text box empty and do not check Enable native code debugging.
\3.\ When all this is done, save the properties and build your project.
\4.\ You now need to create a folder on the remote computer that
is the same path as the Debug folder on your local machine (the Visual Studio machine). For example, the path to the project Debug folder on my local machine is <source path> ShipmentLocatorApp\VisualStudioRemoteDebug\bin\Debug. Create this same path on the remote machine.
\ 5.\ Copy the executable that was just created by the build you performed in step 3 to the newly created Debug folder on the remote computer.
212

Chapter 3 Debugging Your Code
Be aware that any changes to your code or rebuilds to your project will require you to repeat step 5.
\6.\ Ensure that the Remote Debugger is running on the remote computer. The description (Figure 3-56) should state that it is waiting for new connections.
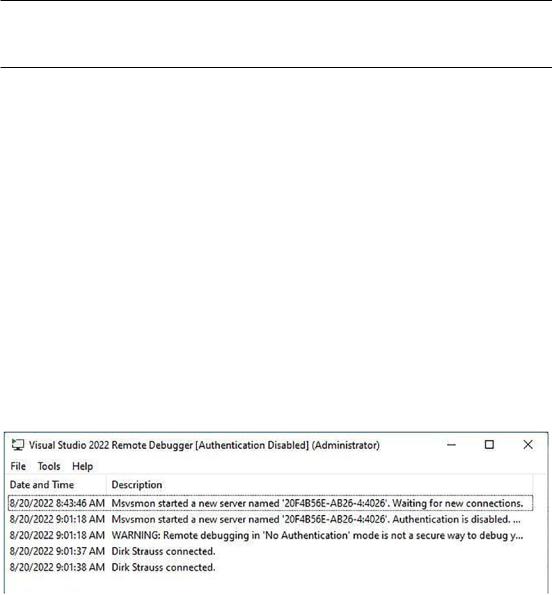
\7.\ On your local machine, start debugging your application, and if prompted, enter the credentials for the remote machine to log on. Once logged on, you will see that the Remote Debugger on the remote computer displays that the remote debug session is now active (Figure 3-58). A point to note here is that if you trust the network that you are debugging across, and you are having problems logging on, you can specify that no authentication is done. In the project properties, change the Authentication mode from Windows Authentication to No Authentication (Figure 3-57). Then, on the remote machine, click the Remote Debugger and click the Tools menu, and select Options. Here, you can specify that no authentication is done and that any user can debug.
Figure 3-58. Remote debug session connected
\ 8.\ After a few seconds, you will see your application’s main window displayed on the remote machine (Figure 3-59). Yep, breakfast is the most important meal of the day.
213