

Chapter 3 Debugging Your Code
Remote Debugger Port Assignments
The port assignments for the Visual Studio Remote Debugger are as follows:
•\ |
Visual Studio 2022: 4026 |
•\ |
Visual Studio 2019: 4024 |
•\ |
Visual Studio 2017: 4022 |
•\ |
Visual Studio 2015: 4020 |
•\ |
Visual Studio 2013: 4018 |
•\ |
Visual Studio 2012: 4016 |
The port assigned to the Remote Debugger is incremented by two for each release of Visual Studio.
Reattaching toaProcess
Starting with Visual Studio 2017, you can quickly reattach to a process you previously attached to. To do this, you can click the Debug menu and select Reattach to Process or hold down Shift+Alt+P. The debugger will try to attach to the last process you attached by matching the previous process ID to the list of running processes. If that fails, it tries to attach to a process by matching the name. If neither is successful, the Attach
to Process window is displayed and lets you select the correct process. The option to reattach to a process you previously attached will only be available if you had previously attached to it.
Remote Debugging
Sometimes, you need to debug an application that has already been deployed to a different computer. Visual Studio allows you to do this via remote debugging. To start, you need to download and install remote tools for Visual Studio 2022 on the remote computer.
Remote tools for Visual Studio 2022 enables app deployment, remote debugging, testing, profiling, and unit testing on computers that don’t have Visual Studio 2022 installed.
207
Chapter 3 Debugging Your Code
System Requirements
The supported operating systems for the remote computer must be one of the following:
•\ |
Windows 11 |
•\ |
Windows 10 (not phone) |
•\ |
Windows 8 or 8.1 (not phone) |
•\ |
Windows 7 SP 1 |
•\ |
Windows Server 2016 |
•\ |
Windows Server 2012 or Windows Server 2012 R2 |
•\ |
Windows Server 2008 SP 2, Windows Server 2008 R2 Service Pack 1 |
The supported hardware configurations to enable remote debugging are detailed in the following list:
•\ |
1.6 GHz or faster processor |
•\ |
1 GB of RAM (1.5 GB if running on a VM) |
•\ |
1 GB of available hard disk space |
•\ |
5400 RPM hard drive |
•\ |
DirectX 9-capable video card running at 1024 x 768 or higher display |
|
resolution |
The remote computer and your local machine (the machine containing Visual Studio) must both be connected over a network, workgroup, or homegroup. The two machines can also be connected directly via an Ethernet cable.
Take note that trying to debug two computers connected through a proxy is not supported.
It is also not recommended to debug via a dial-up connection (do those still exist?) or over the Internet across geographical locations. The high latency or low bandwidth will make debugging unacceptably slow.
208
Chapter 3 Debugging Your Code
Download and Install Remote Tools
Connect to the remote machine and download and install the correct version of the remote tools required for your version of Visual Studio. The link to download the remote tools compatible with all versions of Visual Studio 2022 is https://visualstudio. microsoft.com/downloads#remote-tools-for-visual-studio-2022.
If you are using Visual Studio 2017, for example, download the latest update of remote tools for Visual Studio 2017.
Also, be sure to download the remote tools with the same architecture as the remote computer. This means that even if your app is a 32-bit application, and your remote computer is running a 64-bit operating system, download the 64-bit version of the remote tools.
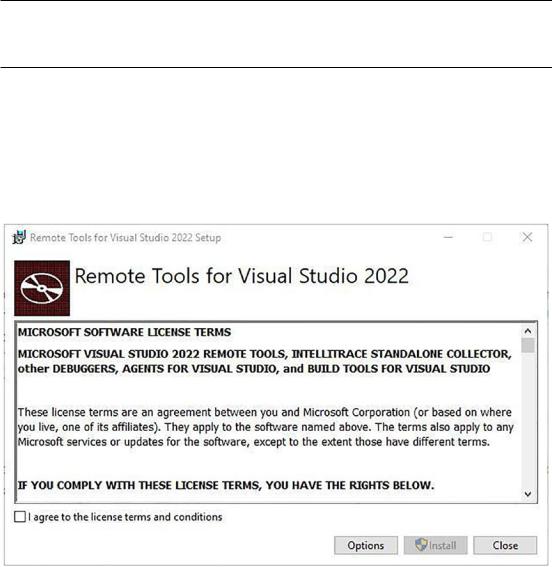
Install the remote tools and click Install after agreeing to the license terms and conditions (Figure 3-54).
Figure 3-54. Remote tools for Visual Studio 2022
209
Chapter 3 Debugging Your Code
Running Remote Tools
After the installation has been completed on the remote machine, run the Remote Debugger application as Administrator if you can. To do this, right-click the Remote Debugger app, and click Run as Administrator.
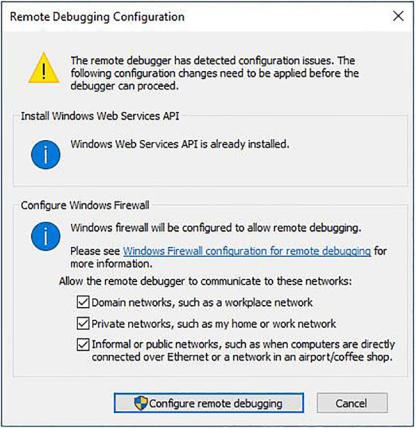
At this point, you might be presented with a Remote Debugging Configuration dialog box as seen in Figure 3-55.
Figure 3-55. Remote Debugging Configuration
If you encounter this window, it possibly means that there is a configuration issue that you need to resolve. The Remote Debugging Configuration dialog box will prompt you to correct configuration errors it picks up. Do this by clicking the Configure remote debugging button.
You will then see the Remote Debugger window as seen in Figure 3-56.
210