
- •Table of Contents
- •About the Author
- •About the Technical Reviewer
- •Acknowledgments
- •Introduction
- •Installing Visual Studio
- •Visual Studio 2022 System Requirements
- •Operating Systems
- •Hardware
- •Supported Languages
- •Additional Notes
- •Visual Studio Is 64-Bit
- •Full .NET 6.0 Support
- •Using Workloads
- •The Solution Explorer
- •Toolbox
- •The Code Editor
- •New Razor Editor
- •What’s Available?
- •Hot Reload
- •Navigating Code
- •Navigate Forward and Backward Commands
- •Navigation Bar
- •Find All References
- •Find Files Faster
- •Reference Highlighting
- •Peek Definition
- •Subword Navigation
- •Features and Productivity Tips
- •Track Active Item in Solution Explorer
- •Hidden Editor Context Menu
- •Open in File Explorer
- •Finding Keyboard Shortcut Mappings
- •Clipboard History
- •Go To Window
- •Navigate to Last Edit Location
- •Multi-caret Editing
- •Sync Namespaces to Match Your Folder Structure
- •Paste JSON As Classes
- •Enable Code Cleanup on Save
- •Add Missing Using on Paste
- •Features in Visual Studio 2022
- •Visual Studio Search
- •Solution Filters
- •Visual Studio IntelliCode
- •Whole Line Completions
- •Visual Studio Live Share
- •Summary
- •Visual Studio Project Types
- •Various Project Templates
- •Console Applications
- •Windows Forms Application
- •Windows Service
- •Web Applications
- •Class Library
- •MAUI
- •Creating a MAUI Application
- •Pairing to Mac for iOS Development
- •Consuming REST Services in MAUI
- •The Complete Weather App
- •The Target Platforms
- •The Required NuGet Package
- •The Weather Models
- •The WeatherService
- •The MainViewModel
- •Registering Dependencies
- •Building the MainPage View
- •Using SQLite in a MAUI Application
- •The ToDoItem Model
- •The ToDoService
- •The MainViewModel
- •Registering Dependencies
- •Building the MainPage View
- •Managing NuGet Packages
- •Using NuGet in Visual Studio
- •Hosting Your Own NuGet Feeds
- •Managing nmp Packages
- •Creating Project Templates
- •Creating and Using Code Snippets
- •Creating Code Snippets
- •Using Bookmarks and Code Shortcuts
- •Bookmarks
- •Code Shortcuts
- •Adding Custom Tokens
- •The Server Explorer
- •Running SQL Queries
- •Visual Studio Windows
- •C# Interactive
- •Code Metrics Results
- •Maintainability Index
- •Cyclomatic Complexity
- •Class Coupling
- •Send Feedback
- •Personalizing Visual Studio
- •Adjust Line Spacing
- •Document Management Customizations
- •The Document Close Button
- •Modify the Dirty Indicator
- •Show Invisible Tabs in Italics in the Tab Drop-Down
- •Colorize Document Tabs
- •Tab Placement
- •Visual Studio Themes
- •Summary
- •Setting a Breakpoint
- •Step into Specific
- •Run to Click
- •Run to Cursor
- •Force Run to Cursor
- •Conditional Breakpoints and Actions
- •Temporary Breakpoints
- •Dependent Breakpoints
- •Dragging Breakpoints
- •Manage Breakpoints with Labels
- •Exporting Breakpoints
- •Using DataTips
- •Visualizing Complex Data Types
- •Bonus Tip
- •Using the Watch Window
- •The DebuggerDisplay Attribute
- •Evaluate Functions Without Side Effects
- •Format Specifiers
- •dynamic
- •hidden
- •results
- •Diagnostic Tools
- •CPU Usage
- •Memory Usage
- •The Events View
- •The Right Tool for the Right Project Type
- •Immediate Window
- •Attaching to a Running Process
- •Attach to a Remote Process
- •Remote Debugger Port Assignments
- •Remote Debugging
- •System Requirements
- •Download and Install Remote Tools
- •Running Remote Tools
- •Start Remote Debugging
- •Summary
- •Creating and Running Unit Tests
- •Create and Run a Test Playlist
- •Testing Timeouts
- •Using Live Unit Tests
- •Using IntelliTest to Generate Unit Tests
- •Focus IntelliTest Code Exploration
- •How to Measure Code Coverage in Visual Studio
- •Summary
- •Create a GitHub Account
- •Create and Clone a Repository
- •Create a Branch from Your Code
- •Creating and Handling Pull Requests
- •Multi-repo Support
- •Compare Branches
- •Check Out Commit
- •Line Staging
- •Summary
- •Index

Chapter 3 Debugging Your Code
Memory Usage
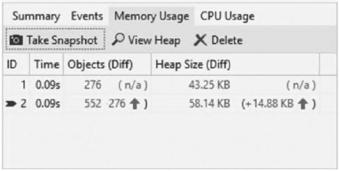
Visual Studio Diagnostic Tools allows developers to see what the change in memory usage is. This is done by taking snapshots. When you start debugging, place a breakpoint on a method you suspect is causing a memory issue. Then you step over the method and place another breakpoint. An increase is indicated with a red up arrow as seen in Figure 3-44.
This is often the best way to analyze memory issues. Two snapshots will give you a nice diff and allow you to see exactly what has changed.
Figure 3-44. Memory usage snapshots
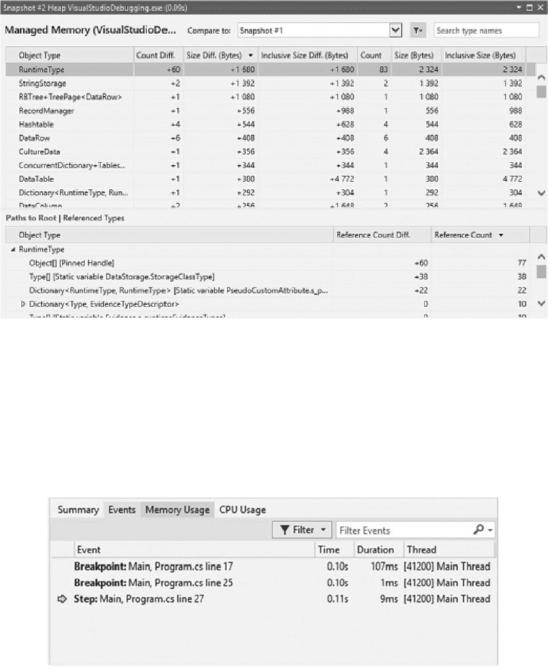
You can also compare two snapshots by clicking one of the links in the memory usage snapshots (Figure 3-44) and viewing the comparison in the snapshot window that opens (Figure 3-45). By selecting a snapshot in the Compare to drop-down list, you can see what has changed.
199

Chapter 3 Debugging Your Code
Figure 3-45. Comparing snapshots
The Events View
As you step through your application, the Events view will show you the different events that happen during your debug session. This can be setting a breakpoint or stepping through code. It also shows you the duration of the event as seen in Figure 3-46.
Figure 3-46. The Events view
200

Chapter 3 Debugging Your Code
This means that as you step through your code, the Events tab will display the time the code took to run from the previous step operation to the next. You can also see the same events displayed as PerfTips in the Visual Studio code editor as seen in Figure 3-47.
Figure 3-47. PerfTips in the code editor
IntelliTrace events are available in this tab if you have Visual Studio Enterprise.
For a comparison of the Visual Studio 2022 Editions, head on over to https:// visualstudio.microsoft.com/vs/compare/ and see what each edition has to offer.
PerfTips allows developers to quickly identify potential issues in your code.
The Right Tool for the Right Project Type
Table 3-1 shows which tools Visual Studio offers and the project types that can make use of these tools.
201