

Chapter 3 Debugging Your Code
dynamic
Displays the specified object using a Dynamic View
h
Hexadecimal integer
nq
String with no quotes
nse
Evaluates expressions without side effects where “nse” means “No Side Effects”
hidden
Displays all public and nonpublic members
raw
Displays item as it appears in the raw node. Valid on proxy objects only
results
Used with a variable that implements IEnumerable or IEnumerable<T>. Displays only members that contain the query result
You will recall that we used the “nq” format specifier with the DebuggerDisplay attribute discussed in a previous section.
Diagnostic Tools
Visual Studio gives developers access to performance measurement and profiling tools. The performance of your application should, therefore, be high on your priority list. An application that suffers from significant performance issues is as good as broken (especially from an end user’s perspective).
192
Chapter 3 Debugging Your Code
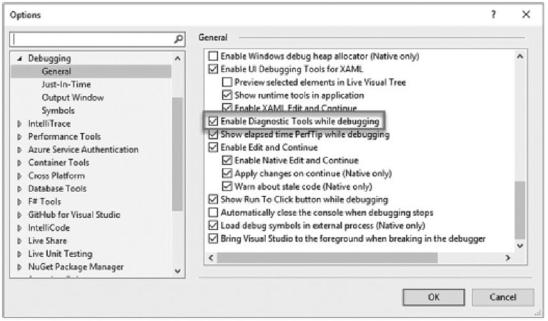
Visual Studio Diagnostic Tools might be enabled by default. If not, enable Diagnostic Tools by going to the Tools menu and clicking Options, Debugging, and then General. Ensure that Enable Diagnostic Tools while debugging is checked as seen in Figure 3-36.
Figure 3-36. Enable Diagnostic Tools
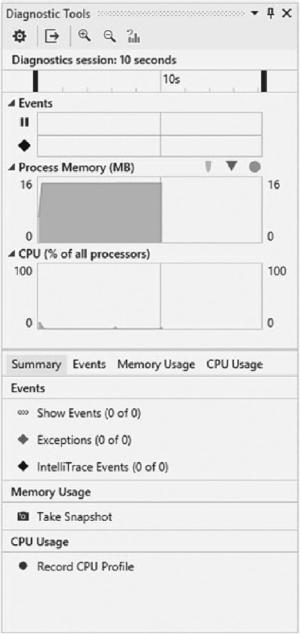
This will ensure that the Diagnostic Tools window opens automatically when you start debugging. When we start debugging our ShipmentLocator Windows Forms application, the Diagnostic Tools window will be displayed as seen in Figure 3-37.
193
Chapter 3 Debugging Your Code
Figure 3-37. Diagnostic Tools
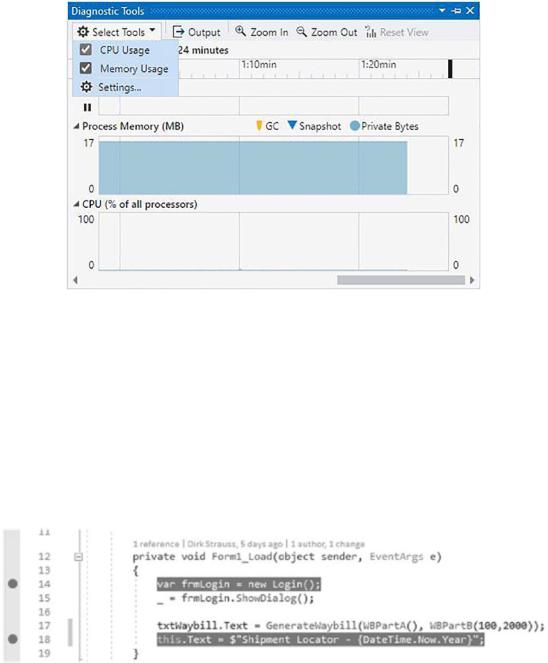
With our Windows Forms application, you can use Diagnostic Tools to monitor memory or CPU usage as seen in Figure 3-38.
194
Chapter 3 Debugging Your Code
Figure 3-38. Select what to analyze
As you debug your application, you can see the CPU usage, memory usage, and other performance-related information.
CPU Usage
A great place to start your performance analysis is the CPU Usage tab. Place two breakpoints in your Form1_Load at the start and end of the function (Figure 3-39) and start debugging.
Figure 3-39. Setting breakpoints to analyze CPU usage
195
Chapter 3 Debugging Your Code
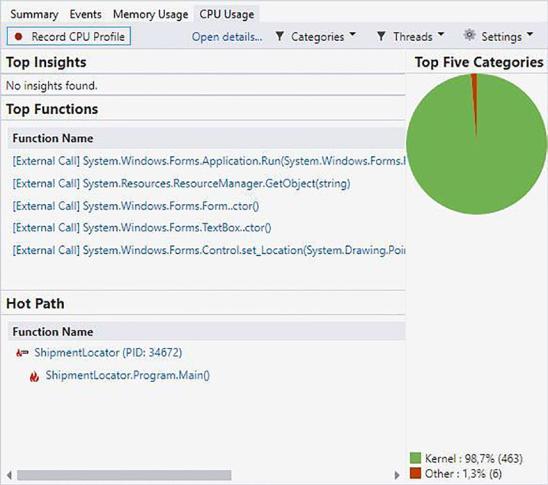
When the debugger reaches the second breakpoint, you will be able to view the summary profiling data for the debug session (as seen in Figure 3-40) at that point. To view detailed profiling data for the region of code you analyzed, click the Open details link under the CPU Usage tab.
Figure 3-40. CPU usage analysis results
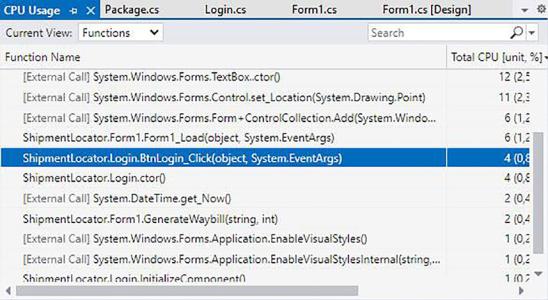
As seen in Figure 3-41, you can view the functions by changing the Current View to Functions in the drop-down.
196
Chapter 3 Debugging Your Code
Figure 3-41. The Current View filtered by functions
If any of the functions in the CPU Usage pane seem to be problematic, double-click the function and then change the Current View to Caller/Callee to view a more detailed three-pane view of the analysis. As seen in Figure 3-42, the left pane will contain the calling function, the middle will contain the selected function, and any called functions will be displayed in the right pane.
197
Chapter 3 Debugging Your Code
Figure 3-42. Butterfly view of BtnLogin_Click
In the Current Function pane, you will see the Function Body section which details the time spent in the function body. As seen in Figure 3-43, you will also see the code represented for this function.
Figure 3-43. The code for the function
Because this excludes the calling and called functions, you get a better understanding of the function you are evaluating and can determine if it is the performance bottleneck or not.
198