
- •Table of Contents
- •About the Author
- •About the Technical Reviewer
- •Acknowledgments
- •Introduction
- •Installing Visual Studio
- •Visual Studio 2022 System Requirements
- •Operating Systems
- •Hardware
- •Supported Languages
- •Additional Notes
- •Visual Studio Is 64-Bit
- •Full .NET 6.0 Support
- •Using Workloads
- •The Solution Explorer
- •Toolbox
- •The Code Editor
- •New Razor Editor
- •What’s Available?
- •Hot Reload
- •Navigating Code
- •Navigate Forward and Backward Commands
- •Navigation Bar
- •Find All References
- •Find Files Faster
- •Reference Highlighting
- •Peek Definition
- •Subword Navigation
- •Features and Productivity Tips
- •Track Active Item in Solution Explorer
- •Hidden Editor Context Menu
- •Open in File Explorer
- •Finding Keyboard Shortcut Mappings
- •Clipboard History
- •Go To Window
- •Navigate to Last Edit Location
- •Multi-caret Editing
- •Sync Namespaces to Match Your Folder Structure
- •Paste JSON As Classes
- •Enable Code Cleanup on Save
- •Add Missing Using on Paste
- •Features in Visual Studio 2022
- •Visual Studio Search
- •Solution Filters
- •Visual Studio IntelliCode
- •Whole Line Completions
- •Visual Studio Live Share
- •Summary
- •Visual Studio Project Types
- •Various Project Templates
- •Console Applications
- •Windows Forms Application
- •Windows Service
- •Web Applications
- •Class Library
- •MAUI
- •Creating a MAUI Application
- •Pairing to Mac for iOS Development
- •Consuming REST Services in MAUI
- •The Complete Weather App
- •The Target Platforms
- •The Required NuGet Package
- •The Weather Models
- •The WeatherService
- •The MainViewModel
- •Registering Dependencies
- •Building the MainPage View
- •Using SQLite in a MAUI Application
- •The ToDoItem Model
- •The ToDoService
- •The MainViewModel
- •Registering Dependencies
- •Building the MainPage View
- •Managing NuGet Packages
- •Using NuGet in Visual Studio
- •Hosting Your Own NuGet Feeds
- •Managing nmp Packages
- •Creating Project Templates
- •Creating and Using Code Snippets
- •Creating Code Snippets
- •Using Bookmarks and Code Shortcuts
- •Bookmarks
- •Code Shortcuts
- •Adding Custom Tokens
- •The Server Explorer
- •Running SQL Queries
- •Visual Studio Windows
- •C# Interactive
- •Code Metrics Results
- •Maintainability Index
- •Cyclomatic Complexity
- •Class Coupling
- •Send Feedback
- •Personalizing Visual Studio
- •Adjust Line Spacing
- •Document Management Customizations
- •The Document Close Button
- •Modify the Dirty Indicator
- •Show Invisible Tabs in Italics in the Tab Drop-Down
- •Colorize Document Tabs
- •Tab Placement
- •Visual Studio Themes
- •Summary
- •Setting a Breakpoint
- •Step into Specific
- •Run to Click
- •Run to Cursor
- •Force Run to Cursor
- •Conditional Breakpoints and Actions
- •Temporary Breakpoints
- •Dependent Breakpoints
- •Dragging Breakpoints
- •Manage Breakpoints with Labels
- •Exporting Breakpoints
- •Using DataTips
- •Visualizing Complex Data Types
- •Bonus Tip
- •Using the Watch Window
- •The DebuggerDisplay Attribute
- •Evaluate Functions Without Side Effects
- •Format Specifiers
- •dynamic
- •hidden
- •results
- •Diagnostic Tools
- •CPU Usage
- •Memory Usage
- •The Events View
- •The Right Tool for the Right Project Type
- •Immediate Window
- •Attaching to a Running Process
- •Attach to a Remote Process
- •Remote Debugger Port Assignments
- •Remote Debugging
- •System Requirements
- •Download and Install Remote Tools
- •Running Remote Tools
- •Start Remote Debugging
- •Summary
- •Creating and Running Unit Tests
- •Create and Run a Test Playlist
- •Testing Timeouts
- •Using Live Unit Tests
- •Using IntelliTest to Generate Unit Tests
- •Focus IntelliTest Code Exploration
- •How to Measure Code Coverage in Visual Studio
- •Summary
- •Create a GitHub Account
- •Create and Clone a Repository
- •Create a Branch from Your Code
- •Creating and Handling Pull Requests
- •Multi-repo Support
- •Compare Branches
- •Check Out Commit
- •Line Staging
- •Summary
- •Index

Chapter 3 Debugging Your Code
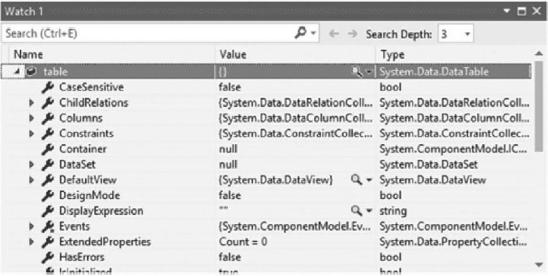
You can easily add a variable to the Watch window by right-clicking the variable and selecting Add Watch from the context menu. Doing this with the table variable in the previous section will add it to the Watch 1 window as illustrated in Figure 3-28.
Figure 3-28. The Watch 1 window
Here, you can open the visualizer by clicking the magnifying glass icon or expanding the table variable to view the other properties of the object. I use the Watch window often as it is a convenient way to keep track of several variables at once.
The DebuggerDisplay Attribute
In the previous section, we discussed how to add a variable to the Watch window in Visual Studio. We saw that we can view the value of a variable or variables easily from this single window.
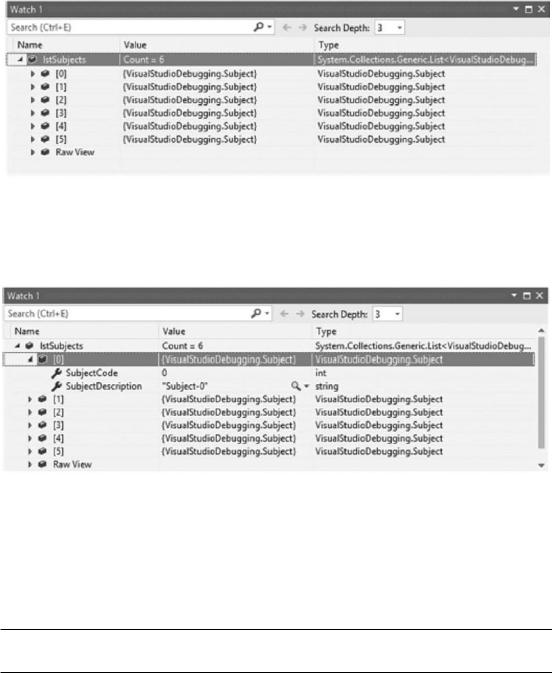
Using the same code we wrote in the previous section, add the variable called lstSubjects to the Watch window, and expand the variable. You will see the values of the lstSubjects variable listed as {VisualStudioDebugging.Subject} in the Value column as seen in Figure 3-29.
186

Chapter 3 Debugging Your Code
Figure 3-29. The lstSubjects variable values
To view the values of each item in the list, we need to expand the list item (Figure 3-30) and inspect the values.
Figure 3-30. View list item values
This will quickly become rather tedious, especially when you are dealing with a rather large list, and you are looking for a specific value.
This is where the DebuggerDisplay attribute comes into play. We are going to modify the Subject class.
Ensure that you add the statement using System.Diagnostics to your code file.
Modify your Subject class as in Listing 3-8.
187