

Chapter 3 Debugging Your Code
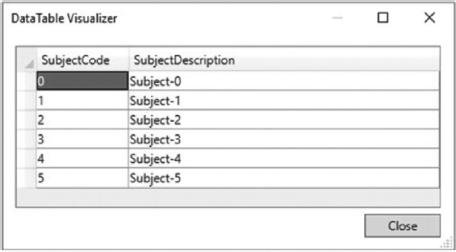
Figure 3-27. DataTable Visualizer
The magnifying glass icon tells us that one or more visualizers are available for the variable, in this example, the DataTable Visualizer.
Bonus Tip
If you are feeling adventurous, pin the DataTip that is displayed when hovering over the table variable, and right-click the pinned DataTip. You can now copy the value, copy the expression, add a new expression, and remove the expression previously added. Go ahead and add the expression in Listing 3-7.
Listing 3-7. Add a DataTip Expression
table.Rows.Count
This is great if you forgot to add a variable watch or just want to see some additional info regarding the variable in the DataTip.
Using the Watch Window
The Watch window allows us to keep track of the value of one or more variables and also allows us to see how these variable values change as one steps through the code.
185