

Chapter 3 Debugging Your Code
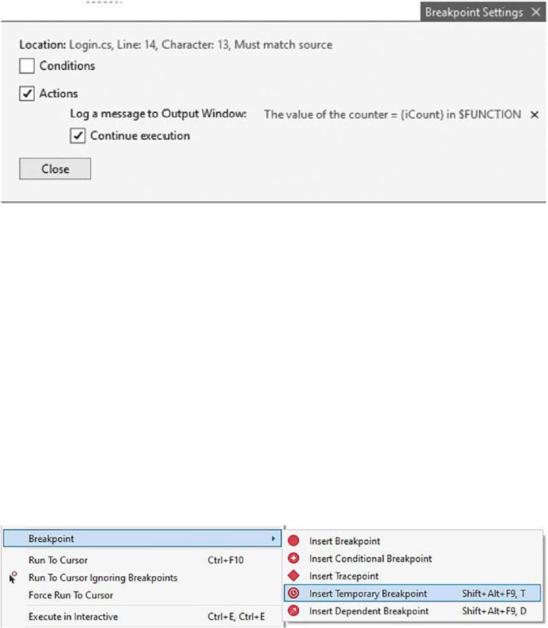
Figure 3-15. The breakpoint action
If you want to pause the code execution, then you need to uncheck the Continue execution checkbox.
Temporary Breakpoints
There might be times when you only want a breakpoint hit once and never again. A scenario could exist where you need to check the change of a variable in several
places, but once this is confirmed to be working, you do not need to check the variable again. Instead of having to add several breakpoints, and having to remove them again afterward, Visual Studio 2022 allows you to set a temporary breakpoint. Right-click the line of code where you want to set the temporary breakpoint, and from the Breakpoint menu item, select Insert Temporary Breakpoint as seen in Figure 3-16.
Figure 3-16. Insert Temporary Breakpoint
You can also hold down Shift+Alt+F9, T to do the same thing.
176
Chapter 3 Debugging Your Code
Dependent Breakpoints
If you look at Figure 3-16 again, you will notice an option to insert a dependent breakpoint. A dependent breakpoint is a fantastic addition to Visual Studio because it is a breakpoint that will only pause the debugger when another breakpoint is hit on which it has been marked as a dependent.
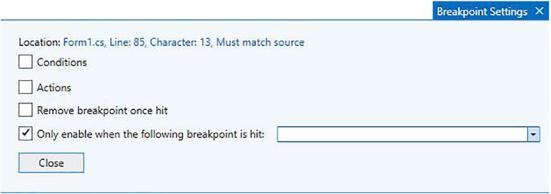
As seen in Figure 3-17, you can click the drop-down menu which will show you a list of other breakpoints to choose from. After selecting a dependent breakpoint, the debugger will only pause when the breakpoint you selected from the drop-down is hit.
Figure 3-17. Insert a dependent breakpoint
Dragging Breakpoints
You can also drag breakpoints to a different line of code. To do this, click and hold on the breakpoint and start dragging your mouse. You can now move it to another line.
Manage Breakpoints with Labels
As you continue debugging your application, you will be setting many breakpoints throughout the code. Different developers have different ways of debugging. Personally, I add and remove breakpoints as needed, but some developers might end up with a lot of set breakpoints as seen in Figure 3-18.
177
Chapter 3 Debugging Your Code
Figure 3-18. Many breakpoints set
This is where the Breakpoints window comes in handy. Think of it as mission control for managing complex debugging sessions. This is especially helpful in large solutions where you might have many breakpoints set at various code files throughout your solution.
The Breakpoints window allows developers to manage the breakpoints that they have set by allowing them to search, sort, filter, enable, disable, and delete breakpoints. The Breakpoints window also allows developers to specify conditional breakpoints and actions.
To open the Breakpoints window, click the Debug menu, Windows, and then Breakpoints. You can also press Ctrl+D, Ctrl+B. The Breakpoints window will now be displayed as seen in Figure 3-19.
178
Chapter 3 Debugging Your Code
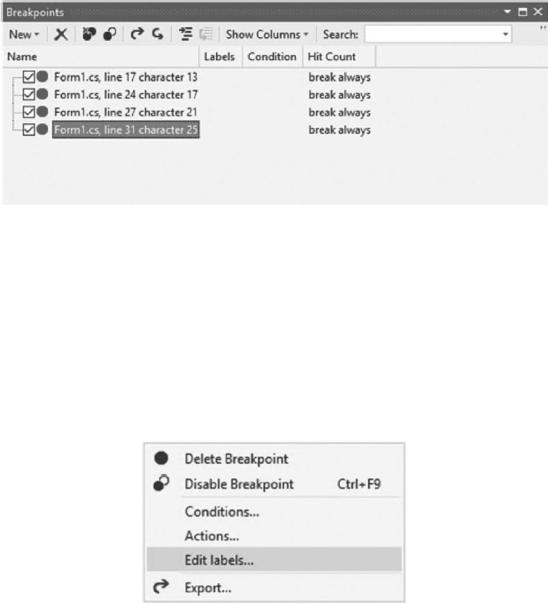
Figure 3-19. Breakpoints window
Compare the line numbers of the breakpoints listed in Figure 3-19 with the breakpoints displayed in Figure 3-18. You will see that this accurately reflects the breakpoints displayed in the Breakpoints window.
The only problem with this window is that it doesn’t help you much in the way of managing your breakpoints. At the moment, the only information displayed in the Breakpoints window is the class name and the line number.
This is where breakpoint labels are very beneficial. To set a breakpoint label, rightclick a breakpoint, and click Edit labels from the context menu as seen in Figure 3-20.
Figure 3-20. Edit breakpoint labels
The Edit breakpoint labels window is then displayed as seen in Figure 3-21.
179
Chapter 3 Debugging Your Code
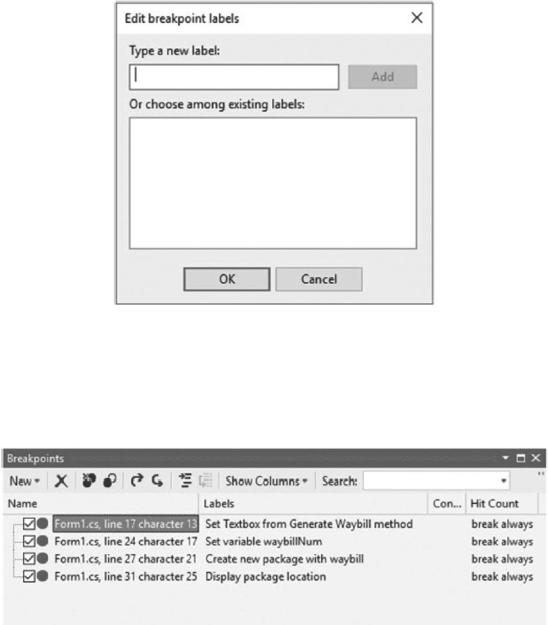
Figure 3-21. Add a new breakpoint label
You can type in a new label or choose from any of the existing labels available. If you swing back to the Breakpoints window, you will see that these labels are displayed (Figure 3-22), making the identification and management of your breakpoints much easier.
Figure 3-22. Breakpoints window with labels set
You are in a better position now with the breakpoint labels set to manage your breakpoints more effectively.
180