
- •Table of Contents
- •About the Author
- •About the Technical Reviewer
- •Acknowledgments
- •Introduction
- •Installing Visual Studio
- •Visual Studio 2022 System Requirements
- •Operating Systems
- •Hardware
- •Supported Languages
- •Additional Notes
- •Visual Studio Is 64-Bit
- •Full .NET 6.0 Support
- •Using Workloads
- •The Solution Explorer
- •Toolbox
- •The Code Editor
- •New Razor Editor
- •What’s Available?
- •Hot Reload
- •Navigating Code
- •Navigate Forward and Backward Commands
- •Navigation Bar
- •Find All References
- •Find Files Faster
- •Reference Highlighting
- •Peek Definition
- •Subword Navigation
- •Features and Productivity Tips
- •Track Active Item in Solution Explorer
- •Hidden Editor Context Menu
- •Open in File Explorer
- •Finding Keyboard Shortcut Mappings
- •Clipboard History
- •Go To Window
- •Navigate to Last Edit Location
- •Multi-caret Editing
- •Sync Namespaces to Match Your Folder Structure
- •Paste JSON As Classes
- •Enable Code Cleanup on Save
- •Add Missing Using on Paste
- •Features in Visual Studio 2022
- •Visual Studio Search
- •Solution Filters
- •Visual Studio IntelliCode
- •Whole Line Completions
- •Visual Studio Live Share
- •Summary
- •Visual Studio Project Types
- •Various Project Templates
- •Console Applications
- •Windows Forms Application
- •Windows Service
- •Web Applications
- •Class Library
- •MAUI
- •Creating a MAUI Application
- •Pairing to Mac for iOS Development
- •Consuming REST Services in MAUI
- •The Complete Weather App
- •The Target Platforms
- •The Required NuGet Package
- •The Weather Models
- •The WeatherService
- •The MainViewModel
- •Registering Dependencies
- •Building the MainPage View
- •Using SQLite in a MAUI Application
- •The ToDoItem Model
- •The ToDoService
- •The MainViewModel
- •Registering Dependencies
- •Building the MainPage View
- •Managing NuGet Packages
- •Using NuGet in Visual Studio
- •Hosting Your Own NuGet Feeds
- •Managing nmp Packages
- •Creating Project Templates
- •Creating and Using Code Snippets
- •Creating Code Snippets
- •Using Bookmarks and Code Shortcuts
- •Bookmarks
- •Code Shortcuts
- •Adding Custom Tokens
- •The Server Explorer
- •Running SQL Queries
- •Visual Studio Windows
- •C# Interactive
- •Code Metrics Results
- •Maintainability Index
- •Cyclomatic Complexity
- •Class Coupling
- •Send Feedback
- •Personalizing Visual Studio
- •Adjust Line Spacing
- •Document Management Customizations
- •The Document Close Button
- •Modify the Dirty Indicator
- •Show Invisible Tabs in Italics in the Tab Drop-Down
- •Colorize Document Tabs
- •Tab Placement
- •Visual Studio Themes
- •Summary
- •Setting a Breakpoint
- •Step into Specific
- •Run to Click
- •Run to Cursor
- •Force Run to Cursor
- •Conditional Breakpoints and Actions
- •Temporary Breakpoints
- •Dependent Breakpoints
- •Dragging Breakpoints
- •Manage Breakpoints with Labels
- •Exporting Breakpoints
- •Using DataTips
- •Visualizing Complex Data Types
- •Bonus Tip
- •Using the Watch Window
- •The DebuggerDisplay Attribute
- •Evaluate Functions Without Side Effects
- •Format Specifiers
- •dynamic
- •hidden
- •results
- •Diagnostic Tools
- •CPU Usage
- •Memory Usage
- •The Events View
- •The Right Tool for the Right Project Type
- •Immediate Window
- •Attaching to a Running Process
- •Attach to a Remote Process
- •Remote Debugger Port Assignments
- •Remote Debugging
- •System Requirements
- •Download and Install Remote Tools
- •Running Remote Tools
- •Start Remote Debugging
- •Summary
- •Creating and Running Unit Tests
- •Create and Run a Test Playlist
- •Testing Timeouts
- •Using Live Unit Tests
- •Using IntelliTest to Generate Unit Tests
- •Focus IntelliTest Code Exploration
- •How to Measure Code Coverage in Visual Studio
- •Summary
- •Create a GitHub Account
- •Create and Clone a Repository
- •Create a Branch from Your Code
- •Creating and Handling Pull Requests
- •Multi-repo Support
- •Compare Branches
- •Check Out Commit
- •Line Staging
- •Summary
- •Index

Chapter 3 Debugging Your Code
you forced the debugger to, skipping all the breakpoints in between. This is especially convenient since I do not have to remove my breakpoints, nor do I have to keep on pressing F5 for each breakpoint hit.
Conditional Breakpoints and Actions
Sometimes, you need to use a condition to catch a bug. Let’s say that you are in a for loop, and the bug seems to be data related. The erroneous data only seems to enter the loop after several hundred iterations. If you set a regular breakpoint, you will be pressing F10 until your keyboard stops working.
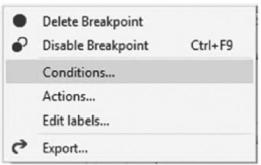
This is a perfect use case for using conditional breakpoints. You can now tell the debugger to break when a specific condition is true. To set a conditional breakpoint, right-click the breakpoint, and click Conditions from the context menu as seen in Figure 3-9.
Figure 3-9. Breakpoint context menu
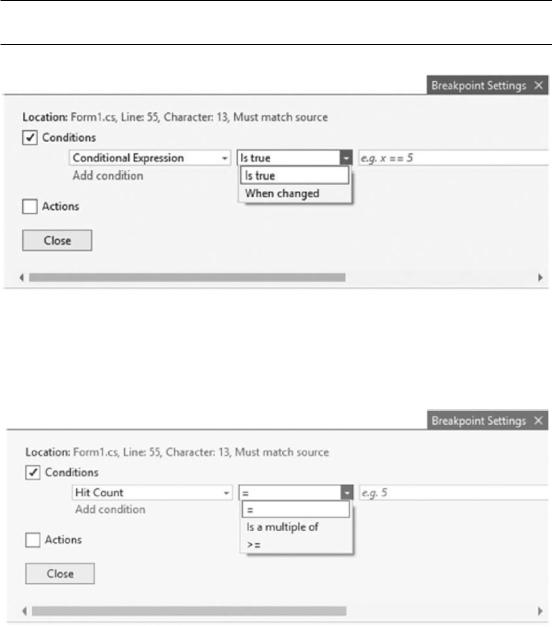
You can now select a conditional expression and select to break if this condition is true or when changed as seen in Figure 3-10.
172

Chapter 3 Debugging Your Code
We will discuss Actions shortly.
Figure 3-10. Conditional expression
You can also select to break when the Hit Count is equal to, a multiple of, or greater or equal to a value you set as seen in Figure 3-11.
Figure 3-11. Hit Count condition
The last condition you can set on a conditional breakpoint is a Filter as seen in Figure 3-12.
173

Chapter 3 Debugging Your Code
Figure 3-12. Filter condition
You will have noticed the Actions checkbox from the Breakpoint Settings. You will also see the Actions menu on the context menu in Figure 3-9. Here, you can add an expression to log to the Output Window using specific keywords that are accessed using the $ symbol.
The special keywords are as follows:
•\ |
$ADDRESS – Current instruction |
•\ |
$CALLER – Previous function name |
•\ |
$CALLSTACK – Call stack |
•\ |
$FILEPOS – The current file and line position |
•\ |
$FUNCTION – Current function name |
•\ |
$PID – Process ID |
•\ |
$PNAME – Process name |
•\ |
$TICK – Milliseconds elapsed since the system was started, up to |
|
49.7 days |
•\ |
$TID – Thread ID |
•\ |
$TNAME – Thread name |
You can now use these special keywords to write an entry to the Output Window. You can include the value of a variable by placing it between curly braces (think of interpolated strings). Listing 3-3 shows an example of an expression that uses the $FUNCTION keyword.
174

Chapter 3 Debugging Your Code
Listing 3-3. Action Expression
The value of the counter = {iCount} in $FUNCTION
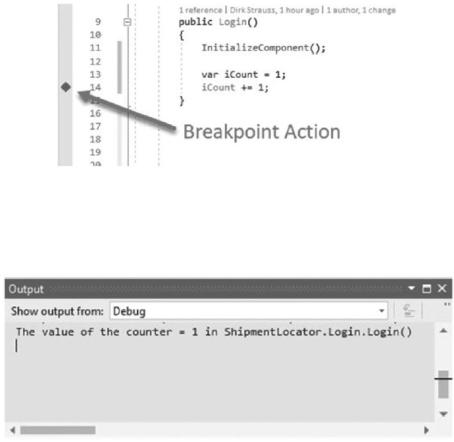
Placing this breakpoint action in the constructor of the Login() form of the ShipmentLocator application will be indicated by a diamond instead of a circle as seen in Figure 3-13.
Figure 3-13. Breakpoint action
When you run your application, you will see the expression output in the Output Window as seen in Figure 3-14.
Figure 3-14. Action expression in Output Window
This is great for debugging because if you don’t select a condition, the Action will be displayed in the Output Window without hitting the breakpoint and pausing the code. The breakpoint action can be seen in Figure 3-15.
175