

Chapter 3 Debugging Your Code
This will advance the debugger to the line of code where you clicked, allowing you to continue stepping through the code from the new location. Quite handy if you do not want to be pressing F10 a gazillion times.
Run toCursor
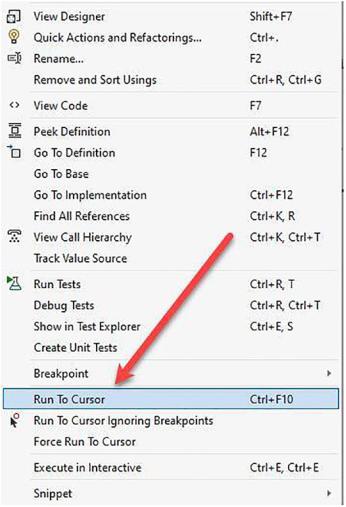
Run to Cursor works similarly to Run to Click. The difference is that with Run to Cursor you are not debugging. With the debugger stopped, you can right-click a line of code and click Run to Cursor from the context menu as seen in Figure 3-7.
Figure 3-7. Run to Cursor
170
Chapter 3 Debugging Your Code
Doing this will start the debugger and set a temporary breakpoint on the line you right-clicked. This is useful for quickly setting a breakpoint and starting the debugger at the same time. When you reach the breakpoint, you can continue debugging as normal.
Be aware though that you will be hitting any other breakpoints set before the temporary breakpoint first. So, you will need to keep on pressing F5 until you reach the line of code you set the temporary breakpoint on.
Force Run to Cursor
Visual Studio 2022 will now allow you to skip any breakpoints between the line of code your breakpoint is on and the line of code that you want to debug. This is done with Force Run to Cursor on the context menu which can be seen in Figure 3-7. You can also easily access this while debugging as seen in Figure 3-8.
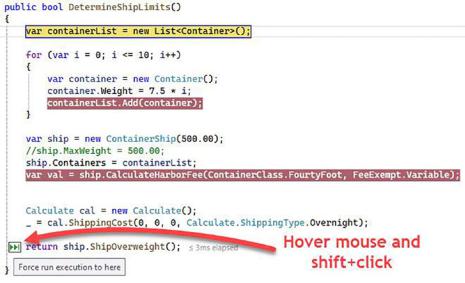
Figure 3-8. Force Run to Cursor
Here, we have a breakpoint at the top of the method that is currently hit, and the debugger is paused. I want to run the cursor to the return statement, but there are two breakpoints between where my debugger is and where I want to be. To skip the
breakpoints in the middle, hover the mouse over the line that you want to move to next, and hold down the Shift key. The Run to execution button with the single arrow (as seen in Figure 3-6) now changes to the Force run execution to here button with a double arrow as seen in Figure 3-8. This will now advance the debugger to the line of code
171