
- •Table of Contents
- •About the Author
- •About the Technical Reviewer
- •Acknowledgments
- •Introduction
- •Installing Visual Studio
- •Visual Studio 2022 System Requirements
- •Operating Systems
- •Hardware
- •Supported Languages
- •Additional Notes
- •Visual Studio Is 64-Bit
- •Full .NET 6.0 Support
- •Using Workloads
- •The Solution Explorer
- •Toolbox
- •The Code Editor
- •New Razor Editor
- •What’s Available?
- •Hot Reload
- •Navigating Code
- •Navigate Forward and Backward Commands
- •Navigation Bar
- •Find All References
- •Find Files Faster
- •Reference Highlighting
- •Peek Definition
- •Subword Navigation
- •Features and Productivity Tips
- •Track Active Item in Solution Explorer
- •Hidden Editor Context Menu
- •Open in File Explorer
- •Finding Keyboard Shortcut Mappings
- •Clipboard History
- •Go To Window
- •Navigate to Last Edit Location
- •Multi-caret Editing
- •Sync Namespaces to Match Your Folder Structure
- •Paste JSON As Classes
- •Enable Code Cleanup on Save
- •Add Missing Using on Paste
- •Features in Visual Studio 2022
- •Visual Studio Search
- •Solution Filters
- •Visual Studio IntelliCode
- •Whole Line Completions
- •Visual Studio Live Share
- •Summary
- •Visual Studio Project Types
- •Various Project Templates
- •Console Applications
- •Windows Forms Application
- •Windows Service
- •Web Applications
- •Class Library
- •MAUI
- •Creating a MAUI Application
- •Pairing to Mac for iOS Development
- •Consuming REST Services in MAUI
- •The Complete Weather App
- •The Target Platforms
- •The Required NuGet Package
- •The Weather Models
- •The WeatherService
- •The MainViewModel
- •Registering Dependencies
- •Building the MainPage View
- •Using SQLite in a MAUI Application
- •The ToDoItem Model
- •The ToDoService
- •The MainViewModel
- •Registering Dependencies
- •Building the MainPage View
- •Managing NuGet Packages
- •Using NuGet in Visual Studio
- •Hosting Your Own NuGet Feeds
- •Managing nmp Packages
- •Creating Project Templates
- •Creating and Using Code Snippets
- •Creating Code Snippets
- •Using Bookmarks and Code Shortcuts
- •Bookmarks
- •Code Shortcuts
- •Adding Custom Tokens
- •The Server Explorer
- •Running SQL Queries
- •Visual Studio Windows
- •C# Interactive
- •Code Metrics Results
- •Maintainability Index
- •Cyclomatic Complexity
- •Class Coupling
- •Send Feedback
- •Personalizing Visual Studio
- •Adjust Line Spacing
- •Document Management Customizations
- •The Document Close Button
- •Modify the Dirty Indicator
- •Show Invisible Tabs in Italics in the Tab Drop-Down
- •Colorize Document Tabs
- •Tab Placement
- •Visual Studio Themes
- •Summary
- •Setting a Breakpoint
- •Step into Specific
- •Run to Click
- •Run to Cursor
- •Force Run to Cursor
- •Conditional Breakpoints and Actions
- •Temporary Breakpoints
- •Dependent Breakpoints
- •Dragging Breakpoints
- •Manage Breakpoints with Labels
- •Exporting Breakpoints
- •Using DataTips
- •Visualizing Complex Data Types
- •Bonus Tip
- •Using the Watch Window
- •The DebuggerDisplay Attribute
- •Evaluate Functions Without Side Effects
- •Format Specifiers
- •dynamic
- •hidden
- •results
- •Diagnostic Tools
- •CPU Usage
- •Memory Usage
- •The Events View
- •The Right Tool for the Right Project Type
- •Immediate Window
- •Attaching to a Running Process
- •Attach to a Remote Process
- •Remote Debugger Port Assignments
- •Remote Debugging
- •System Requirements
- •Download and Install Remote Tools
- •Running Remote Tools
- •Start Remote Debugging
- •Summary
- •Creating and Running Unit Tests
- •Create and Run a Test Playlist
- •Testing Timeouts
- •Using Live Unit Tests
- •Using IntelliTest to Generate Unit Tests
- •Focus IntelliTest Code Exploration
- •How to Measure Code Coverage in Visual Studio
- •Summary
- •Create a GitHub Account
- •Create and Clone a Repository
- •Create a Branch from Your Code
- •Creating and Handling Pull Requests
- •Multi-repo Support
- •Compare Branches
- •Check Out Commit
- •Line Staging
- •Summary
- •Index

Chapter 3 Debugging Your Code
through the code and view the values stored in variables. More importantly, you can see how those values change.
Setting aBreakpoint
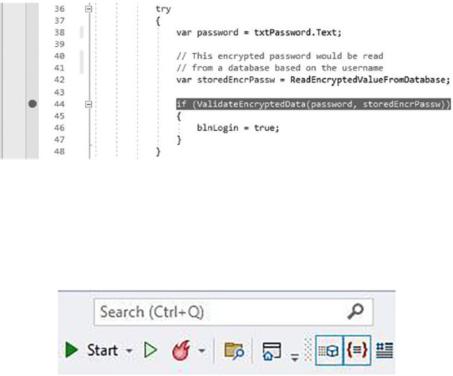
The most basic task of debugging is setting a breakpoint. Breakpoints mark the lines of code that you want Visual Studio to pause at, allowing you to take a closer look at what the code is doing at that particular point in time. To place a breakpoint in code, click the margin to the left of the line of code you want to inspect as seen in Figure 3-1.
Figure 3-1. Setting a breakpoint
This line of code is contained in the ValidateLogin() method. The method is called when the user clicks the login button. Press F5 or click Debug Start Debugging to run your application. You can also just click the Start button as shown in Figure 3-2.
Figure 3-2. The Start button
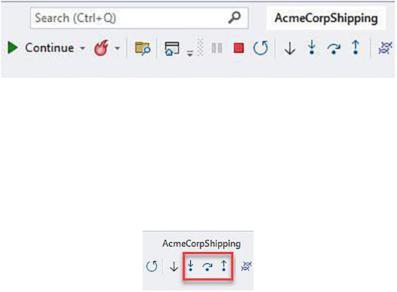
After you start debugging, and a breakpoint is hit, the debug toolbar in Visual Studio changes as seen in Figure 3-3.
166

Chapter 3 Debugging Your Code
Figure 3-3. Debug toolbar when breakpoint hit
The Start button now changes to display Continue. Remember, at this point, your code execution is paused in Visual Studio at the breakpoint you set earlier.
In order to step through your code, you can click the step buttons as displayed in Figure 3-4.
Figure 3-4. Step buttons
From left to right, these buttons are as follows:
•\ |
Step Into (F11) |
•\ |
Step Over (F10) |
•\ |
Step Out (Shift+F11) |
When you step into a method, you jump to the point in the editor where that method’s code is. If you do not want to step into the method, you can click the Step Over button or press F10 to carry on with the next line of code. If you are inside a method and want to step out and continue debugging the calling code, click the Step Out button or press Shift+F11.
Step into Specific
Imagine that we need a method that generates a waybill number based on specific business rules. Then, when the application starts, the text box field is auto populated with the generated waybill number.
The code used to generate the random waybill functionality is listed in Listing 3-1.
167
Chapter 3 Debugging Your Code
Listing 3-1. Waybill Generation Code
private string GenerateWaybill(string partA, int rndNum) => $"{partA}- {rndNum}-{DateTime.Now.Year}-{DateTime.Now.Month}";
private string WBPartA() => "acme-"; private int WBPartB(int min, int max)
{
var rngCrypto = new RNGCryptoServiceProvider(); var bf = new byte[4];
rngCrypto.GetBytes(bf);
var result = BitConverter.ToInt32(bf, 0); return new Random(result).Next(min, max);
}
In the form load of the tracking application, we then make a call to the GenerateWaybill() method and pass it the other two methods WBPartA() and WBPartB() as parameters as seen in Listing 3-2.
Listing 3-2. Form Load
private void Form1_Load(object sender, EventArgs e)
{
var frmLogin = new Login(); _ = frmLogin.ShowDialog();
txtWaybill.Text = GenerateWaybill(WBPartA(), WBPartB(100,2000));
}
If you had placed a breakpoint on the line of code that contains the GenerateWaybill() method and step into the methods by pressing F11, you would first step into method WBPartA(), then into method WBPartB(), and lastly into the
GenerateWaybill() method.
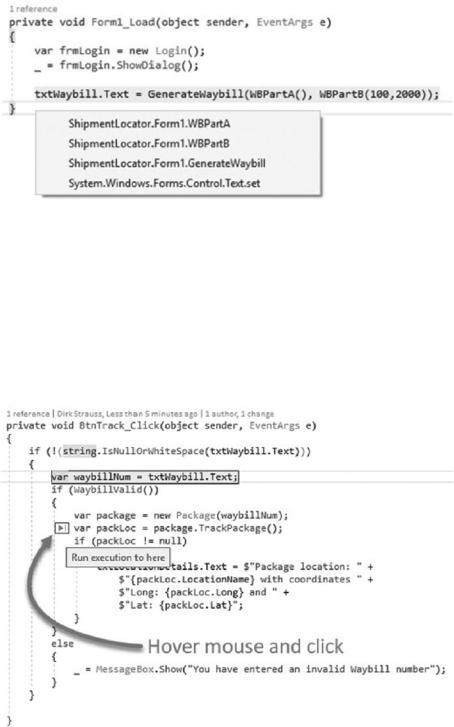
Did you know that you can choose which method to step into? When the breakpoint is hit, hold down Alt+Shift+F11 and Visual Studio will pop up a menu for you to choose from as seen in Figure 3-5.
168

Chapter 3 Debugging Your Code
Figure 3-5. Step into specific
Simply select the method you want to step into and off you go.
Run toClick
When you start debugging and you hit a breakpoint, you can jump around quickly within the code by clicking the Run to Click button. While in the debugger, hover your mouse over a line of code as seen in Figure 3-6, and click the Run to Click button that pops up.
Figure 3-6. Run to Click
169