

Lessons In Industrial Instrumentation-16
.pdf3104 |
APPENDIX A. FLIP-BOOK ANIMATIONS |
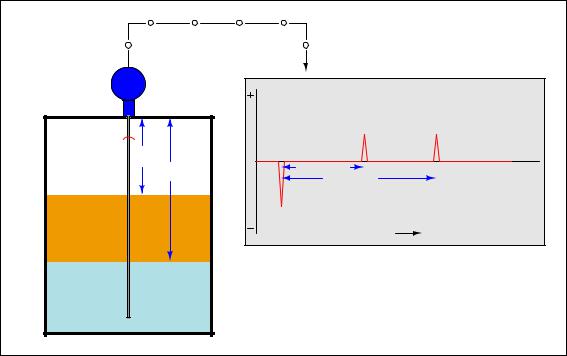
Guided-wave radar level transmitter
Air
Oil
Water
Surface
ullage
Interface
ullage
Signal |
|
Surface pulse |
Interface pulse |
Surface ullage |
|
Interface ullage |
|
Reference pulse |
|
Time |
|
Received echo waveform plot

A.5. GUIDED-WAVE RADAR LEVEL MEASUREMENT |
3105 |
Guided-wave radar level transmitter
Air
Oil
Water
Surface
ullage
Interface
ullage
Signal |
|
Surface pulse |
Interface pulse |
Surface ullage |
|
Interface ullage |
|
Reference pulse |
|
Time |
|
Received echo waveform plot
3106 |
APPENDIX A. FLIP-BOOK ANIMATIONS |
Guided-wave radar level transmitter
Air
Oil
Water
Surface
ullage
Interface
ullage
Signal |
|
Surface pulse |
Interface pulse |
Surface ullage |
|
Interface ullage |
|
Reference pulse |
|
Time |
|
Received echo waveform plot

A.5. GUIDED-WAVE RADAR LEVEL MEASUREMENT |
3107 |
Guided-wave radar level transmitter
Air
Oil
Water
Surface
ullage
Interface
ullage
Signal |
|
Surface pulse |
Interface pulse |
Surface ullage |
|
Interface ullage |
|
Reference pulse |
|
Time |
|
Received echo waveform plot

3108 |
APPENDIX A. FLIP-BOOK ANIMATIONS |
Guided-wave radar level transmitter
Air
Oil
Water
Surface
ullage
Interface
ullage
Signal |
|
Surface pulse |
Interface pulse |
Surface ullage |
|
Interface ullage |
|
Reference pulse |
|
Time |
|
Received echo waveform plot

A.5. GUIDED-WAVE RADAR LEVEL MEASUREMENT |
3109 |
Guided-wave radar level transmitter
Air
Oil
Water
Surface
ullage
Interface
ullage
Signal |
|
Surface pulse |
Interface pulse |
Surface ullage |
|
Interface ullage |
|
Reference pulse |
|
Time |
|
Received echo waveform plot

3110 |
APPENDIX A. FLIP-BOOK ANIMATIONS |
Guided-wave radar level transmitter
Air
Oil
Water
Surface
ullage
Interface
ullage
Signal |
|
Surface pulse |
Interface pulse |
Surface ullage |
|
Interface ullage |
|
Reference pulse |
|
Time |
|
Received echo waveform plot

A.5. GUIDED-WAVE RADAR LEVEL MEASUREMENT |
3111 |
Guided-wave radar level transmitter
Air
Oil
Water
Surface
ullage
Interface
ullage
Probe
length
Signal |
|
Surface pulse |
Interface pulse |
Surface ullage |
|
Interface ullage |
|
Probe length |
|
Reference pulse |
|
Time |
|
Received echo waveform plot
3112 |
APPENDIX A. FLIP-BOOK ANIMATIONS |
A.6 Basic chromatograph operation
This animation shows the basic operation of a gas chromatograph, showing the separation of di erent molecular species in a gas mixture. Each gas type is represented by a di erent colored dot moving along the tubing.
Carrier gas is represented by orange dots moving constantly through the sample valve and column. Process sample is represented by a cluster of three dots: red (light), green (medium), and blue (heavy) molecules mixed together. These molecules move together at the same rate until they reach the column. There, the light molecules (red) travel fastest, the medium molecules (green) travel slower, and the heavy molecules (blue) travel slowest. Thus, the di ering velocities within the chromatograph column performs the task of separation necessary to identify and measure each chemical component in the mixture. All the while, you can see the chromatogram developing, a peak appearing each time one of the components reaches the detector.
Each chemical component (light, medium, heavy) is thus identified by its place in time when its peak appears on the chromatogram, while the concentration (quantity) of each component is discernible by the area integrated underneath each peak.

A.6. BASIC CHROMATOGRAPH OPERATION |
3113 |
Sample valve
(vent) 
|
|
|
|
|
|
|
|
= light |
|
||
From process |
= medium |
|
|||
= heavy |
|
||||
|
|
= carrier |
|
||
|
|
|
|
|
|
|
|
|
|
|
|
|
|
|
|
|
|
Carrier gas supply cylinder
Column Detector

 (vent)
Detector signal
Time