

1574 |
CHAPTER 21. CONTINUOUS TEMPERATURE MEASUREMENT |
21.5.3Emissivity
Aside from their inherent nonlinearity, perhaps the main disadvantage of non-contact temperature sensors is their inaccuracy. The emissivity factor (e) in the Stefan-Boltzmann equation varies with the composition of a substance, but beyond that there are several other factors (surface finish, shape, etc.) that a ect the amount of radiation a sensor will receive from an object. For this reason, emissivity is not a very practical way to gauge the e ectiveness of a non-contact pyrometer. Instead, a more comprehensive measure of an object’s “thermal-optical measureability” is emittance.
A perfect emitter of thermal radiation is known as a blackbody. Emittance for a blackbody is unity (1), while emittance figures for any real object is a value between 1 and 0. The only certain way to know the emittance of an object is to test that object’s thermal radiation at a known temperature. This assumes we have the ability to measure that object’s temperature by direct contact, which of course renders void one of the major purposes of non-contact thermometry: to be able to measure an object’s temperature without having to touch it. Not all hope is lost, though: all we have to do is obtain an emittance value for that object one time, and then we may calibrate any non-contact pyrometer for that object’s particular emittance so as to measure its temperature in the future without contact.
Beyond the issue of emittance, other idiosyncrasies plague non-contact pyrometers. Objects also have the ability to reflect and transmit radiation from other bodies, which taints the accuracy of any non-contact device sensing the radiation from that body. An example of the former is trying to measure the temperature of a silver mirror using an optical pyrometer: the radiation received by the pyrometer is mostly from other objects, merely reflected by the mirror. An example of the latter is trying to measure the temperature of a gas or a clear liquid, and instead primarily measuring the temperature of a solid object in the background (through the gas or liquid).
Nevertheless, non-contact pyrometers have been and will continue to be useful in specific applications where other, contact-based temperature measurement techniques are impractical.
21.5.4Thermal imaging
A very useful application of non-contact sensor technology is thermal imaging, where a dense array of infrared radiation sensors provides a graphic display of objects in its view according to their temperatures. Each object shown on the digital display of a thermal imager is artificially colored in the display on a chromatic scale that varies with temperature, hot objects typically registering as red tones and cold objects typically registering as blue tones. Thermal imaging is very useful in the electric power distribution industry, where technicians may inspect power line insulators and other objects at elevated potential for “hot spots” without having to make physical contact with those objects. Thermal imaging is also useful in performing “energy audits” of buildings and other heated structures, providing a means of revealing points of heat escape through walls, windows, and roofs. In such applications, relative di erences in temperature are often more important to detect than specific temperature values. “Hot spots” readily appear on a thermal imager display, and may give useful data on the test subject even in the absence of accurate temperature measurement at any one spot.
Again, it is important to stress that thermal imaging only provides an assessment of the object’s surface temperature, and not the temperature within that object. Variations in surface temperature detectable by thermal imaging are a secondary e ect of temperature variations within the object, and as such may not accurately depict the true thermal gradient(s) within the object.
21.5. NON-CONTACT TEMPERATURE SENSORS |
1575 |
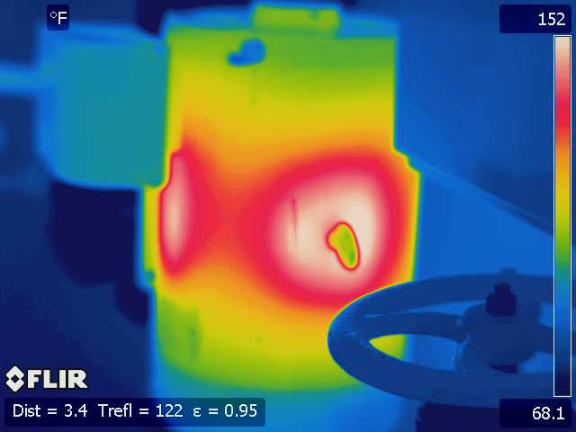
A digital image taken with a thermal imaging instrument by maintenance personnel at a municipal water treatment facility shows “hot spots” on an electric motor. A color scale on the right-hand side of the image serves as a “legend” for interpreting color as temperature. In this particular shot, dark blue is 68.1 oF and white is 152 oF:
This particular electric motor is in a vertical orientation, with the electrical connection box in the upper-left corner and two prominent hot spots on both the near and the left-facing sides of the case. A manual valve handle appears in the foreground, silhouetted in dark blue against a lighter blue (warmer) background. A lifting “eye” on the motor case appears as a green (cooler) shape in the middle of a white (warmer) area. The two “hot spots” correspond directly to stator windings and magnetic pole faces inside the motor, which are close enough to the motor’s casing to cause variations in surface temperature.

1576 |
CHAPTER 21. CONTINUOUS TEMPERATURE MEASUREMENT |
Thermal imaging is particularly useful for detecting hot spots on equipment unsafe to directly touch, as is the case with many “live” electrical components. This next thermal image shows an operating three-phase motor starter (contactor and overload block):
The bright spot in the center of the contactor is the higher temperature of the electromagnetic coil, providing magnetic force to actuate the contactor mechanism. Perhaps the most telling detail of this thermal image, however, is the di erence in temperature between the overload heater connections (the six screws located near the bottom of the starter assembly). Note how the middle heater’s screws register slightly higher temperatures than the screws on either of the other two heater elements. Large temperature di erences may indicate poor electrical connections (i.e. greater resistance) at the hot spots, or imbalances in phase current. It is also possible that the elevated temperature of this particular overload heater is simply due to it having less open surface area for it to radiate heat, since the two overload heaters flanking it enjoy the advantage of having more air cooling. If three people pack themselves into a narrow bench seat, the middle person is going to be warmer than either of the outer two!
Another noteworthy detail in this image is the “Spot Di erence” measurement provided by the
21.5. NON-CONTACT TEMPERATURE SENSORS |
1577 |
thermal imager. A cross-hair cursor on the display serves to locate a particular spot in the image, which in this case is contrasted against a reference spot chosen in an earlier step. The instrument automatically subtracts the current and reference spot temperatures to give a T indication, in this particular case 84.7 oF.
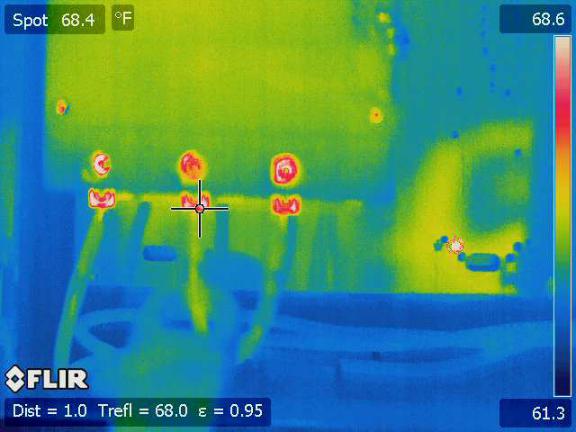
A thermal image of a three-phase circuit breaker shows a much more even distribution of temperature:
The hottest objects in this image are the three load screw terminals, appearing as white/red against a blue/green background. Note the range of the temperature scale on the right of the image: this particular image only spans a temperature range of 61.3 oF to 68.6 oF. This narrow temperature range tells us the di erences in temperature shown by colors in this image are nothing to worry about.
Here, the instrument provides a single-point temperature measurement of 68.4 oF at the cursor (“Spot”) location rather than a di erential temperature measurement between two points.